Week of Dec 15, 2020
New feature
UI/UX: A new platform navigation is created to allow for more streamlined workflows across the OpsRamp platform. The new navigation bar is currently an opt-in experience and becomes the default with the OpsRamp 9.0.0 release coming in early 2021.
Notes
- Custom header and link colors do not work.
- Breadcrumbs are removed from Setup, Infrastructure, and Reports.
Issues fixed
- Gateway: Fixed an issue that blocked users from deleting discovery profiles of unregistered gateways.
- Reports: Fixed an issue that prevented scheduled generation of Patching reports.
- Knowledge Base: Fixed an issue that did not allow the creation of hyperlinks in knowledge base articles.
- Templates: Fixed an issue that blocked users from completing the configuration parameters for G2 windows service monitoring templates.
- Alerts: Fixed an issue that blocked rendering of the alert body for generated alerts.
- Resource Groups: Fixed an issue that blocked users from creating partner level resource groups using an advanced search query.
- Update Agent: Fixed an issue that blocked users from selecting the agent platform in the agent Advanced Search section. This blocker made it difficult to select an agent platform to update to the latest version.
Week of Dec 1, 2020
Issues fixed
- Alert Escalation: Previously, the resource types selection in alert escalation policies was not appearing in the alphabetical series. Now, this field is alphabetized to allow users to easily find the resource types required in creating a policy.
- Inventory Reports: Fixed an issue in reports that blocked users from editing filtering rules after the report had run.
- Metric Report: Fixed an issue in Metric Reports that prevented all applicable resources from being fetched and displayed in the report.
- Tickets: Fixed an issue in email templates to resolve appearance of the unwanted HTML text when a space was found.
- Exporting CSV file: Fixed an issue blocking users from exporting the metric data from graphs into a .csv file.
- Template: Fixed an issue creating inconsistencies between what the CDP command generated on the end device versus what was displayed in the OpsRamp user interface.
- Infrastructure: Fixed an issue blocking the global search of resources (partner level) from displaying the proper results.
- Discovery: Fixed an issue for the Meraki API integration. Previously, Meraki Access Points (APs) without a name were getting dropped from discovery. Now, OpsRamp uses the IP or MAC address for the name of the resource in scenarios where there is no name found through discovery.
- Resource: Fixed an issue that blocked users with Apply Monitor Template and Customize Monitor permissions from applying monitoring templates at the resource level.
Week of Nov 17, 2020
Enhancements
- Patch Management: Administrators now have the ability to escalate alerts after the maintenance window for patching has concluded. This enhancement makes it easier to detect alerts possibly created during the maintenance window. For more information, see Adding and scheduling patches.
- Linux Agent: “The OpsRamp Linux Agent (For example, RHEL, Ubuntu, SUSE, and CentOS) now supports the use of a non-root user for installation. Instead, administrators can use a custom user on the linux host for deploying the OpsRamp agent. For more information, see the Deploying Agents on Linux documentation.
- Gateway: The gateway files (ISO, OVA, Windows Gateway, Google Cloud image) downloaded from OpsRamp are provided with SHA-256 file checksum. This enhancement helps in identifying the integrity of the downloaded file.
Documentation enhancements
- New Document: Integration documentation is enhanced with new addition for Compute Integration. For more information, see Cisco Hyperflex Integration.
- Documents updated
- JIRA Integration: The existing document is updated to reflect enhancement of Inbound integration for JIRA. For more information, see JIRA Integration.
- Recommended Templates:
- Added templates for Tintri. For more information, see Recommended templates.
- Added two new template names to Linux Server.
Week of Nov 10, 2020
New feature
Event Management: Administrators can now configure event ingestion integrations to post events only if the resources are managed by OpsRamp. For resources that are not managed, the events are dropped and not processed.
Enhancements
- Process Automation: Administrators now can retry process instances that may have failed. This enhancement is useful for scenarios where the script running may have time-out issues, cannot run on the target resource, or is failing.
- Cloud Monitoring: OpsRamp now discovers and monitors Google Cloud Firebase. For more information, see Google Firebase.
- Reports: Network Statistics reports can now be processed using MBPS in addition to KBPS. This enhancement is useful for administrators who want a more granular view into their network usage and are more accustomed to MBPS.
Documentation enhancements
- OpsRamp IP Addresses are updated.
- A new Google Cloud service is added.
- New API: A new API is added that fetches supported cloud resource types (AWS, Azure, Google) with or without using smart filters during discovery.
- Updated APIs:
The following Integration APIs are updated with the new
dropAlertsOnUnmanagedResourcesparameter that discards alerts from unmanaged resources:- Install integration
- Install email integration
- Update installed integration
- Get installed integration
- Install custom integration
- Update custom integration
October 2020
We are excited to announce our Fall 2020 (v8) update!
This release is heavily focused on our Discovery and Monitoring solution. Our goal is to provide a streamlined monitoring experience for teams looking to gain visibility into Public Cloud and Kubernetes-based applications and workloads.
Discovery and monitoring
Advanced resource search
Advanced search for resources is enhanced to allow the creation of resource groups.
Creating resource groups (using the advanced search query) unlocks the power of the OpsRamp attribute model. When resource groups are saved, administrators can leverage resource groups in other areas of the platform such as device management policies, dashboards, and escalation policies.
Container orchestration and runtimes
Building off our support for Kubernetes and Docker workloads, support for container orchestrators and runtime is extended to:
- Container Orchestrators:
- Red Hat OpenShift Kubernetes Distribution (okd)
- K3s
- Container Runtimes:
- Containerd
This extended support ensures that teams deploying their containerized workloads (using various orchestrators and runtimes) have continuous visibility into the health and performance of their resources.
For more information, see:
Container-based application detection
With the focus on providing visibility into containerized workloads, OpsRamp is extending the capability of its native container monitoring to support the discovering and monitoring of containerized applications.
Providing visibility into the applications running in containers gives administrators the next level of insight into the services supporting their business applications. Over 25 applications are auto-detectable including Cassandra, MongoDB, MySQL, and Kafka.
Alerts streaming to external webhooks
Administrators can now consume alerts from their tenants using webhook listeners. This is intended for teams that have third-party alert correlation tools and do not want to leverage the native alert correlation functionality or do independent analysis of the alert data. You have the option to stream raw or de-duplicated alerts.
Public cloud improvements
AWS, Azure, and Google integrations are updated with new onboarding and monitoring information.
For more information, see:
Public cloud services AWS, Azure, and Google integrations are updated with supported services including their respective metrics.
For more information, see:
Public cloud resource support Cloud monitoring services are being extended to support several key services within AWS and Azure.
For AWS:
- AWS ECS
For Azure:
- Azure Functions
- Azure Hyperscale (PostgreSQL)
- Azure SQL Managed Instance
Python-based synthetics
Enhanced Python-based synthetics are available for synthetic transactions which include IF-THEN-ELSE statements.
For more information, see:
Event and incident management
Auto-suggest processes to run
The first response policy includes a new option to automatically learn, suggest, and run process definition workflows. The auto-suggest feature executes on defined alert criteria.
This auto-suggest feature helps you do troubleshooting, triage, and remediation tasks.
For more information, see:
Rule-based first response policy
Rule-based First Response policy allows you to configure the actions by alert pattern and attribute actions.
For more information, see:
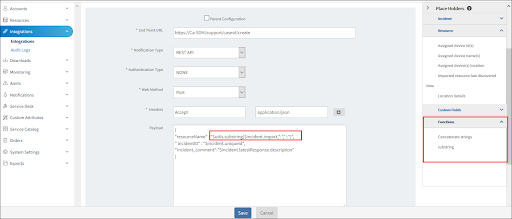
Outbound payloads automated functional operations
Outbound integration configurations support functional operators on the available token attributes. The following operators automatically extract the content needed for the payloads:
String concat()
String substring()
Date and time option
Your profile has a new option to set the date pattern and time format. You can set the time to be a 12h or 24h clock and the date can be in dd/mm/yyyy or mm/dd/yyyy format. The date pattern and time format applies across the platform.
Resource availability status on alert suppression
When creating clients, a new setting is available that allows you to ignore suppressed or incident alerts. Options for this setting includes all, suppress, or incident. With incident, alert actions on resolved and closed incidents are ignored.
For more information, see:
Remediation and automation
Process automation
The tasks of creating and managing process definition workflows are improved by increased capabilities.
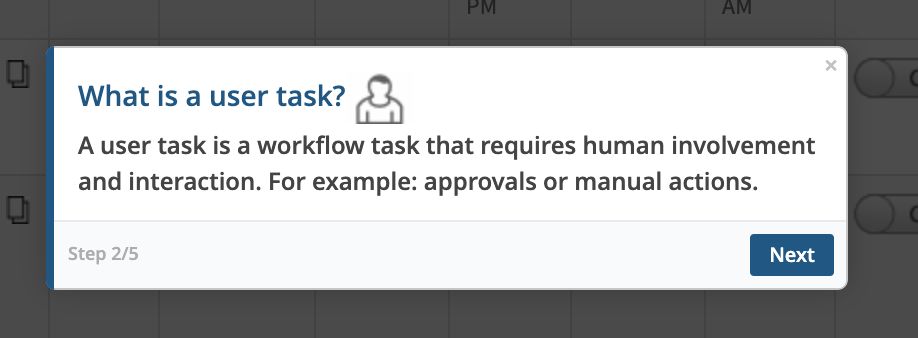
User task and task management Process automation developers and users can now include workflow tasks that require human involvement and interaction, such as approvals or manual action. User tasks are made available as Service Desk tasks and show up in the users My Unresolved ticket list. When the task is resolved, the process continues with the next task in the workflow sequence.
Workflow monitoring To improve troubleshooting, process automation developers and users can monitor defined workflows in the following ways:
- To see all versions of the process definition.
- To see all instances of each version.
- To find failed activities in the process definition diagram.
- To examine process variables, process user tasks, async service tasks, and script tasks.
Also, users can cancel active process instances, change process variable values, and retry failed process instances.
For more information, see:
Copying process definitions Process automation developers and users can now create copies of existing process definitions.
Process definition copies allow you to quickly:
- Create similar but unique workflows.
- Update workflows that require minor changes.
Find Resources platform service task A new platform service task gives process automation developers and users the ability to run queries that can find multiple resources. These resources can then be used within their ITOM workflows.
Multi-instance loops Certain ITOM workflows require processing of multiple resources instead of single ones for service, script, platform, and REST API tasks. You can now do parallel and sequential multi-instance loops of resources within a process definition to achieve the outcome.
Patch management
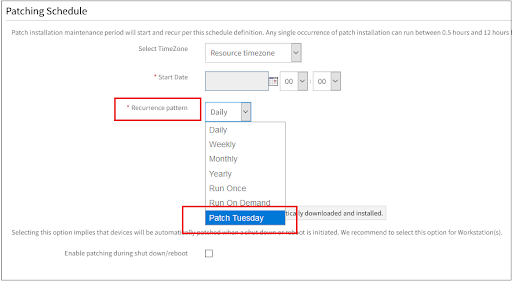
Configure patch installations to align with Patch Tuesday
Patch installations can now be scheduled to trigger within a time window from the Microsoft Patch Tuesday. Users no longer have to manually adjust the patch configuration to align with Patch Tuesday.
For more information, see:
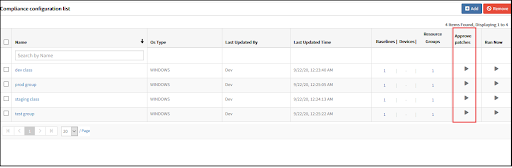
Approve patches from patch compliance configuration
You can now approve patches for installation from the baseline in patch compliance configuration. Also, you can track patch compliance and approve the same patches for installation in one shot.
For more information, see:
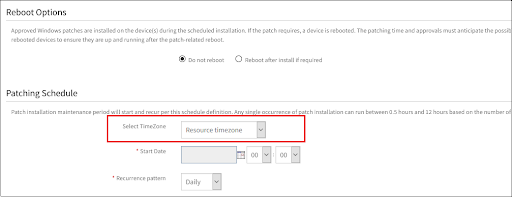
Time zone selection for patching
You can now select a specific time zone to patch all the resources in the patch configuration. Selecting the time zone ignores the different local time zones of resources and instead uses the specified time zone in the patch configuration.
Browser-based remote consoles
Browser-based remote consoles are available that run directly on web browsers and alongside Java consoles.
Browser-based consoles support the following capabilities:
- Console protocols: RDP, SSH, Telnet
- File transfer using SSH consoles
- Audit record and play.
For more information, see:
Java-based remote consoles are now deprecated and unavailable.

Reports
Reports asynchronous generation and scalability improvements
For NFS storage, a metadata cache is maintained for each report for a given time period. For example: previous month, previous week, previous day, and a specific period.
This change reduces report re-generation in case of failure or on-demand time by up to 90%.
UI enhancements
UI tours
The UI includes feature tours that educate you about new features. These tours take you through the steps of a process or highlight a feature with a short description.
APIs
Agent APIs
New agent APIs are available for retrieving and updating installed agent resources.
GET https://{api-url}/api/v2/tenants/{tenantId}/agents/{agentversion}/resourcesCountByAgentVersion
GET https://{api-url}/api/v2/tenants/{tenantId}/agents/{osName}/resourcesCountByOSName
GET https://{api-url}/api/v2/tenants/{tenantId}/agents/agentInstalled/resources/resourcesCountGroupByAgentVersion
GET https://{api-url}/api/v2/tenants/{tenantId}/agents/agentInstalled/resources/resourcesCountGroupByOSName
GET https://{api-url}/api/v2/tenants/{tenantId}/agents/{agentVersion}/resourceUUIDSByAgentVersion
GET https://{api-url}/api/v2/tenants/{tenantId}/agents/{OSName}/resourceUUIDSByOSName
GET https://{api-url}/api/v2/tenants/{tenantId}/agents/supportedAgentVersions
POST https://{api-url}/api/v2/tenants/{tenantId}/agents/resources/{ResourceUUID}/updateByResourceUUID
POST https://{api-url}/api/v2/tenants/{tenantId}/agents/resources/{agentversion}/updateResourcesByAgentVersion
POST https://{api-url}/api/v2/tenants/{tenantId}/agents/resources/updateResourcesByClientId
POST https://{api-url}/api/v2/tenants/{tenantId}/agents/resources/{osname}/updateResourcesByOSName
Custom branding APIs
New custom branding APIs are available for creating and updating custom client branding information. Custom branding information includes details such as header, header text, logo, favicon, login image, website title, and custom sub-domains.
https://{api-url}/api/v2/tenants/{tenantId}/customBrandingCredential sets APIs
New credential set APIs are available for creating and updating credential set information.
https://{api-url}/api/v2/tenants/{tenantId}/customBranding
https://{api-url}/api/v2/tenants/{tenantId}/credentialSets/{credentialSetId}
Alert API improvements
The alert correlation and first response APIs are enhanced to support more filter criteria.
https://{api-url}/api/v2/tenants/{tenantId}/policies/alertCorrelation
https://{api-url}/api/v2/tenants/{tenantId}/policies/alertCorrelation/{policyId}
https://{api-url}/api/v2/tenants/{tenantId}/policies/firstResponse
https://{api-url}/api/v2/tenants/{tenantId}/policies/firstResponse/{policyId}
https://{api-url}/api/v2/tenants/{tenantId}/escalations
https://{api-url}/api/v2/tenants/{tenantId}/escalations/{id}
Resource API improvements
The GET and UPDATE Resource API is enhanced to be consistent across all public clouds.
The API now provides:
- Provider details for all public cloud resources (AWS, Azure, and Google Cloud).
- User ability to update resource descriptions.
https://{api-url}/api/v2/tenants/{tenantId}/resources
https://{api-url}/api/v2/tenants/{tenantId}/resources/{resourceId}
Resource API CollectorType renamed
The collectorType for templates assigned on Synthetic resources monitoring
is renamed to Synthetics from Webservice.
https://{api-url}/api/v2/tenants/client_193/resources/{resource_uuid}/templates?collectorType=SyntheticsIntegration API improvements for public cloud
The install integrations API is enhanced to provide discovery information of public clouds. The API provides users the ability to install K3S integrations.
https://{api-url}/api/v2/tenants/{tenantId}/integrations/install/{integrationId}Week of September 15, 2020
Issues fixed
- Fixed an issue that prevented users from viewing all clients while adding resources to alert escalation policy. Earlier only up to 100 clients were displayed.
- Fixed an issue that prevented the processing of column data from the Model Training file while creating First Response and Alert Escalation policies.
Week of September 8, 2020
Enhancements
- Reverse Alerting Condition: Enhanced the Change Detection Monitor type to consider non-zero integers in the alert processing. This enhancement allows teams to treat the change detection monitor as a reverse dead man switch to generate an alert when a resource that is supposed to stay down turns Up and starts reporting data.
- API response for process monitoring: The search template API is enhanced to display details about the process monitors that are applied to a resource.
- Storage Volume Update: Storage Volumes are enhanced to present the parent storage array as an attribute. This enhancement allows:
- Improved querying of a storage volume to display the parent storage array as an attribute.
- Easier discovery of the parent resource after accessing the component from the Alert page.
Issues fixed
- Fixed an issue related to the reported response time for public synthetic monitoring locations. The response time is optimized for the type of synthetic monitors that are being run and are now aligned more closely with the end user experience.
- Fixed an issue that prevented setting a range of recurrence for a specific day when creating a Scheduled Maintenance Period.
- Fixed an issue related to the use of Ansible scripts in conjunction with the process workflow. The process workflow API is enhanced to handle null API parameters.
- Fixed an issue that prevented the display of the native attribute Alert Subject in the console when using the API to create a First Response policy.
Documentation updates
- Freshservice Integration: Updated status and priorities details for the Mapping attribute section.
- Installing Gateway as a Virtual Machine: Added new document for installation of gateway as a virtual machine using ISO image on VMware ESXi.
Week of August 25, 2020
Enhancement
Alerts report: The Alerts report is enhanced to support Cloud Provider > Resource Type Filter. This enhancement makes it easier to access alerts generated from Cloud Providers monitored by OpsRamp.
Issues fixed
- Fixed an issue that caused gaps in monitoring graphs when multiple G2 templates were updated/removed in a single payload.
- Fixed an issue that prevented the display of the architecture attribute for Linux agent-based resources.
Week of August 18, 2020
Enhancement
- Service Desk Widget: The Service Desk widget is enhanced with the Service Desk View option. This option helps to easily track and follow issues based on metrics, such as Clients, Group, Priority, and Status.
- SSO Login: Enhanced SSO login for users under Azure AD. Authentication is supported without using a password.
- Improved Integration Events for ServiceNow: Sites are enhanced to consistently send Integration events when resources are managed within OpsRamp and ServiceNow. As a result, actions like delete or update performed in OpsRamp are reflected more accurately in ServiceNow.
- Patch Management: The Patch Approval page is enhanced to show Severity of the patch to let administrators have a high-level view of the patches to be approved (or unapproved).
Issue fixed
Fixed inconsistency within the Repeat Count section in Templates. The Repeat Count scroll now increments to a single integer after 10. This resolution helps to consistently set the Repeat Count to 1 after scrolling past 10.
Documentation update
Prometheus Integration: The existing topic now also includes how to configure Prometheus to send all alerts to OpsRamp.
Week of August 11, 2020
Enhancement
Monitoring Integration update: The Cradlepoint monitoring integration is enhanced to display an error when invalid credentials are provided.
Issue fixed
Fixed an issue related to the Distribution by Metric widget in Dashboard. Before this release, adding multiple types of widget caused inconsistent performance of the widget and also prevented further addition of any widget to the dashboard. Now, the widget performance remains consistent and follows the expected behavior even after adding the Distribution by Metric widget.
Documentation update
A new topic is added to explain the Ansible integration that is required to create playbooks for process workflows.
Week of August 4, 2020
Enhancements
- Syslog Monitoring: The number of rules allowed in a configuration profile is increased from 100 to 200.
- Public Cloud Monitoring: OpsRamp public cloud monitoring is enhanced to follow the AWS best practices. OpsRamp calculates AWS Lambda metrics using Sum as the statistical aggregator, instead of Average.
- API Enhancement: The Search Resource API provides a consistent experience when using the attributes, AliasName, HostName, and Name. When those attributes are used as the search query, the API searches for the respective attributes on the resource.
- Cradlepoint Monitoring Integration: OpsRamp AWS, Google Cloud Platform, and Microsoft Azure integrations are enhanced to validate credentials that are not valid or include spaces. This improves visibility of validation-related errors.
Issue fixed
Resolved an issue that caused changes in the client-level template when a related partner or service provider-level template was modified. This improves consistency with the metrics usage and platform behavior.
Week of July 28, 2020
Enhancement
Alert Correlation: A new condition, Alert Component is added to the Alerts Similarity field on Create Alert Correlation Policy.
Security Updates
This release includes the following security updates:
- Adding the Syslog rules now requires the permission to manage monitor.
- Viewing the password details after copying the password URL from Setup > Downloads > Agent now requires the device view permission.
- Executable scripts are displayed as plain text when used as a search string at Setup > Resources > Device Management Policies.
Issue Fixed
Fixed an issue that prevented the proper functioning of the Timer Start event in Process workflow.
Week of July 21, 2020
Agent
Enhanced support for scripts is provided to manage agent configuration.
The OpsRamp automation library includes scripts to reconfigure agents to connect to OpsRamp directly or to connect using a proxy. Scripts for Windows and Linux are available at Automation > Scripts > OpsRamp Agent from the OpsRamp Console.
Gateway
APIs for the gateway:
APIs to download gateway images: Download gateway images securely using APIs.
APIs to manage gateway configuration: Manage settings on your gateway appliance through an API. This new API helps to manage settings such as host details, network, proxy, NTP, and static routes.
Alert
The Alert correlation training file is enhanced to use the wild card character * (asterisk) to group alerts when the exact metric name is not known. If multiple metrics start with the same name, using an asterisk with the name of alert in the training file helps to correlate all alerts.
For example, with metrics named vmware.vcenter.x1 and vmware.vcenter.x2, use vmware.vcenter.* to correlate all alerts starting with vmware.vcenter.
Integration
Webhook-based integration is added for:
- Zendesk (See Zendesk Integration for more information.)
- Freshservice (See Freshservice Integration for more information.)
Issues Fixed
- Fixed an issue that prevented an update of the alert escalation policy without modifying the training file.
- Fixed an issue that prevented the display of existing scheduled reports in the reports UI.
- Fixed an issue that caused an inaccurate representation of the From Date filter in the alert views.
- Fixed an issue that prevented the display of the change detection graph on Dashboard.
- Fixed an issue that caused the Browser console to check the gateway version when launching an agent console. Now, only the agent version is checked for the agent console and only the gateway version is checked for the gateway console.
- Fixed an issue that prevented the deletion of some of the AWS sub-devices.
- Fixed an issue that prevented the display of certain columns in the correlation policy alert list view. These columns are similar to those in the alert browser.
- Fixed an issue that prevented the display of scope for Syslog rules.
Week of July 14, 2020
Alert
Incident details now include information about inference and correlated alerts.
Monitoring
Template-based monitoring
Template-based monitoring is enhanced to support filtering at the component-level including:
- Filtering components for monitoring purposes.
- Setting up differential thresholds based on the component type.
Note
Both agents and gateways support component-level filtering and thresholds.See Using Templates, Component filters and component level-thresholds for prerequisites and more information.
Agent-based G2 custom monitoring
Agent-based monitoring supports the creation of new G2-based templates including the following application types:
- Application type: Script Executor (also called: Remote Script Executor)
- Supported programming languages: Shell, Powershell and Python
- Supported operating systems; Windows and Linux
The new RSE type monitor:
- Allows the collection of multiple metrics with a single script invocation at the monitoring-level.
- Brings parity between agents and gateways in defining new custom monitors and templates.
See Setting up Agent-based G2 Custom Monitors for more information.
Agent-based process monitoring templates
New monitoring templates are introduced to monitor various system and application-level processes present in Windows and Linux resources. These templates support monitoring of various processes with different thresholds.
See Agent-based Templates for more information.
Note
SQL-managed instances are a new resource in Azure.Automatic deployment of agents on Amazon WorkSpaces
Linux agents are automatically deployed on auto-provisioned Amazon WorkSpaces instances. Automatic deployment allows instances to be onboarded as soon as they are live.
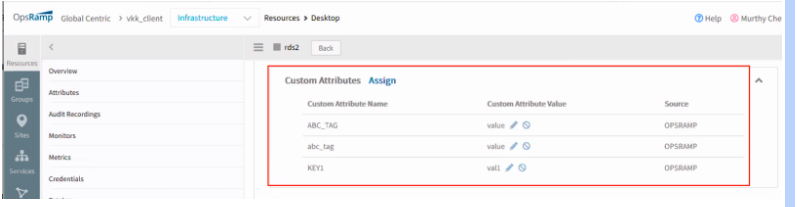
Custom attributes
The Custom Attribute option is included in the Resource list page.
Reports
- The Alert Export details is enhanced to include the Resource Unique ID.
- The Custom Inventory report is enhanced to display Web Synthetic as a Type attribute. The generated report, now displays the type of Synthetics resource if Web Synthetic is selected as the resource type. See Creating Custom Reports, Creating inventory reports for more information.
- The Standard Inventory report is enhanced to include the version and model of the gateway.
Schedule maintenance
Schedule details is enhanced to allow maintenance duration of 24 hours.
Documentation enhancements
- Remote Console: A Remote Console FAQs topic is now available.
- Report: A list of permission sets that are applicable to all standard reports is now available. See Reports Overview, Types of standard reports and permissions for more information.
- API enhancements:
- Update custom integration includes JWT authentication.
- Create or update installed integration base notifier includes JWT authentication.
June 2020
We are excited to announce our Summer 2020 update! Our focus for this release is for end users to find and manage resources. For administrators, we have provided visibility into the algorithms status and extended the depth of our hybrid monitoring.
Here are the highlights:
- Improved synthetics with breakdown of transaction latency and HTTP header logs.
- Expanded support for Amazon AWS, covering twenty-two new services.
- New Advanced search on the managed resources.
- New process automation framework that includes integration with Ansible.
- Browser based console to simplify logging into devices.
- Visibility into how the underlying algorithms work and their operational status.
Discovery and monitoring
Improved synthetics
For more information:
- See SCRIPT – HTTP Synthetic Transaction Web Service Monitor for more information.
- See SCRIPT Transaction Steps for more information.
Latency breakdown by step
Synthetics now include a breakdown of transaction latency by each step in the transaction. Administrators can now get insight into synthetic transaction performance and easily identify steps that contribute to latency.
This identifies and resolves issues much faster.
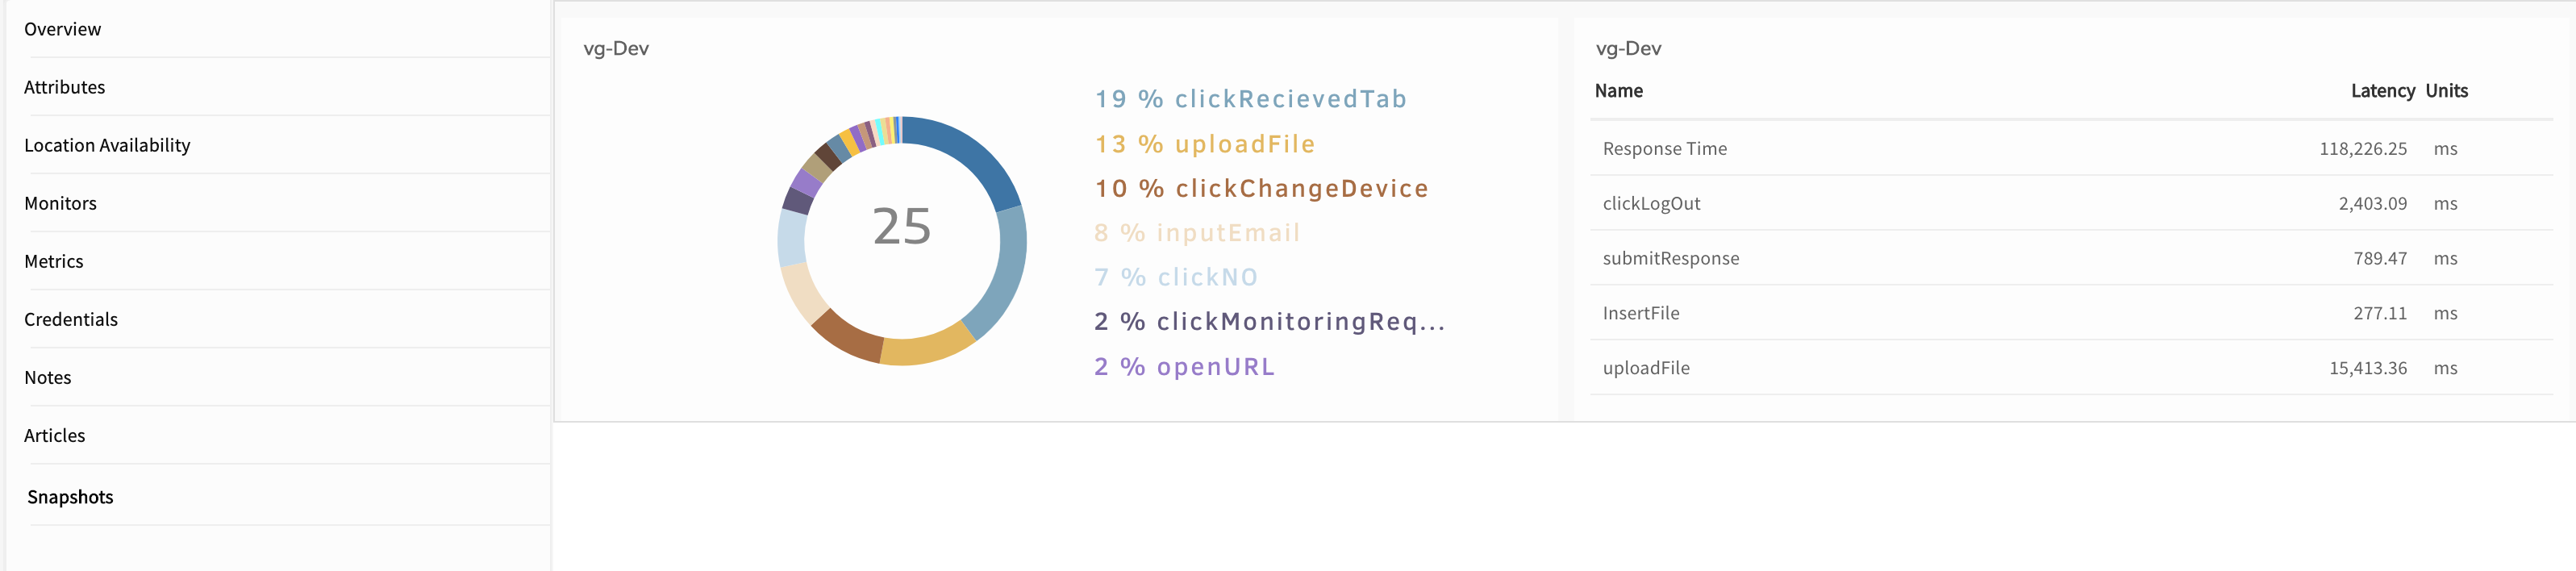
Granular Transaction Latency Steps
Customizable transaction steps
The name of each step in a recorded transaction can be customized. Administrators can name transaction steps to denote logical steps that a real user would take in interacting with a website. This helps administrators to easily relate transaction performance to user experience.
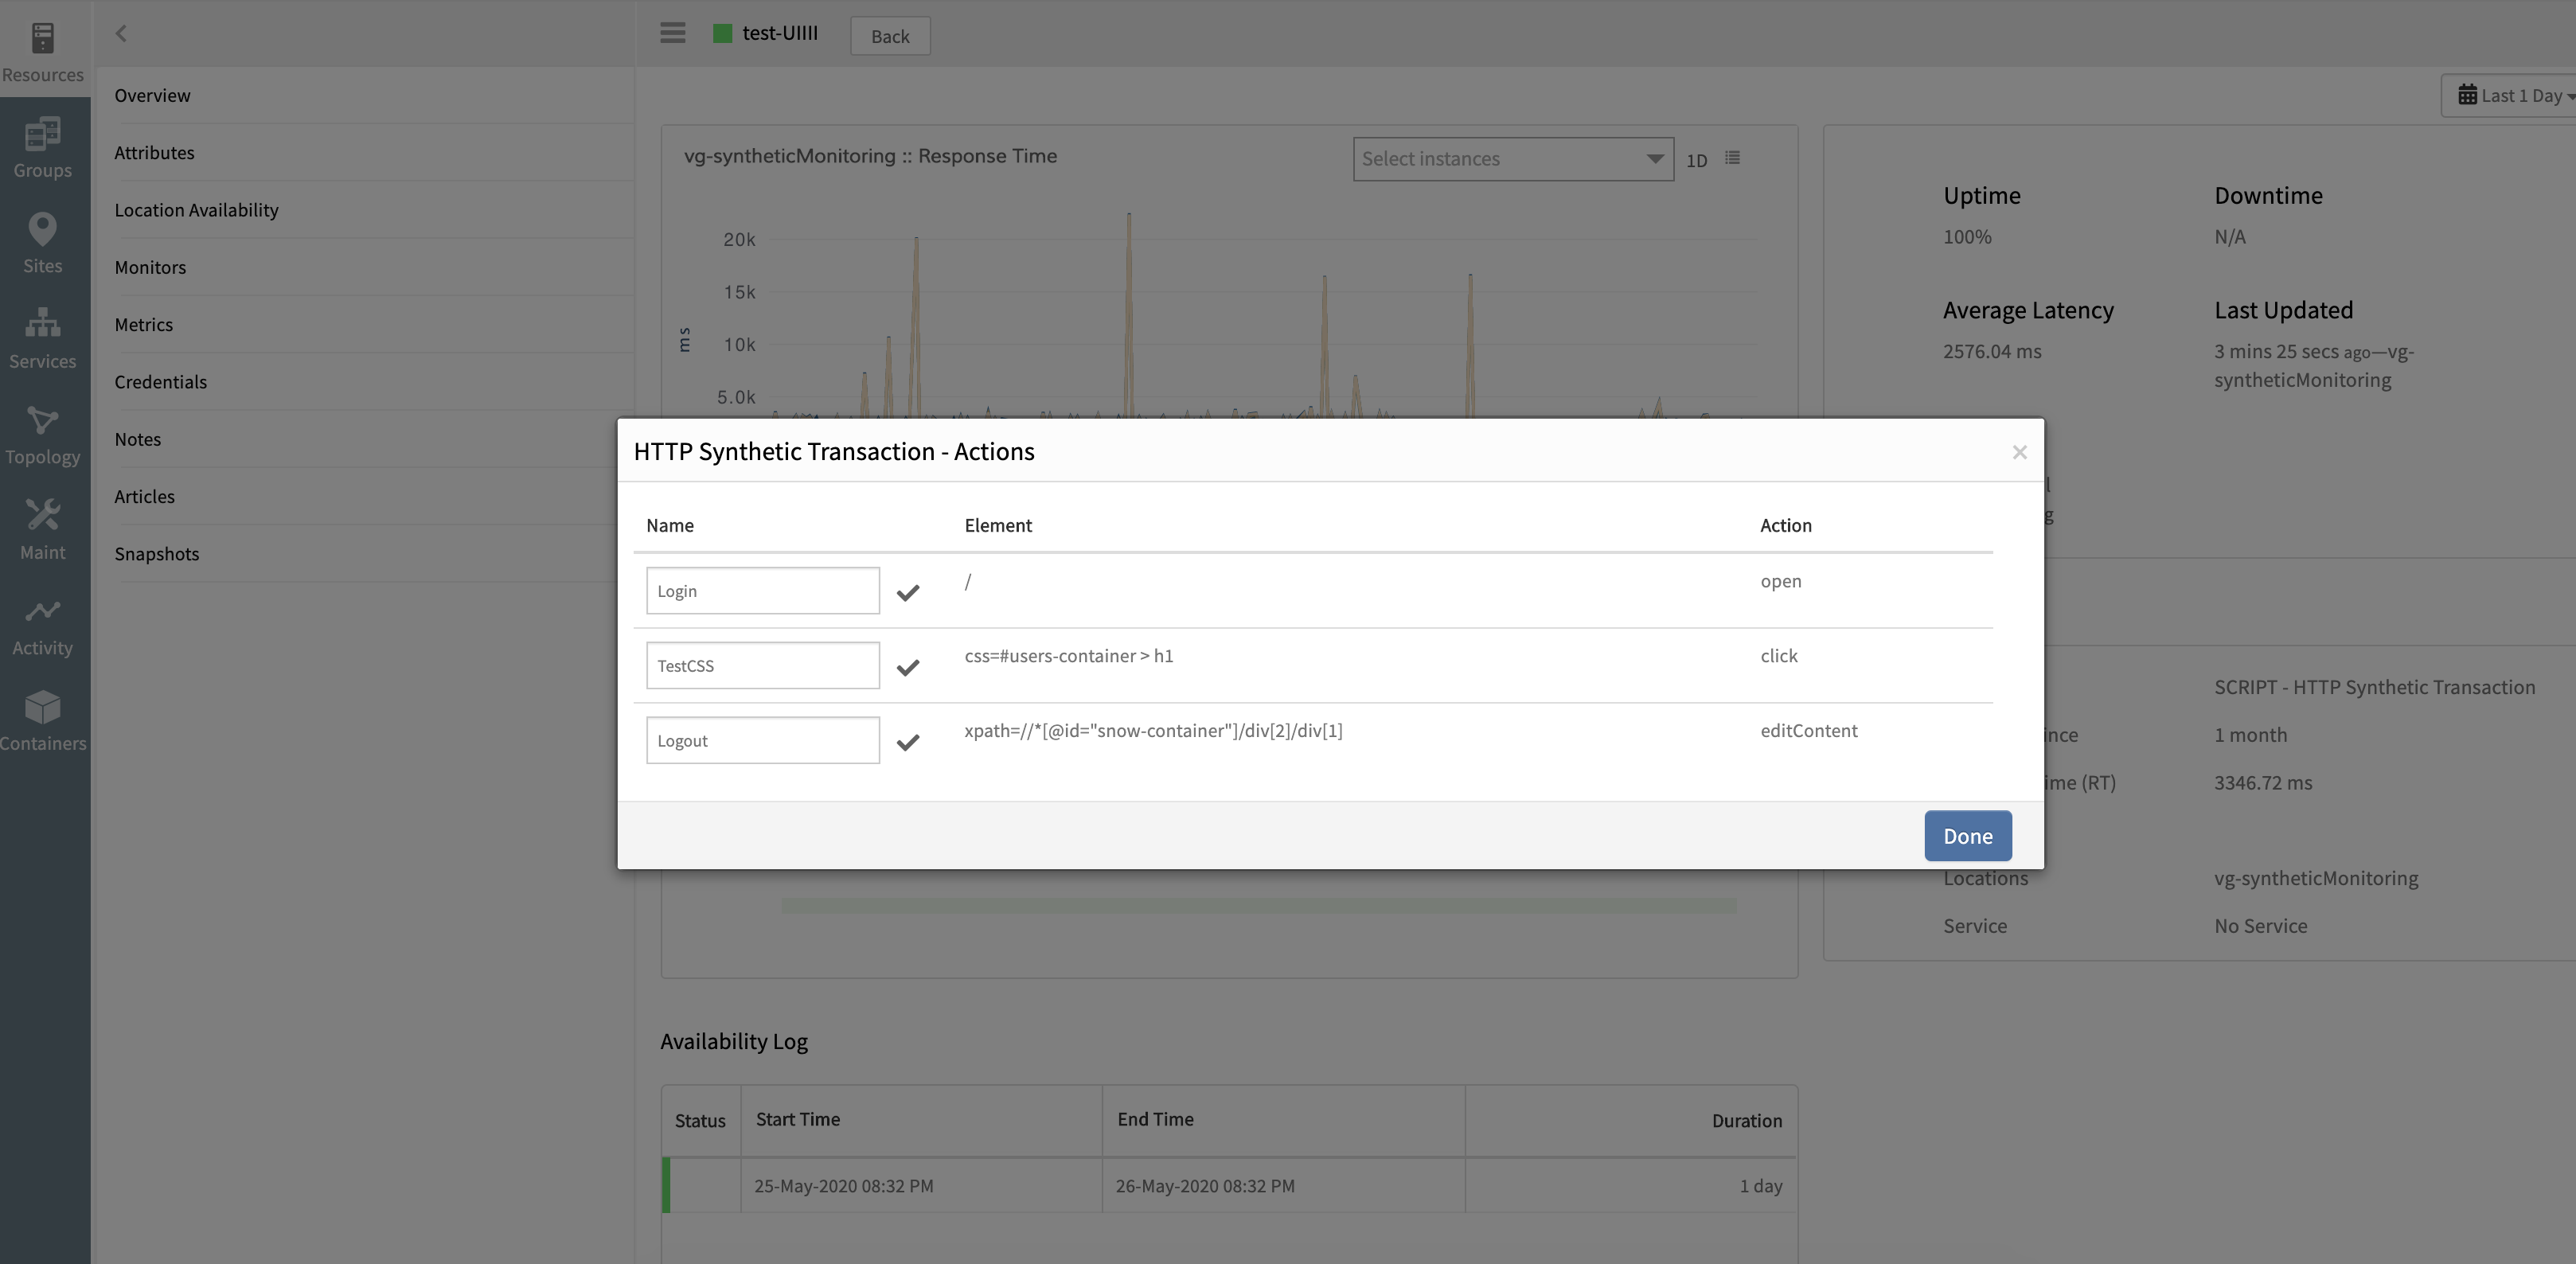
HTTP Synthetic Transaction - Actions
HTTP response header logs
Synthetics automatically capture HTTP response header information on failed transactions. This quickly identifies the root cause of failures.
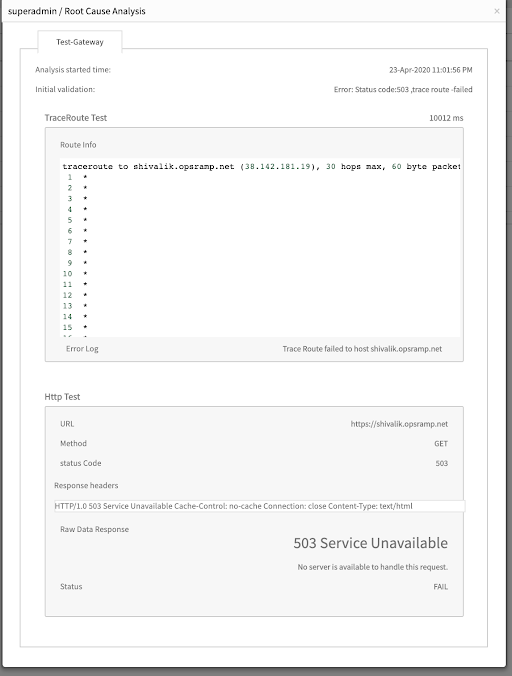
Root Cause Analysis
Credentials store support
Credentials in the OpsRamp credentials store can be used within script-based synthetics. This protects against the risk of accidental exposure of website passwords through transaction recordings.
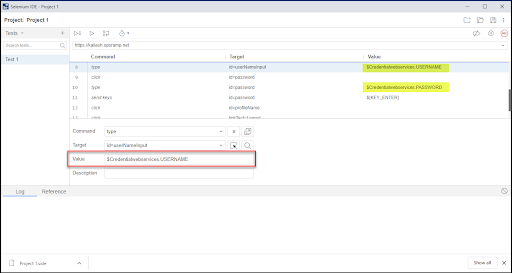
Credentials
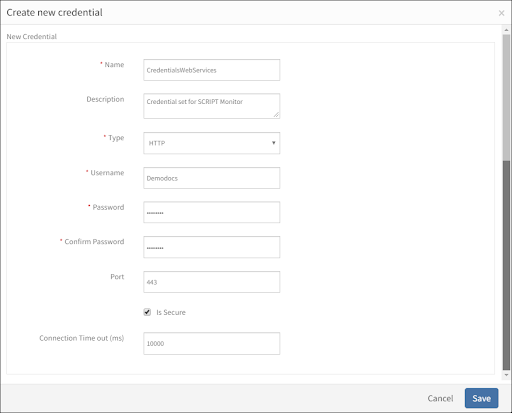
Create New Credential
Cloud monitoring
AWS services
OpsRamp can discover and monitor more AWS services. Also, existing monitors for all AWS services are updated to collect newly published metrics.
See the Support Matrix for more information.
| Services | More Services |
|---|---|
|
|
Canonical metric names
OpsRamp monitors for AWS and Google Cloud Platform services present metrics in a new canonical naming convention. This makes it easy to interpret metrics and configure dashboard widgets.
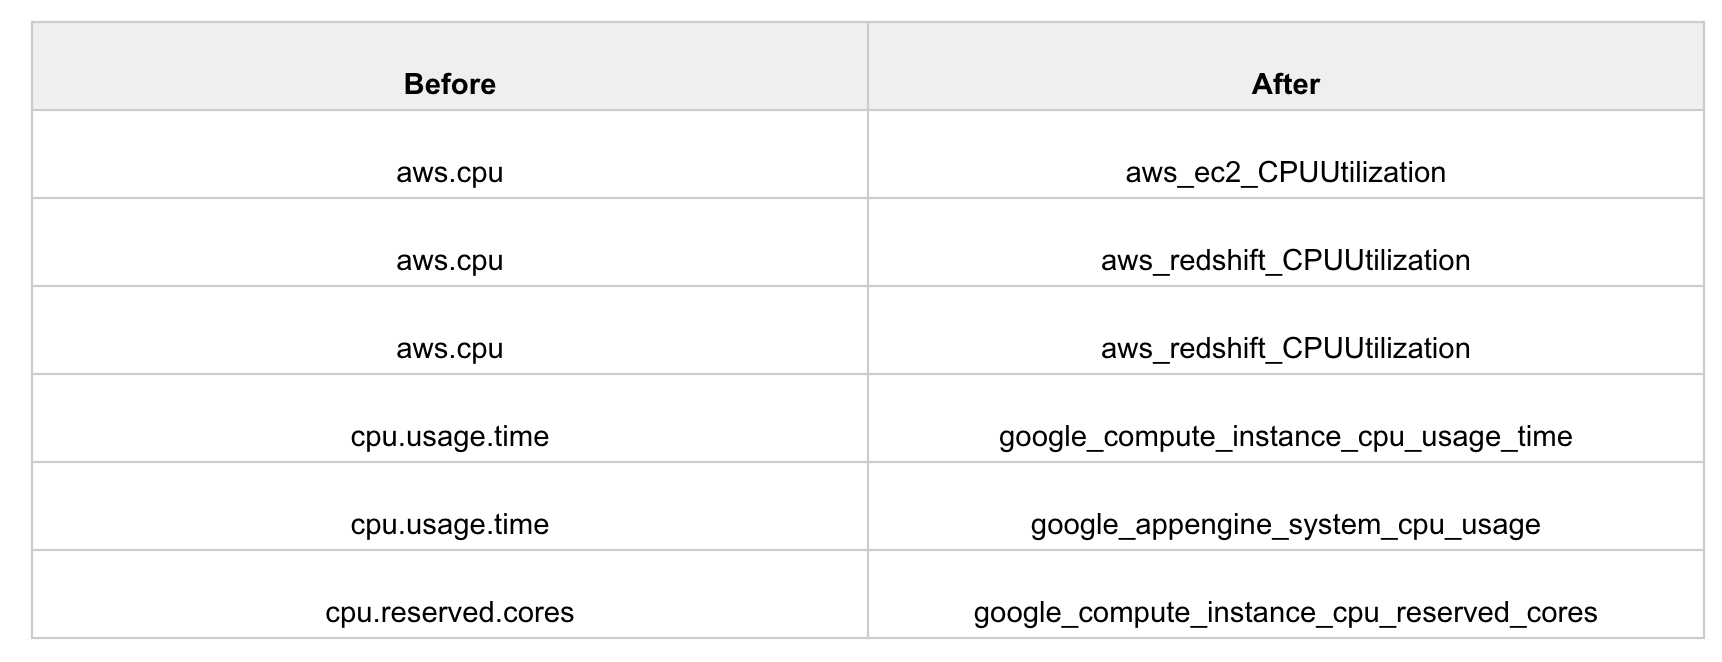
Metric Notation Change
Advanced resource search
Advanced search is available on the managed resources. This includes:
- Composition search criteria using AND and OR.
- Search by native attributes.
- Search by custom attributes.
- Listing page for search results.
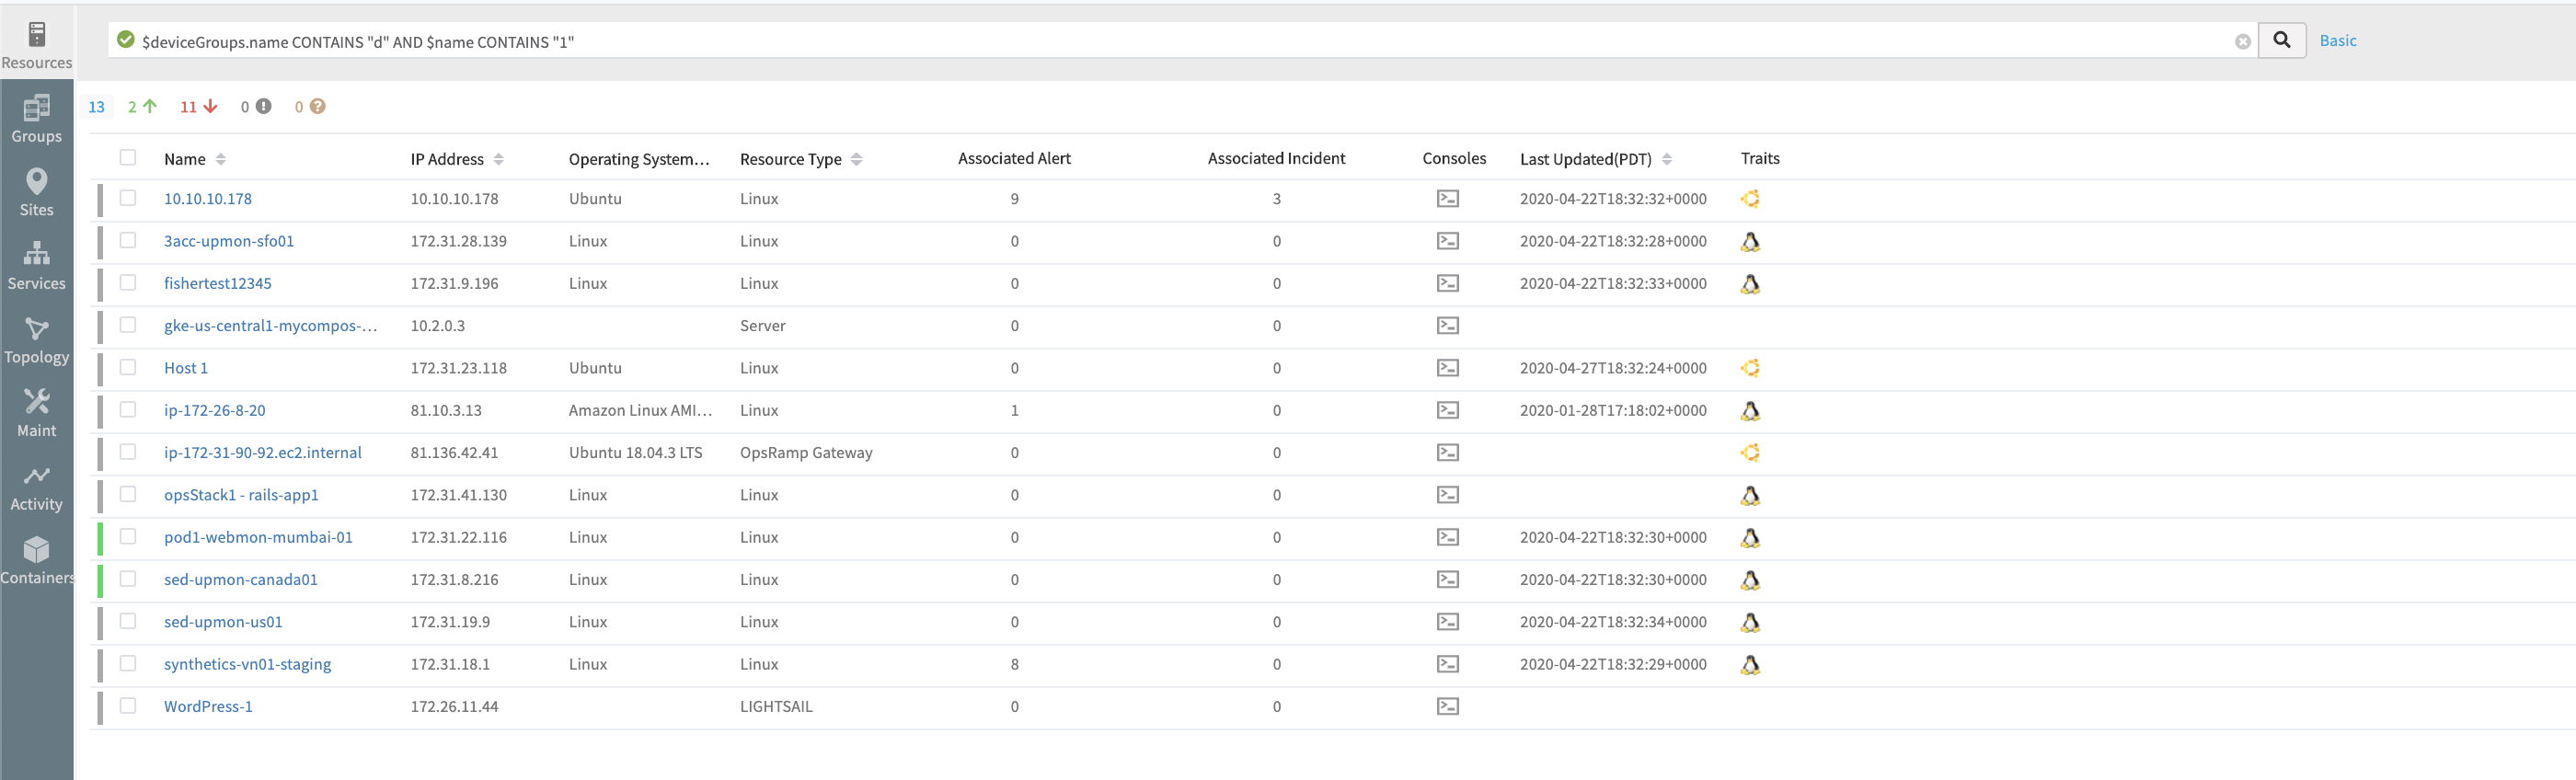
Advanced Search Example 1
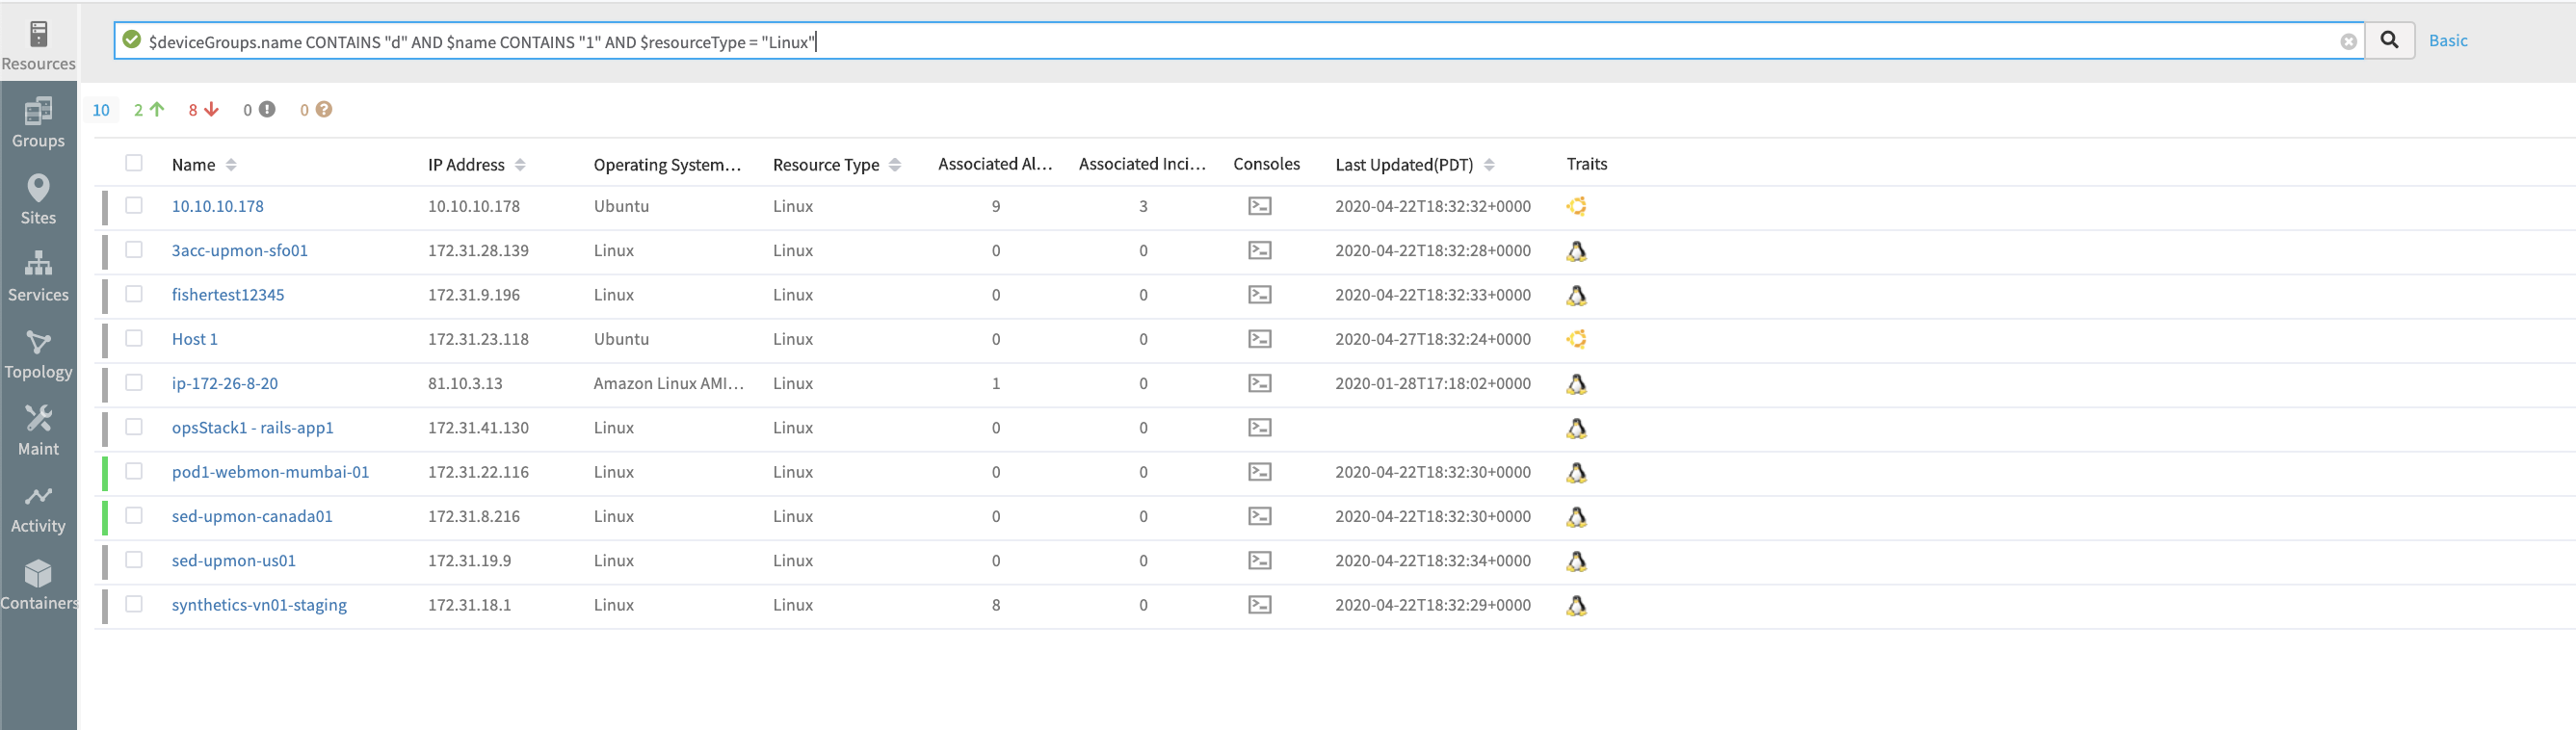
Advanced Search Example 2
Improved navigation between topology and service maps
Improved pivoting between service maps and topology maps includes:
- Adding topology maps nodes from within a service map.
- Switching to a topology map from a service map.
Improved agentless custom monitors
Agentless (gateway-based) custom monitors can use custom attributes and resource credentials from the OpsRamp credentials store.
Generic agentless custom monitors can be written that automatically collect the right metrics, based on custom attributes assigned to a resource. Also, credentials no longer need to embedded within custom monitors.
See Setting up Agentless Monitors for more information.
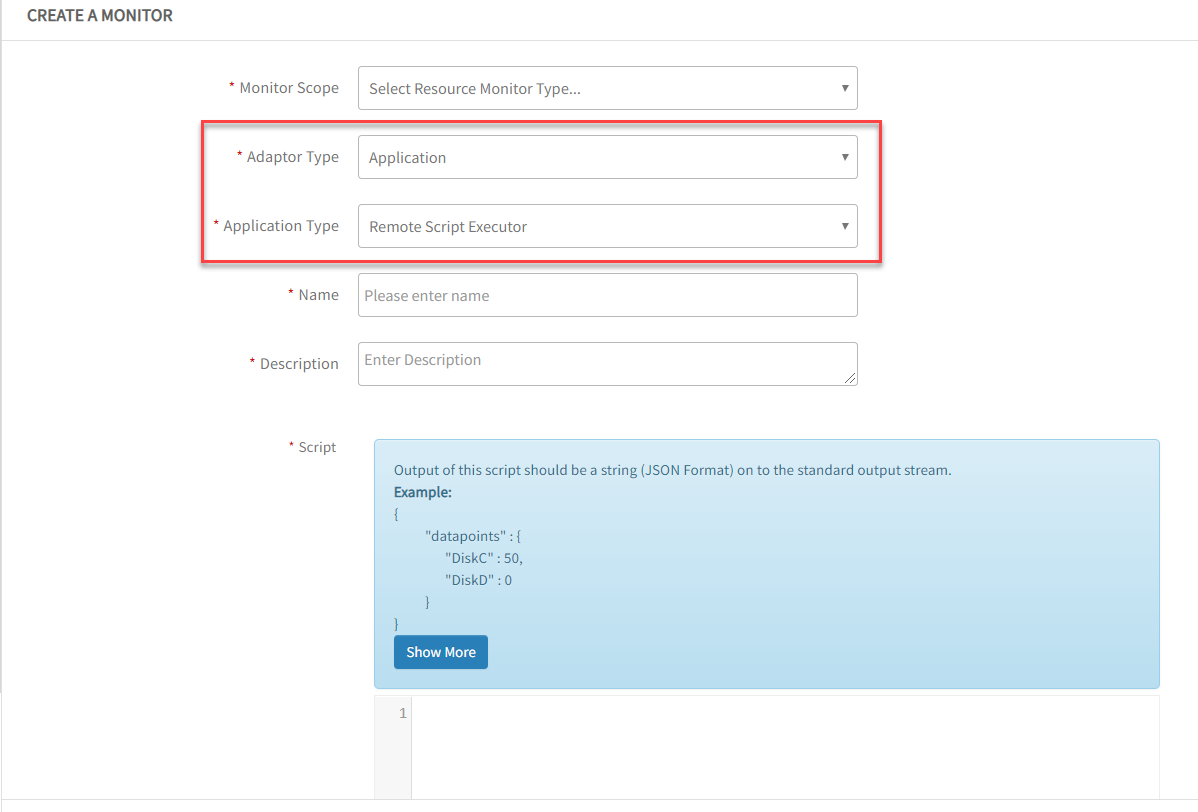
Create a Monitor
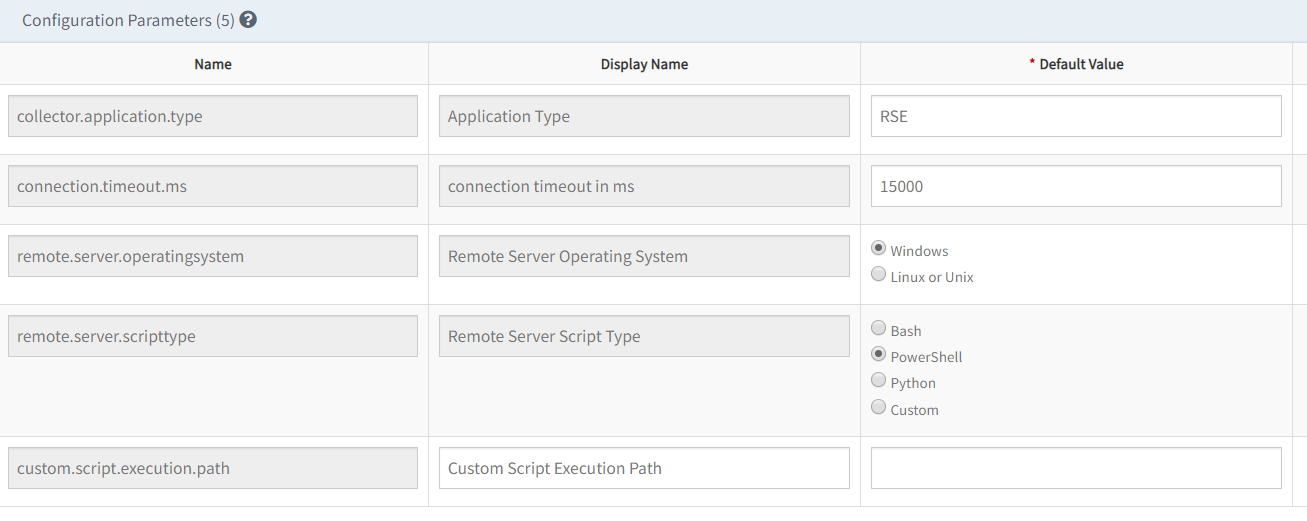
Monitor Configuration Parameters
Improved ServiceNow CMDB integration
Filter out resource group and custom attribute changes as triggers for CI updates in ServiceNow. This helps optimize CI updates in ServiceNow.
See ServiceNow for more information.
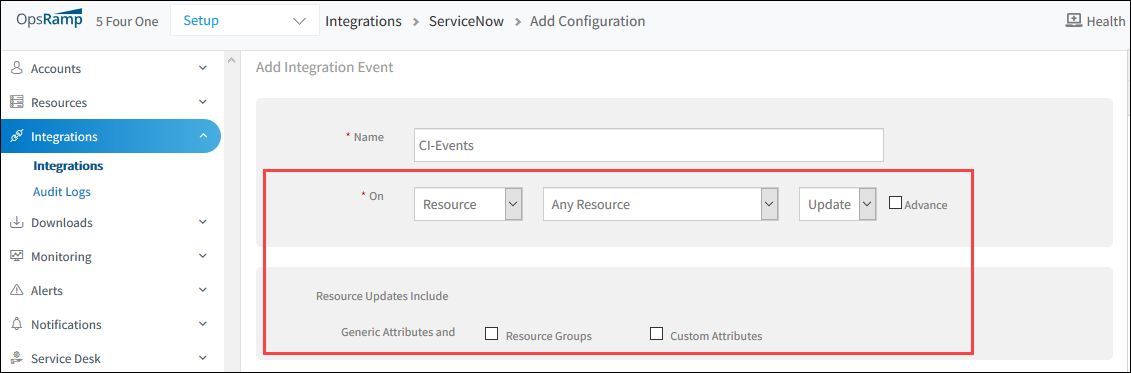
CI Attributes on Update Event
Agents and gateways
Agent manageability improvements
Configurable agent logs
The size of agent logs and the number of log files to retain is configurable. This is helpful in troubleshooting intermittent agent connectivity issues.
See Agent Log Reference for more information.
Links to gateway appliance images for cloud
The Downloads page now includes links to gateway images for AWS, Azure, and Google Cloud Platform.
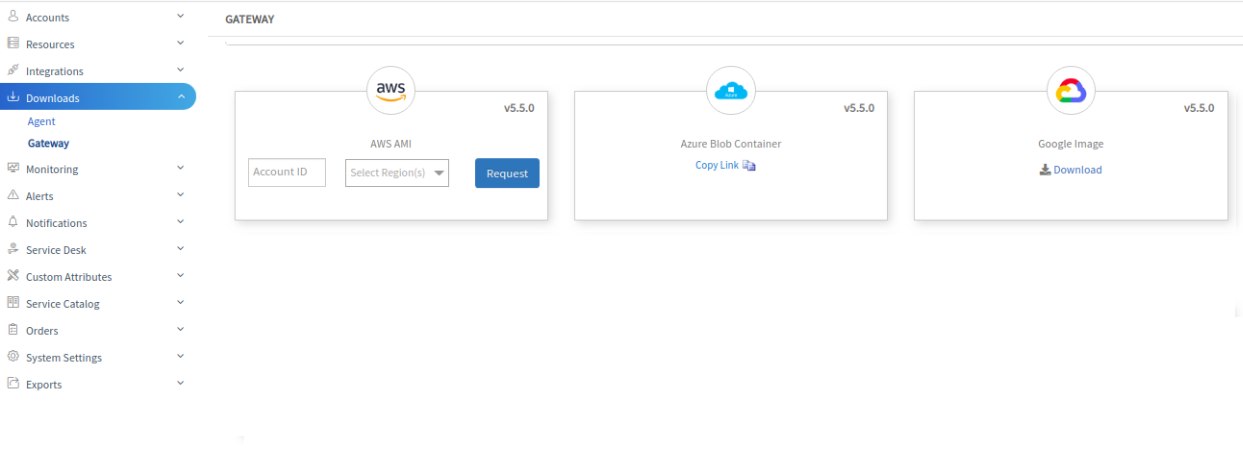
Gateway Cloud Downloads
Security controls on gateway appliance
Simplified gateway appliance accounts
To further improve the security of the gateway appliance, starting with firmware version 7.0.0, an administrator user account and a system user account are available for the gateway appliance. Before this release, there were three user accounts with different privilege levels.
See Managing Login Accounts for more information.
Key-based authentication for gateway appliance account
Key-based authentication can be used for the gateway system user account. By default, the appliance system account is configured with password-based authentication but the account can be changed to use key-based authentication. This feature increases security and follows industry standard practices.
See Managing Login Accounts for more information.
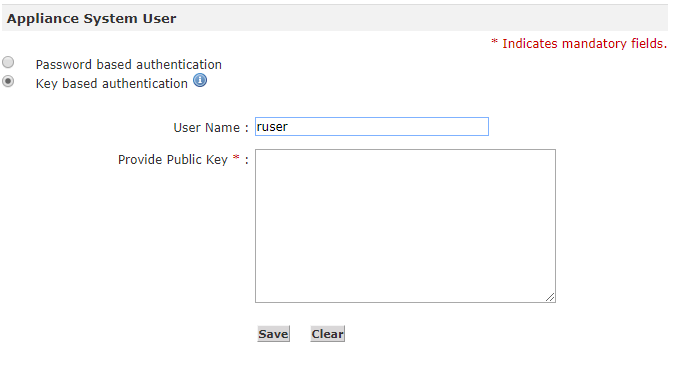
Key-based Login
Custom SSL certificates for gateway appliance
The gateway administration web interface can be secured with an organization issued SSL certificate. Before this release, the gateway only supported an OpsRamp signed certificate.
See Using SSL Certificates for more information.
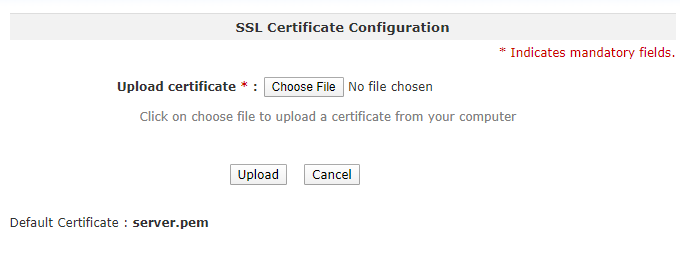
SSL Certificate Configuration
Proxy controls in gateway appliance
The built-in proxy in the gateway appliance can be configured to do the following:
- Enable authenticated access
- Restrict outbound URLs
With these controls, the built-in proxy is used only to access OpsRamp.
See Managing Proxy Settings for more information.
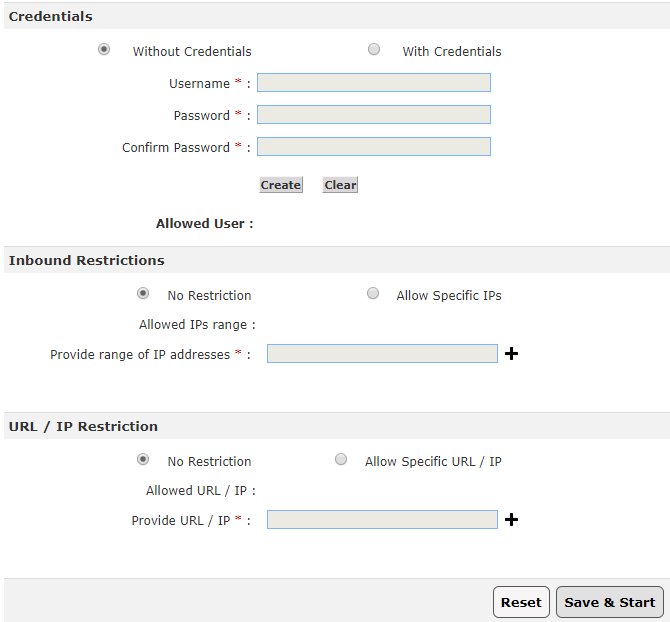
Proxy Configuration
Event and incident management
Ingest events from syslog
OpsRamp supports ingesting events sent in the RFC-5424 - Syslog Protocol.
Syslog-enabled devices can send syslog events to the OpsRamp gateway. Rules can be defined to parse syslog events and trigger alerts in OpsRamp. Syslog parsing and alert rules can be defined and managed centrally from the OpsRamp UI.
See the Administrator Guide Logging section for more information.
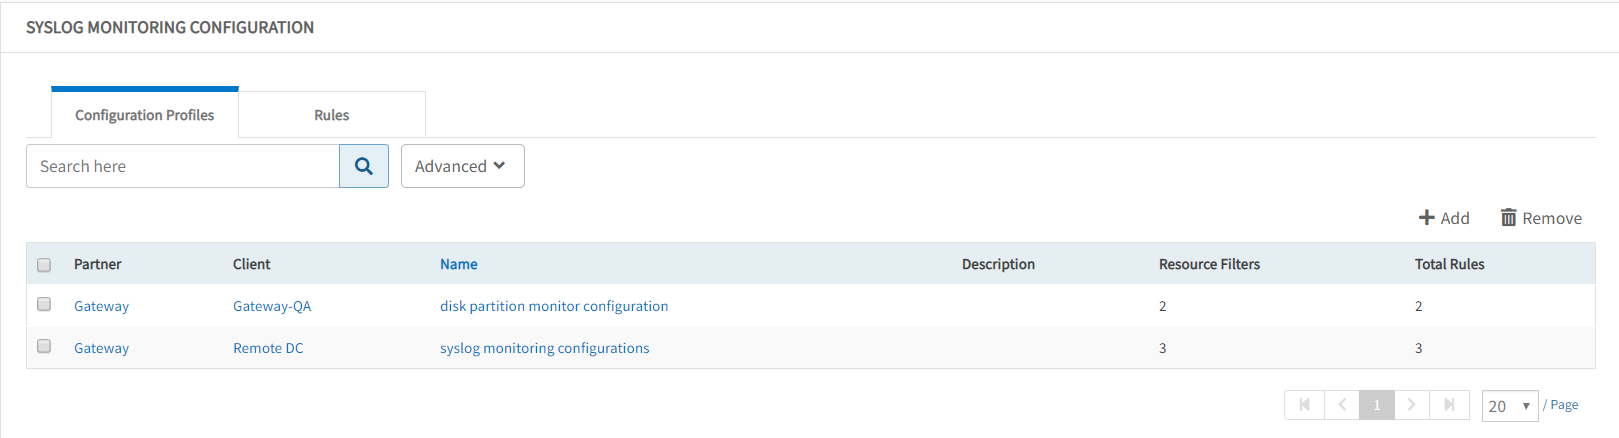
Syslog Configuration
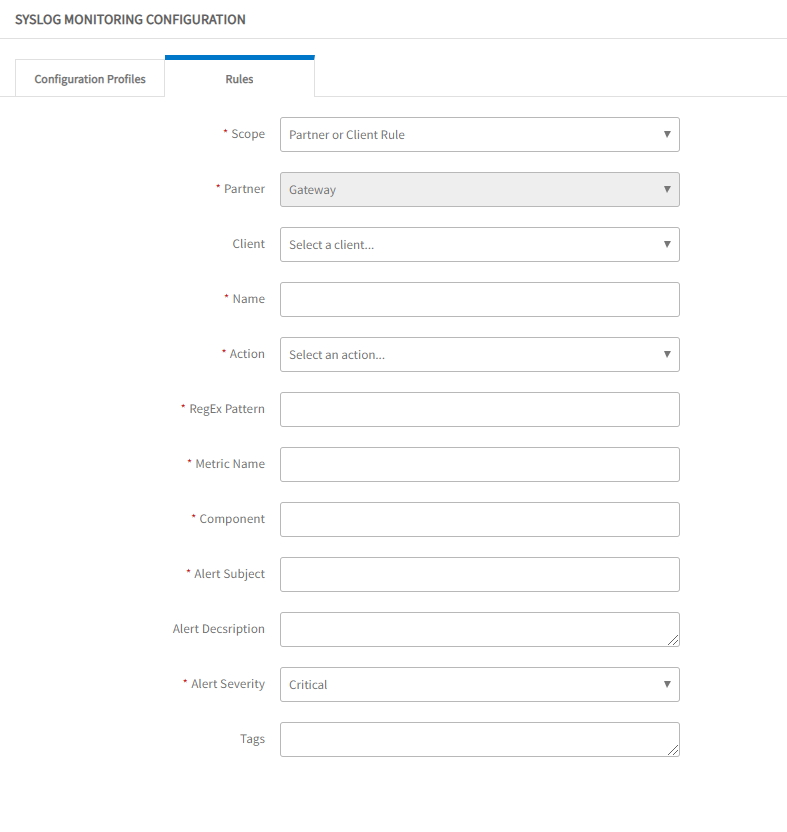
Syslog Rule Definition
Create incident from alert browser
Incidents can be created from a generated alert. After an incident is created, the status of the alert changes to ticketed and the incident ID is displayed in the ID column.
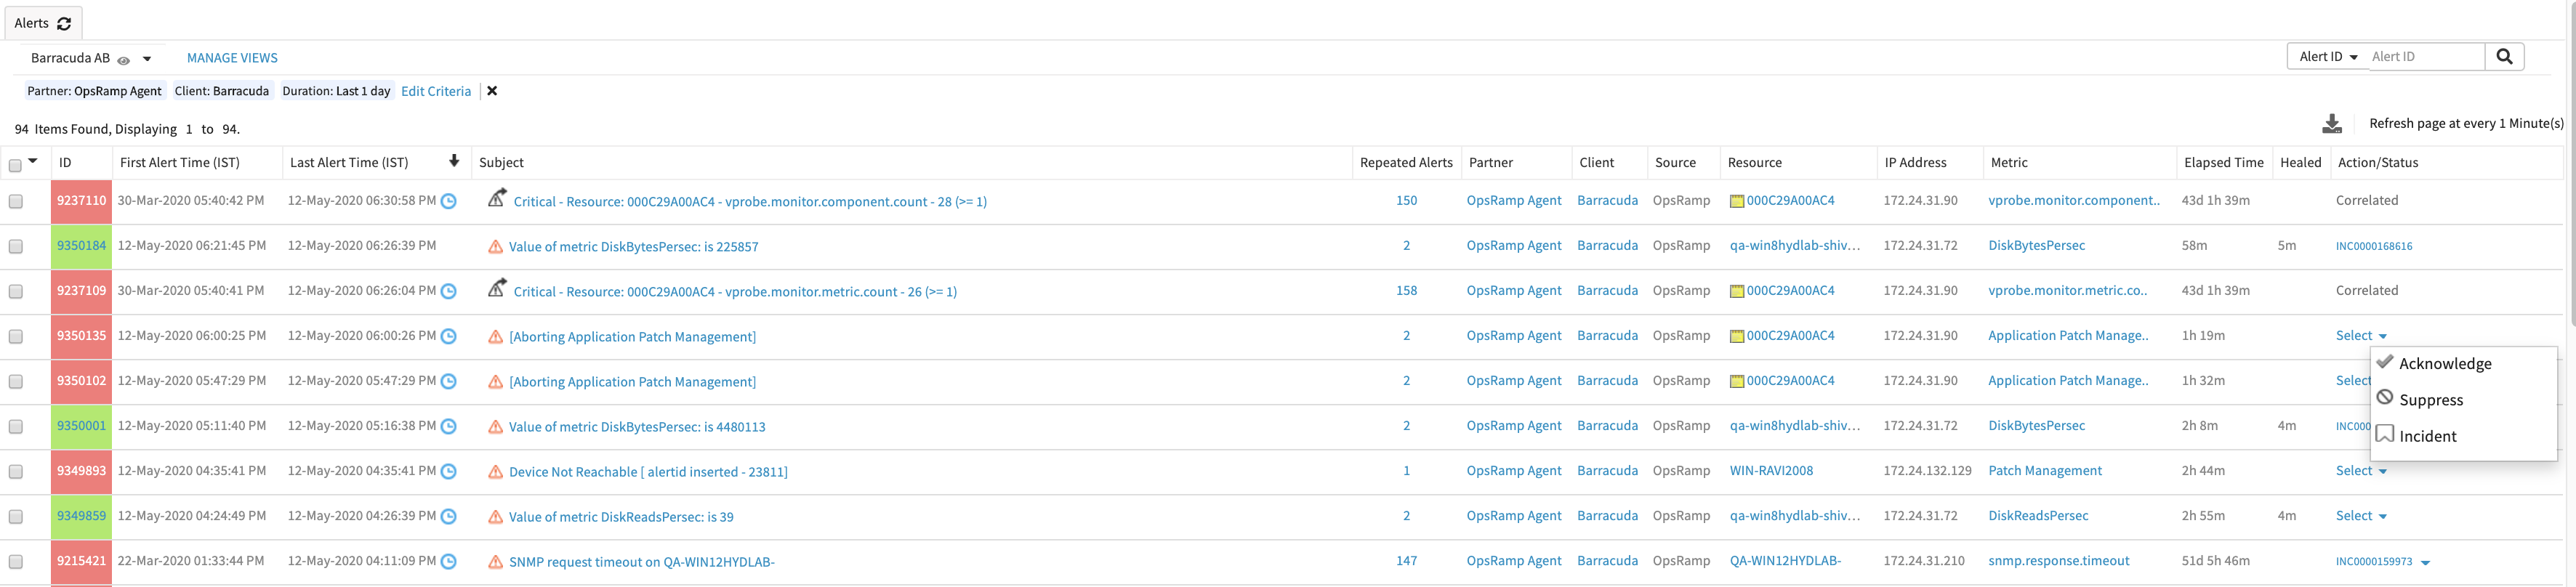
Create Incident from Alert Browser
Alert sequencing explainer
When configuring a new alert correlation policy, a link is provided that is labeled: How does it work?.
The link gives users an overview of how OpsRamp alert sequencing works to automatically correlate alerts.
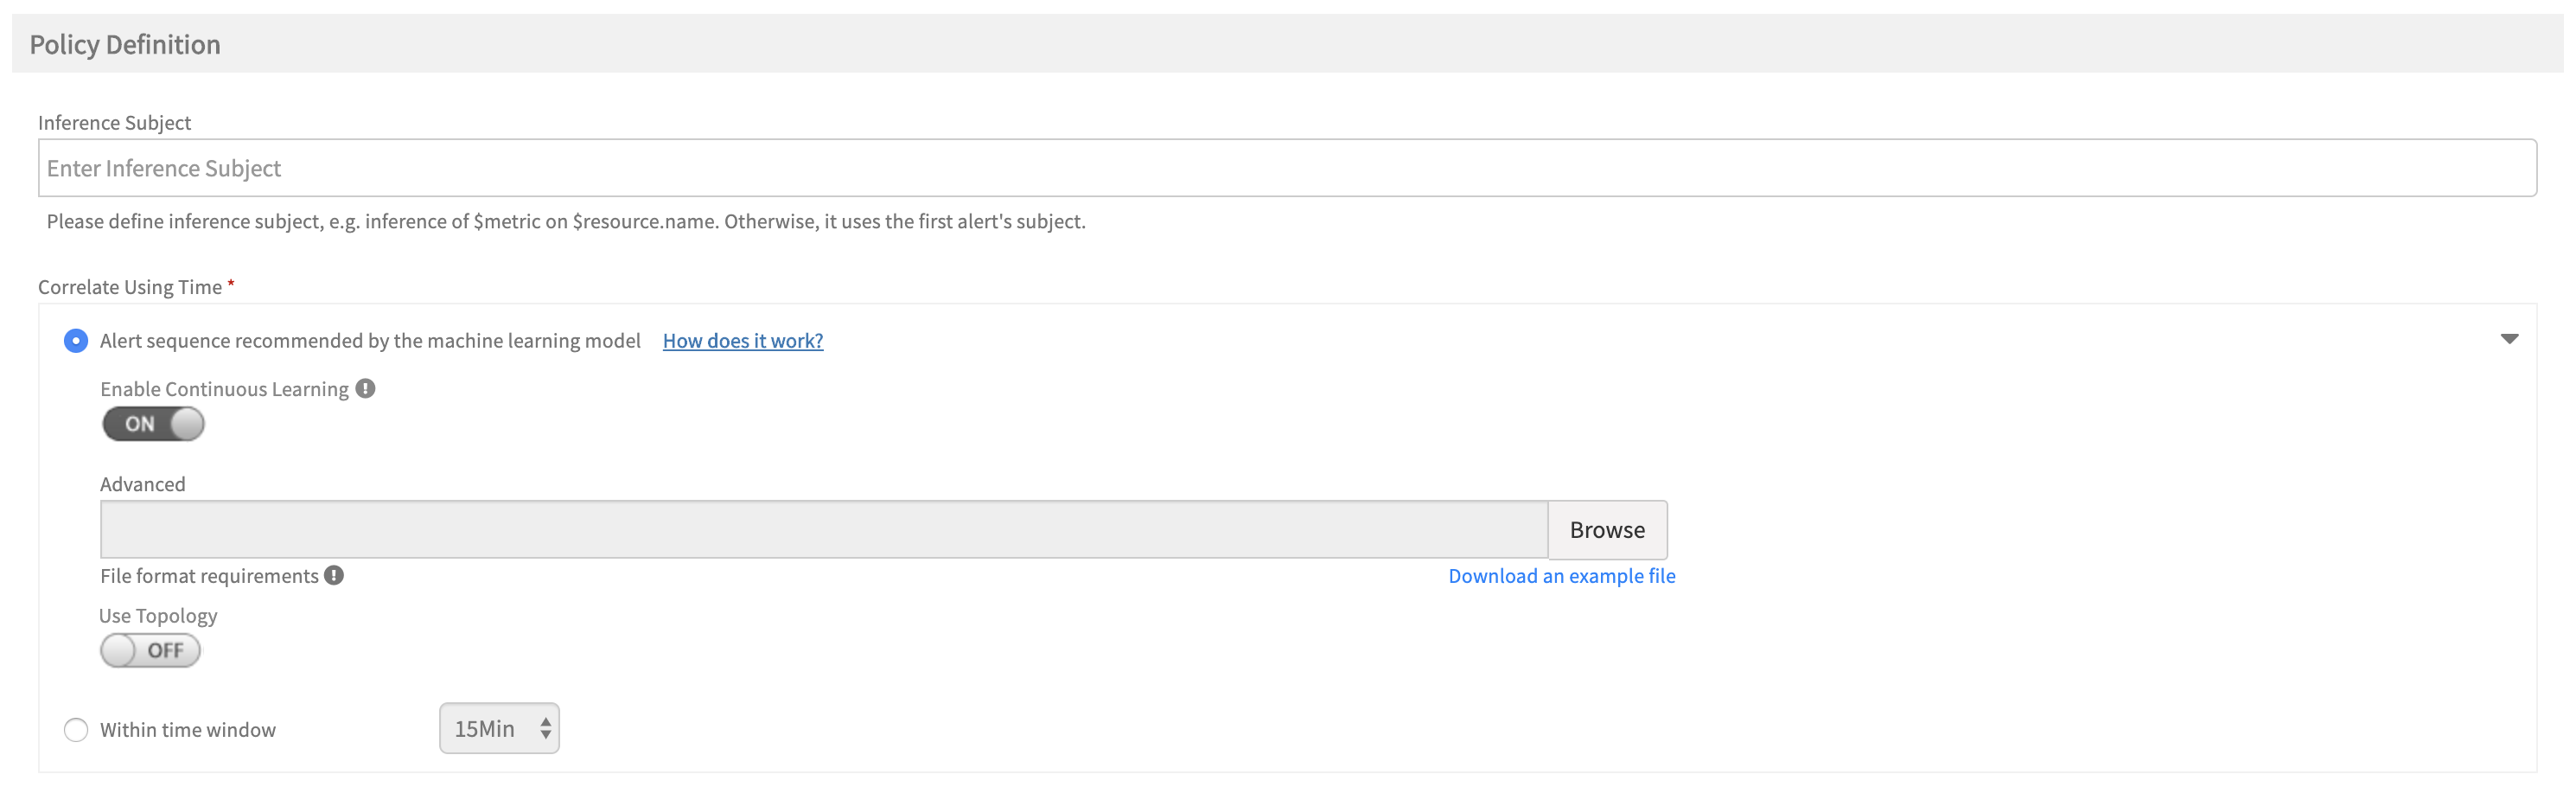
Alert Sequence Explainer
Alert sequence policy status
Included in this release are the various stages an alert correlation policy goes through for machine learning to provide users with the current status and information about what each stage means.
See Alert sequence information for more information.
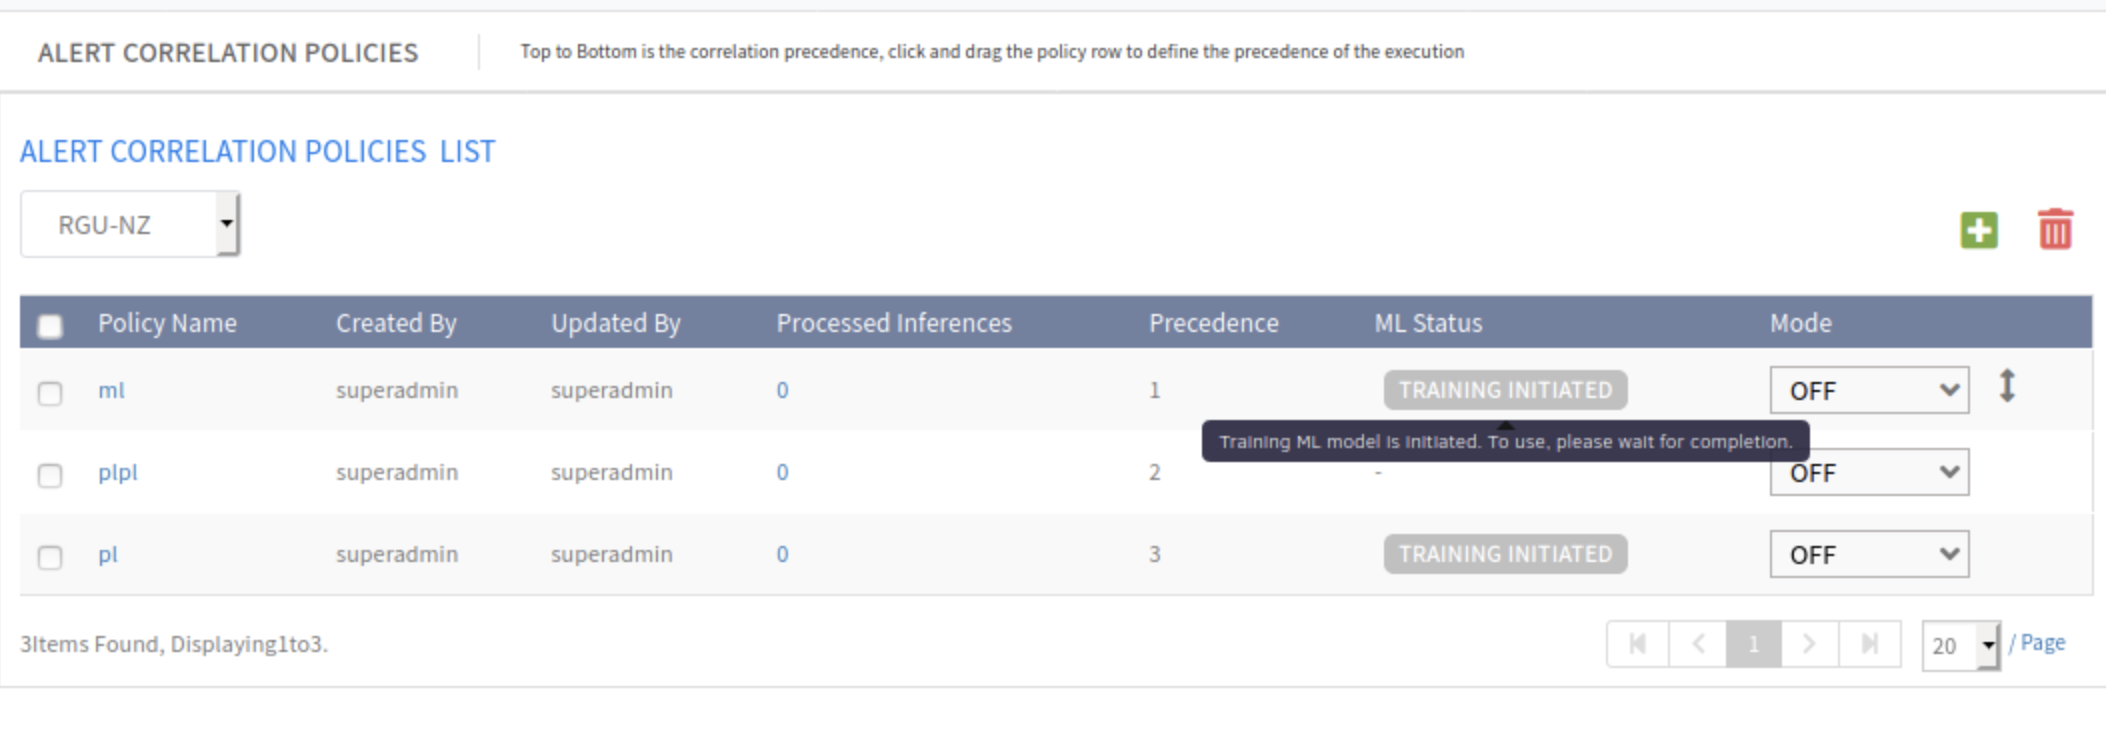
Alert Sequence Policy Status
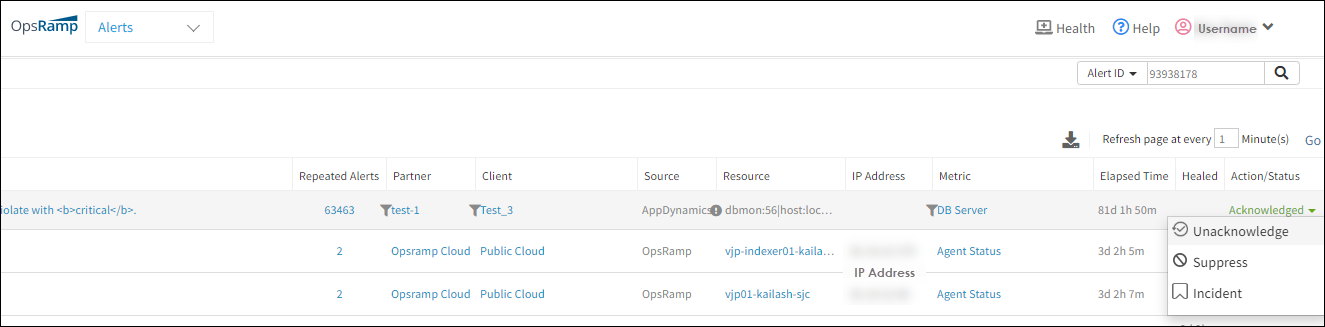
Undo actions taken on alerts
A critical alert can be unacknowledged after it is acknowledged if it needs to be reprioritized.
Also, an alert can be unsuppressed after it is suppressed. When you click the button, a prompt requests a comment on the action and the alert is moved to Open status or Ticketed status depending on if there is an incident ID associated with the alert or not.
Undo Actions on Alerts
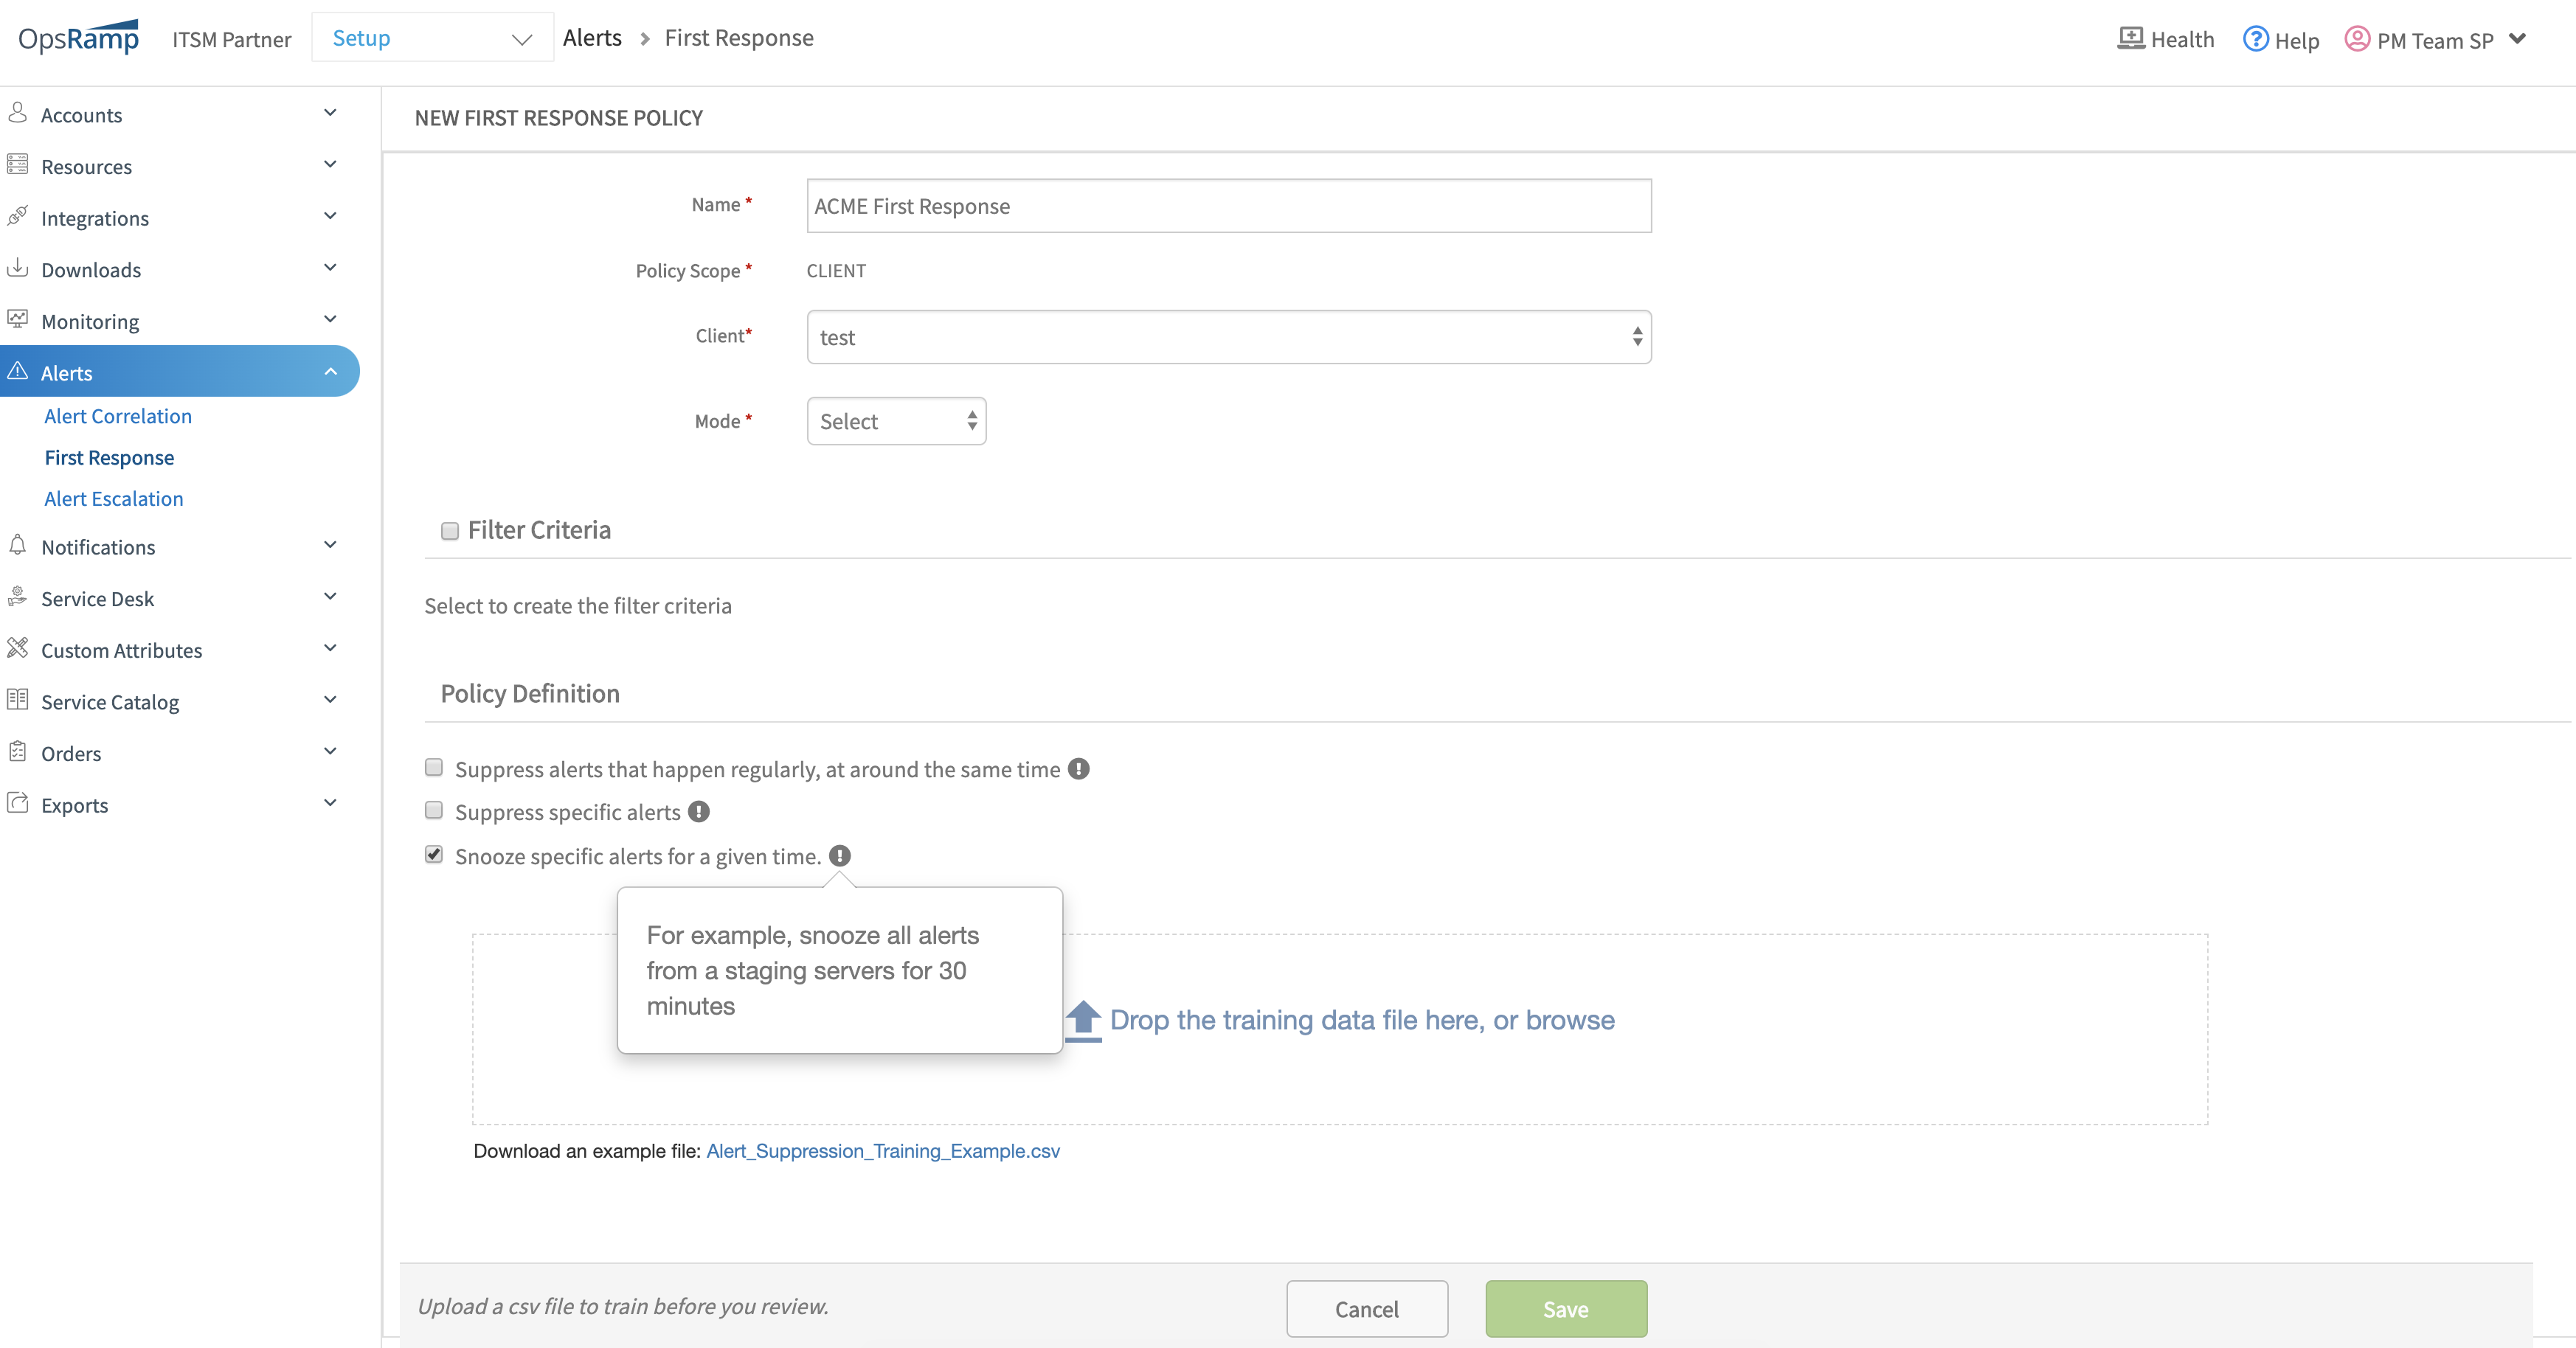
Snooze action on alerts
Alerts can be suppressed for a specific amount of time.
Suppression allows prioritization for critical alert responses and snoozing for non-critical alerts deferred responses. Further, with the First Response policy, OpsRamp can be trained to automatically snooze specific types of alerts.
See Alert First Response Overview - Snooze action on alerts for more information.
Snooze Action on Alerts
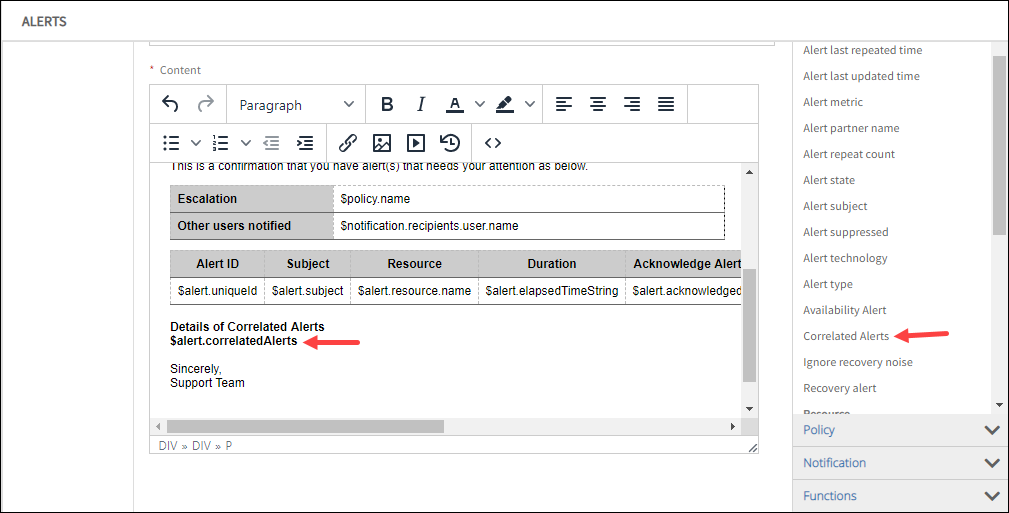
Inference notifications with alert details
Details of alerts correlated to an inference can now be embedded in a notification. This includes impacted resources, alert ID, alert subject, alert metric and alert time.
See Managing Inferences for more information.
Notifications on Inferences
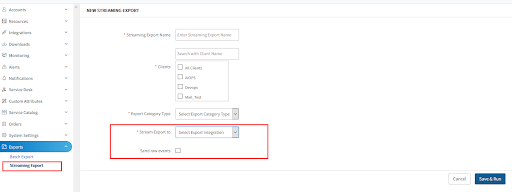
Streaming alert exports
In addition streaming alerts from OpsRamp to an external event bus, alerts can be streamed to AWS EventBridge.
Alerts can be collected from OpsRamp for online or offline analysis in an external system.
For more information:
- See Streaming Export Overview for more information.
- See Managing Streaming Exports for more information.
Note
This feature is an optional module that is enabled for accounts On request. Contact OpsRamp account manager for more information.Streaming Export
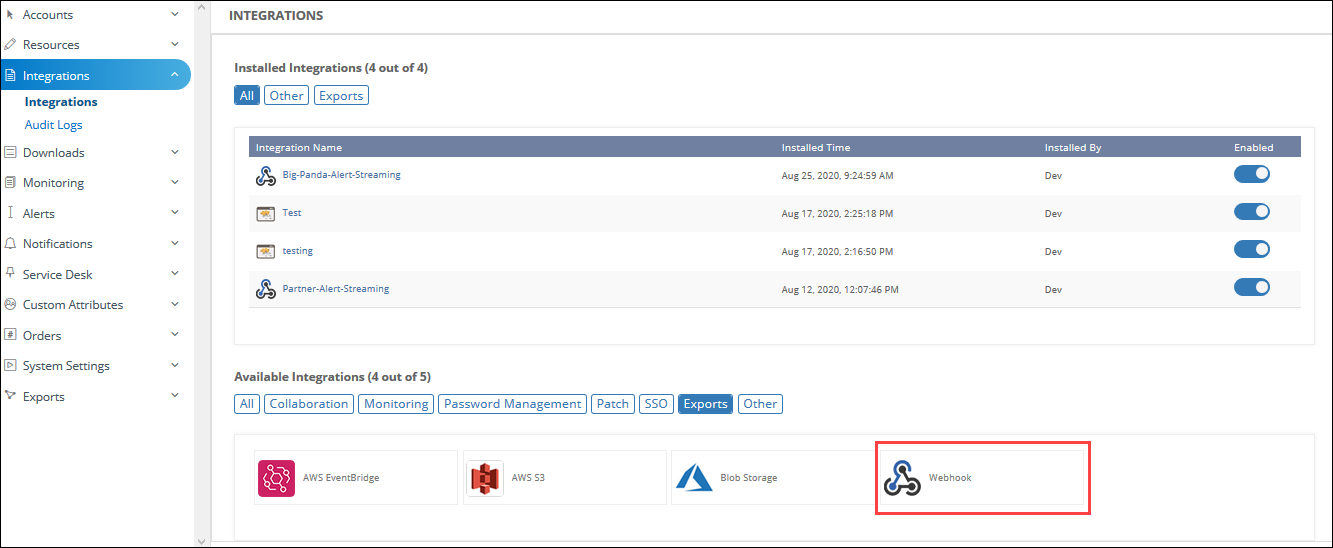
New event integrations
Pre-defined webhook integrations ingest events are available from the following:
Remediation and automation
Process automation
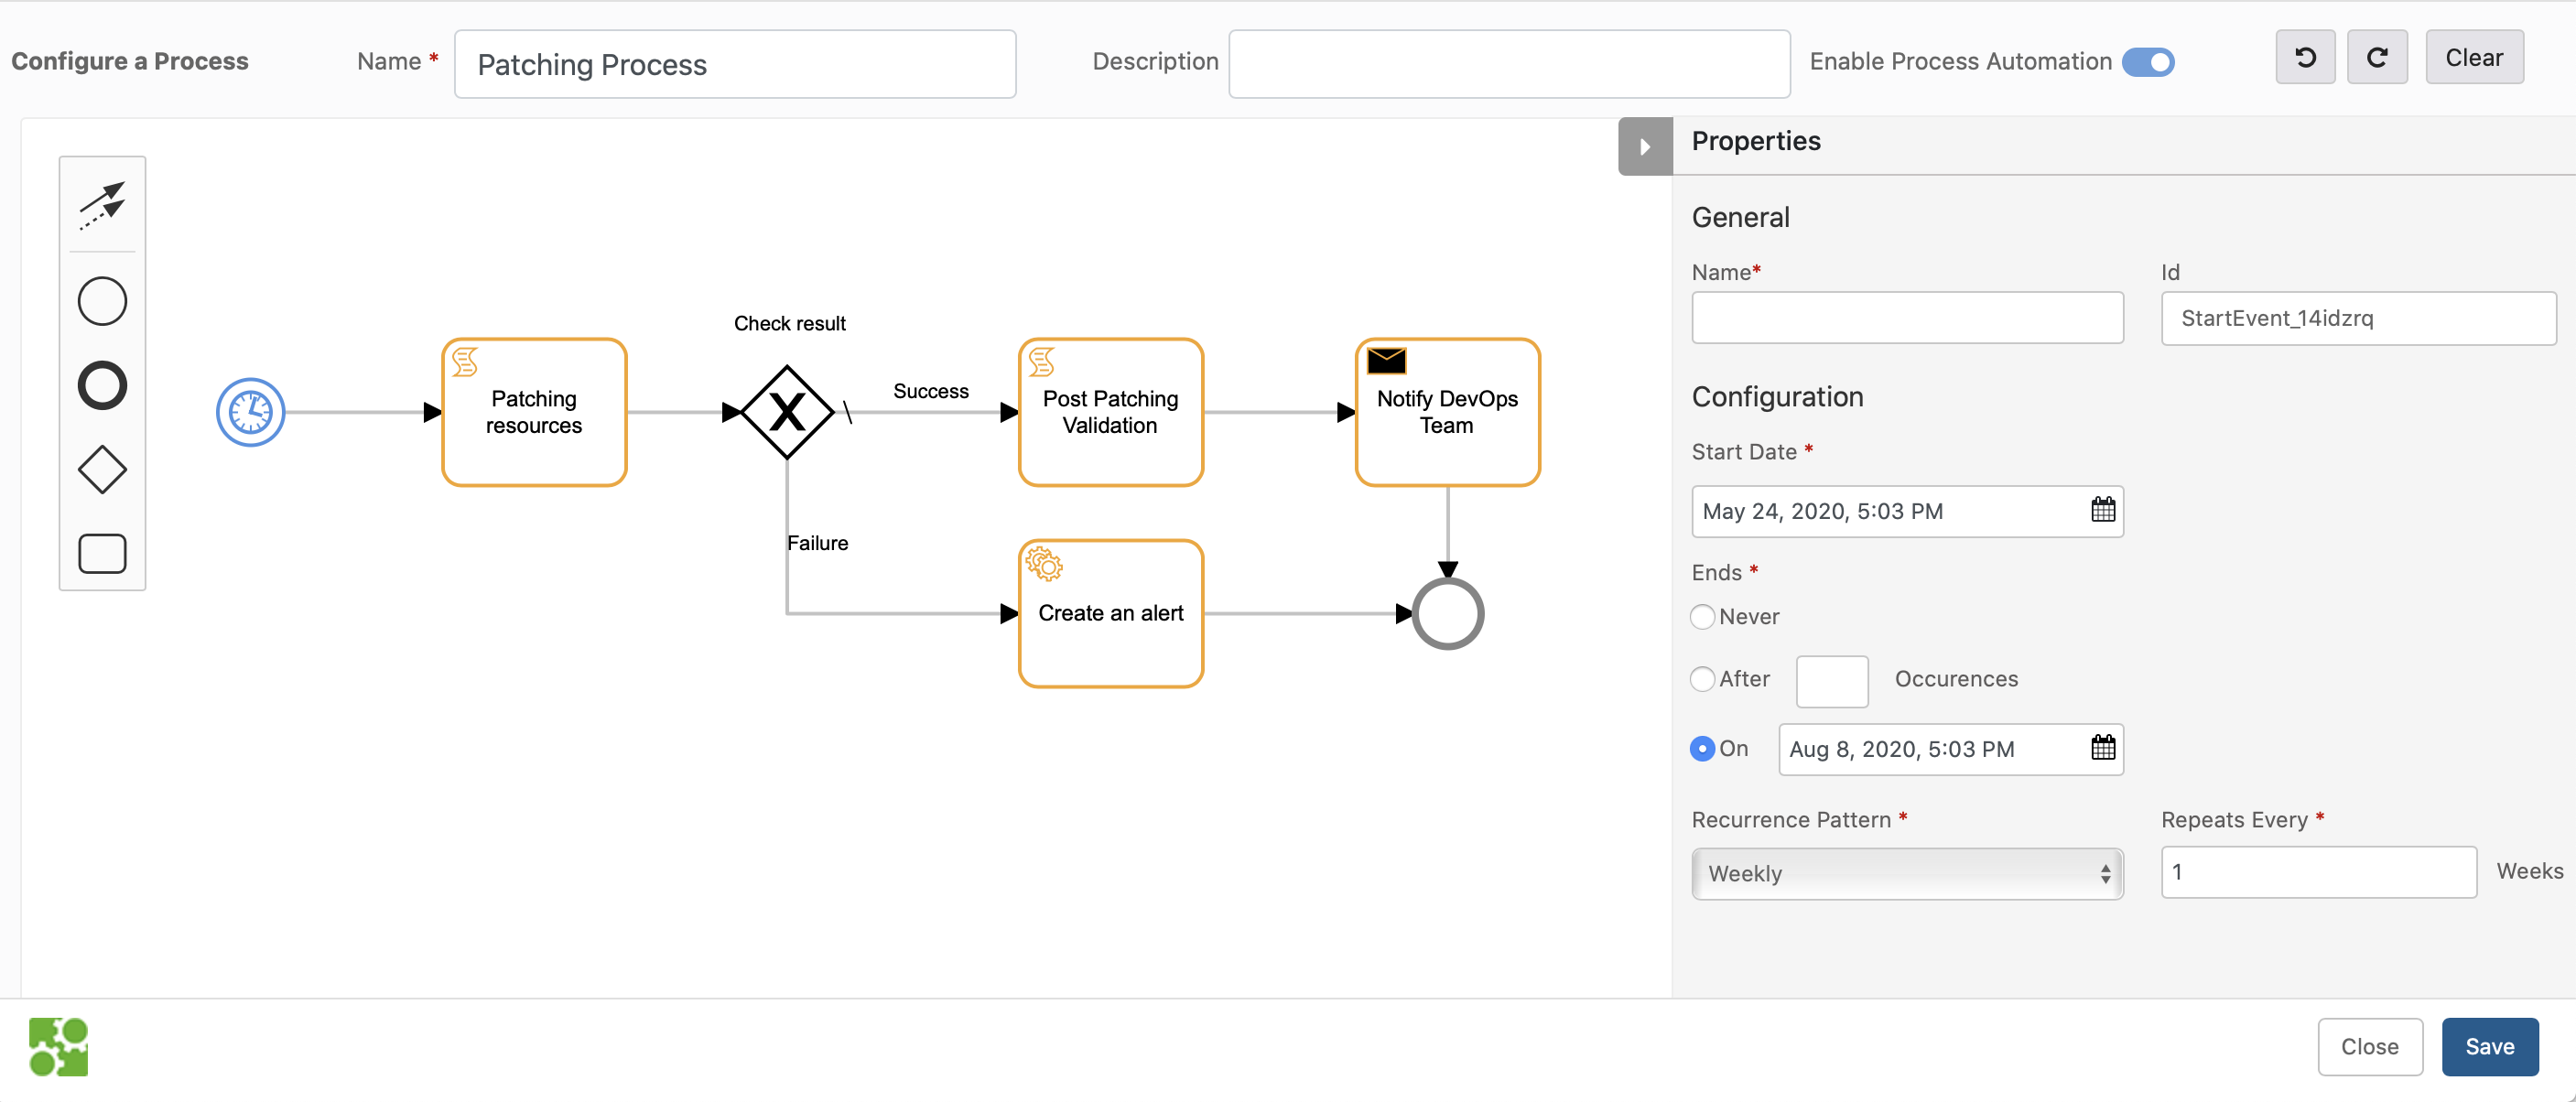
OpsRamp introduces a flexible and powerful new process automation engine.
Using this capability, sequences of automation tasks can be executed. Workflows can be triggered by alerts, on updates to resources, or on a recurring schedule.
The workflow supports the following types of tasks:
- Send a notification to users.
- Call a RESTful API.
- Run a runbook script on a server managed by the OpsRamp agent.
See Getting Started with Process Definition for more information.
Process Automation Workflow
Ansible integration
OpsRamp now integrates with Ansible, a commonly used automation framework.
With this integration, playbooks can be triggered on an Ansible control node through the OpsRamp agent. This feature allows integration of the vast ecosystem of Ansible playbooks into automation processes.
Browser-based remote consoles (BETA)
Launch remote consoles that run directly on web browsers.
Beta Notice
The Browser Console feature is BETA.Note
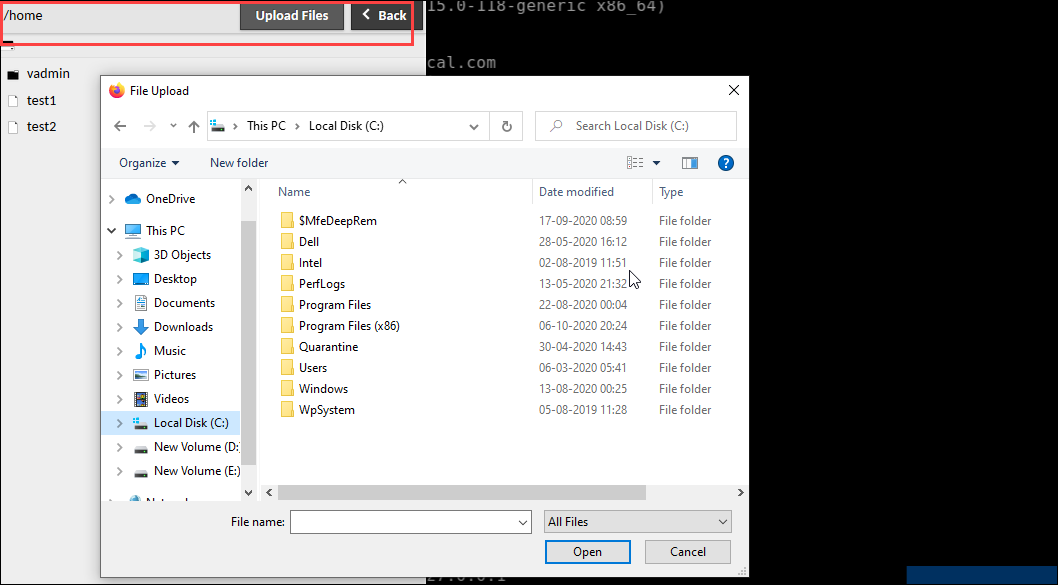
Before this release, remote consoles required that Java on the desktop and consoles run as a separate Java applications.Browser-based consoles support the following capabilities:
- Console protocols: RDP, SSH, Telnet
- File transfer
- Session recording
See Launching Browser Consoles for more information.
Java-based remote consoles are now deprecated and is not available in future releases.
Remote Console Details
Remote Console Details
Reports
Improved custom reports
Custom reports for metrics now have improved graphs. All metrics graphs for a metric are grouped together and graph visualization is improved.
Custom Metric Graph
Tenancy and access controls
Re-authentication on changes to profile details
Changes to the following pages now require re-authentication with two-factor code while using mechanisms such as FIDO U2F, TOTP, and YubiKey. This feature is for added security. Navigate to My Profile, Setup > User Details | Partner Details | Client Details.
Two-Factor Authentication
Package management
Partners can now see the packages that they have subscribed to on the partner details page.
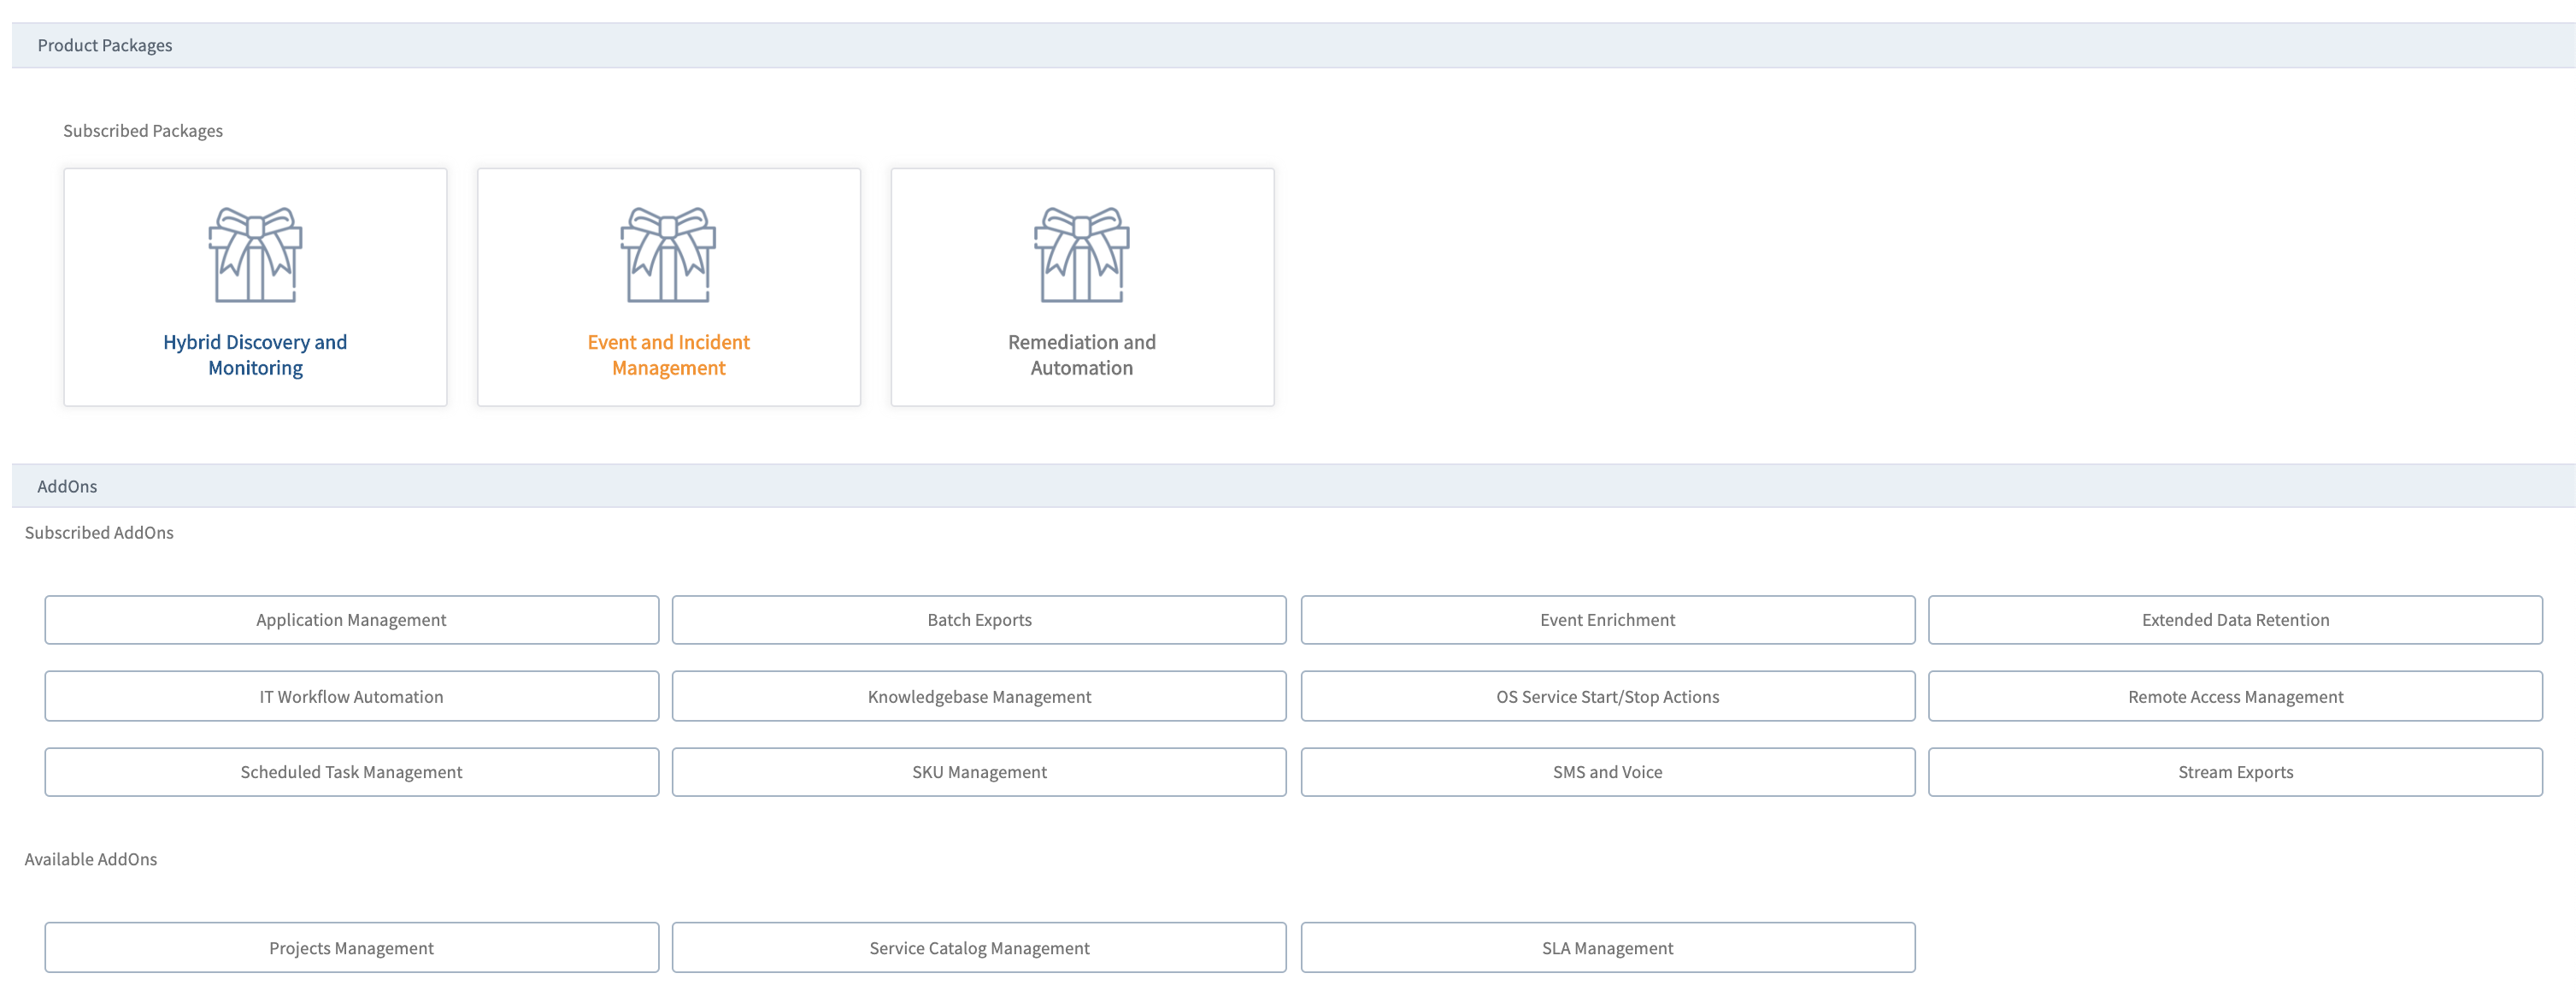
Package Management
When a partner administrator is configuring a client, packages to which the partner has subscribed are available to the partner to offer their clients. With this option, a partner can offer select packages or modules to different clients.
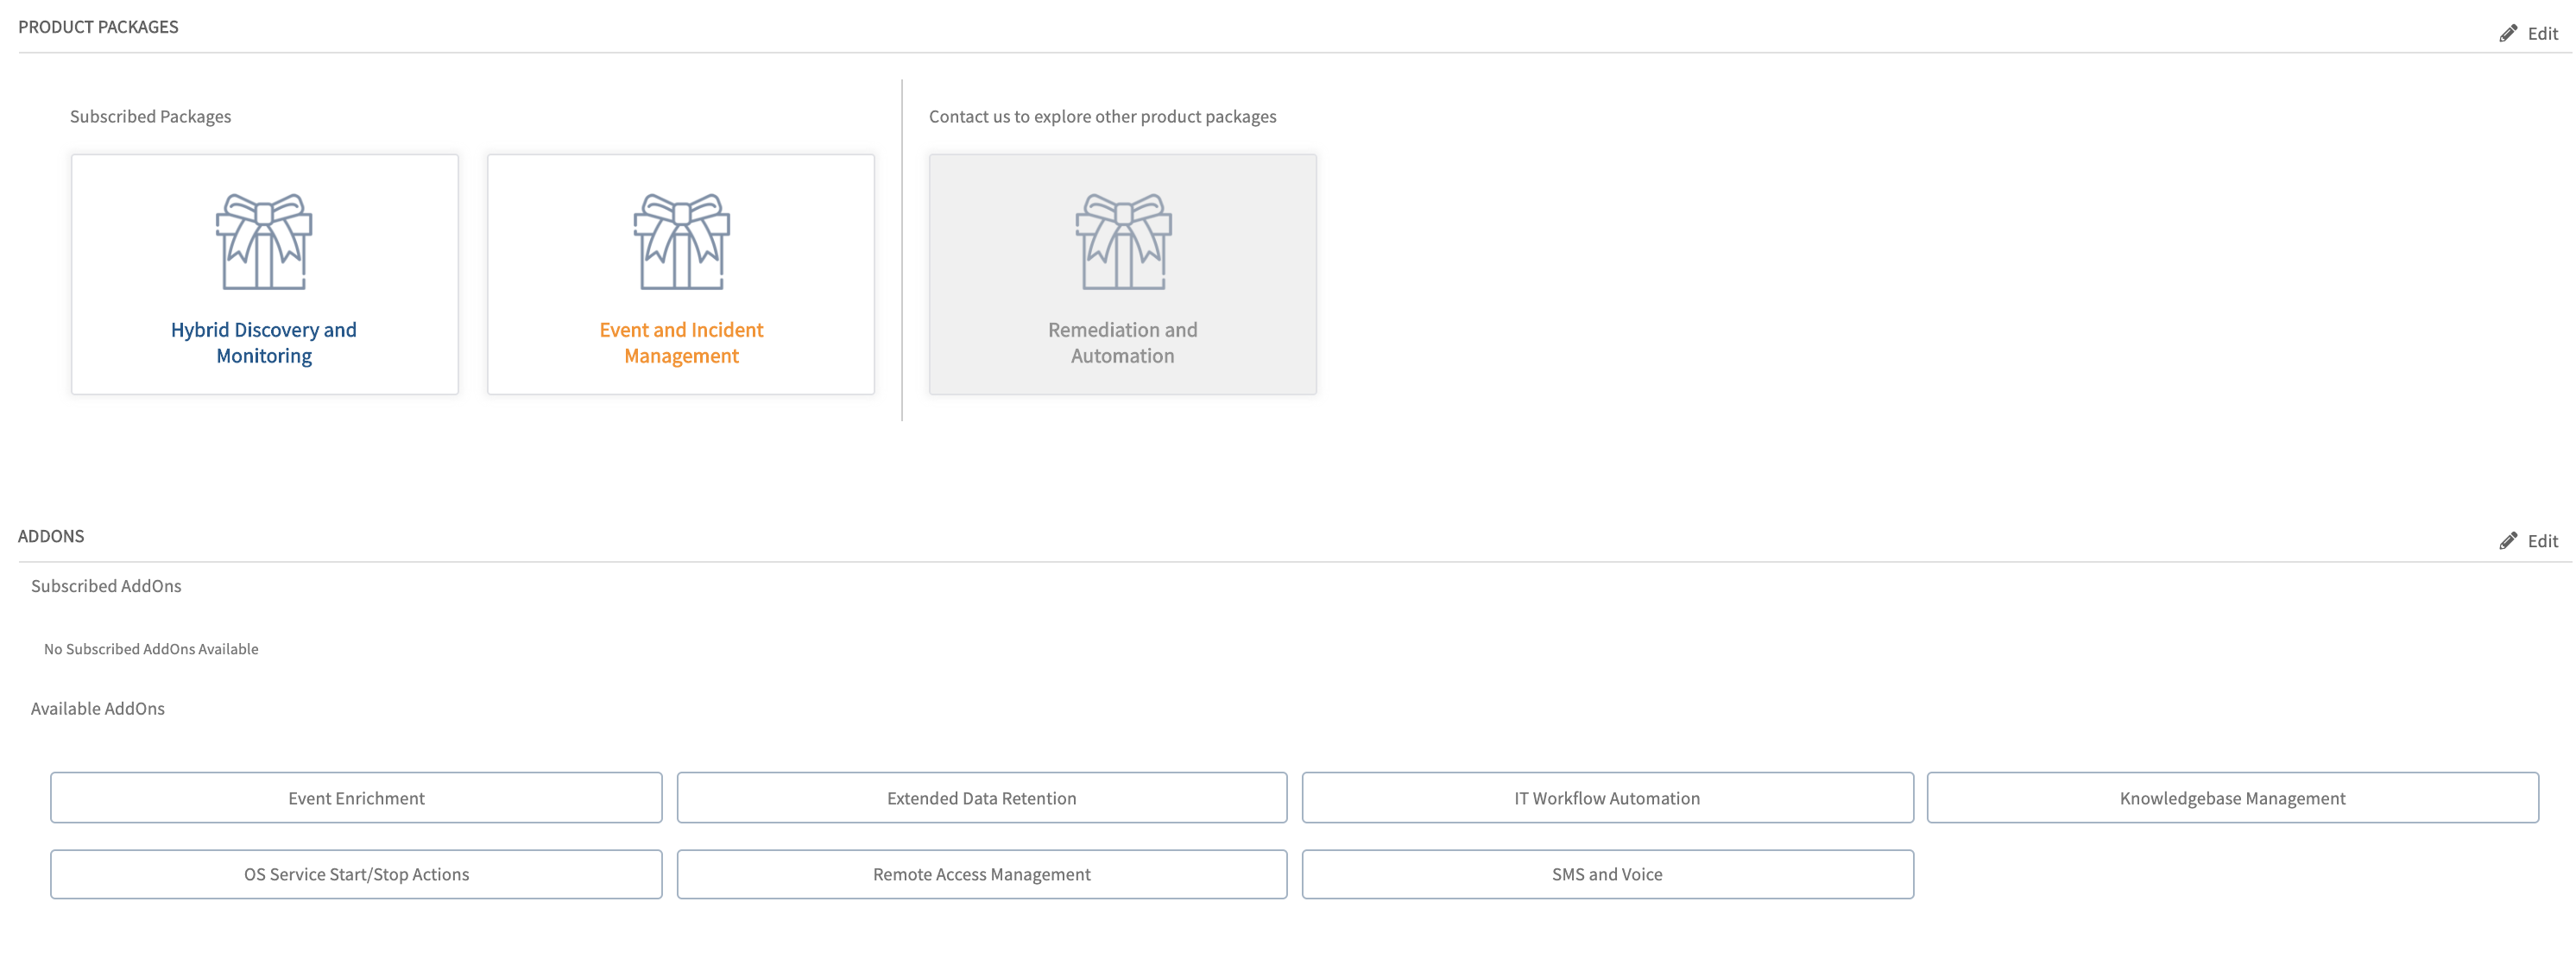
Package Management
API enhancements
Improved create alert API
Create alerts functionality now returns the event ID (as a reference) to alerts that is created after OpsRamp processes the event. Alerts associated with an event ID can be retrieved by using the get alerts by event ID API.
Documentation site changes
The product documentation site is now improved to include:
- Simplified topic layout and navigation.
- Improved search.
- Improved API documentation.
- New topics focused on conceptual overviews, getting started, and onboarding the managed environment.
Deprecated features that are no longer available
As announced earlier, the following features are no longer available in OpsRamp.
- Runbooks in legacy scripting languages. - Neustar event integration.
- Auto user creation in email-based integrations.
- Post-install access to integration key and secret.
- Permanent suppress action on alerts.
- Canonical metric names
February 2020
Dashboards, Reports and UI
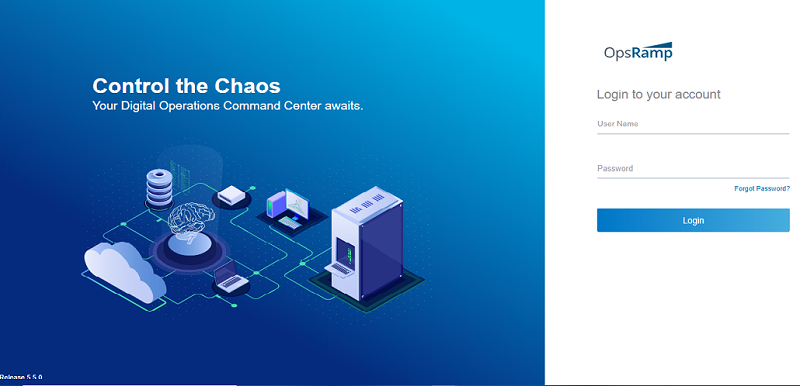
Improved look and task flows for setup pages
Login, account, user management and setup pages now have an improved look and feel with simplified task flows.
These enhancements reduce the number of steps and clicks needed to navigate the platform efficiently, while also providing enhanced visualization.
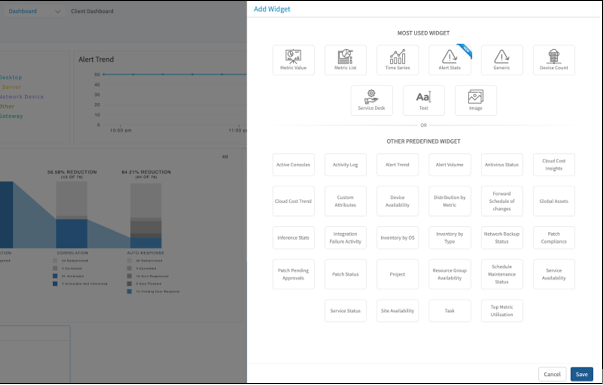
Improved widget selection for dashboards
Selecting new widgets is now easier with a new palette of commonly-used widgets. This visualization makes selecting widgets easier and more transparent.
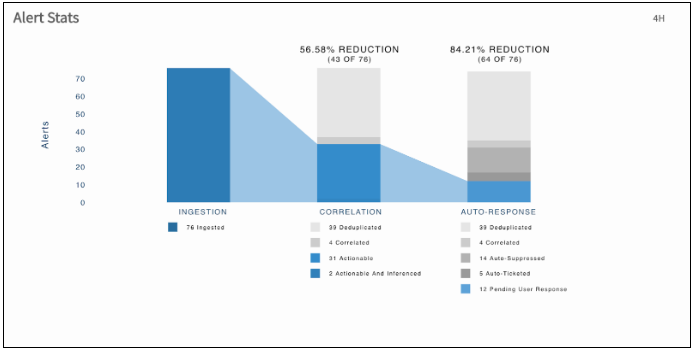
New alert statistics widget
The alert statistics widget shows alert volume reduction by each stage in OpsRamp alert processing pipeline. This widget provides a real-time view of how the machine learning models reduce alert noise.
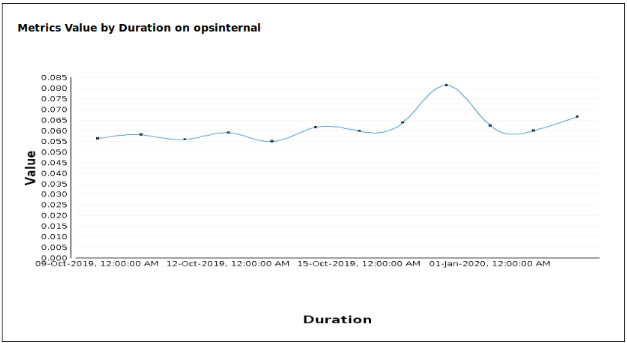
Graphs in custom metric reports
Custom metric reports now support an option to include time series graphs for deeper analysis of insights tracked by OpsRamp.
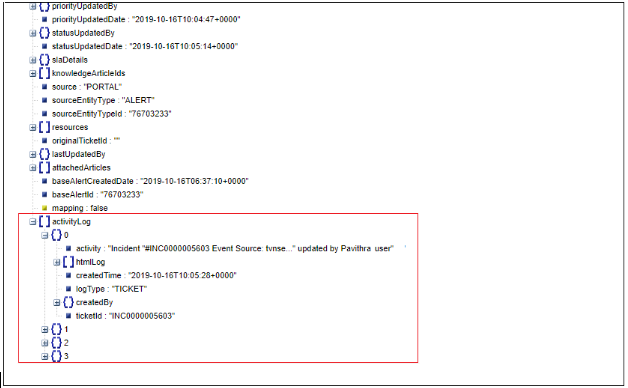
Ticket activity log in ticket export
Exports of ticket data now include the activity log for each ticket. This allows for external data warehouses that consume data exports to accurately account for time spent in each ticket state. See Dashboards and Reportsfor more information.
Event Management
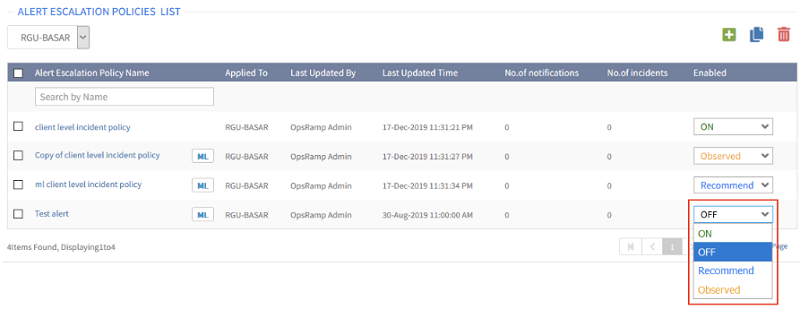
Recommend mode
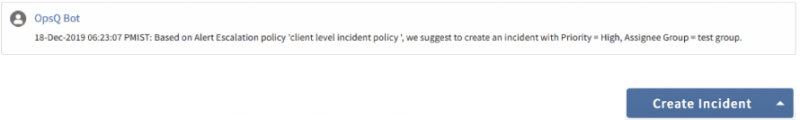
First Response and Alert Escalation policies now provide a new mode - the Recommend mode. In Recommend mode, you see actions that OpsRamp recommends for an alert - based on its automated learning. You can then apply the recommended actions with a single click.
This feature helps you advance from Observed mode, which provides passive insight into decisions that OpsRamp would have made. With recommend mode, you can have a user do final validation before acting on learning-driven recommendations.

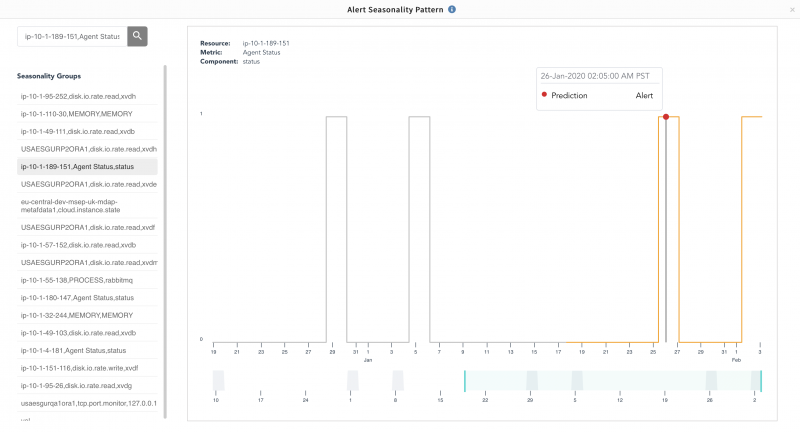
Visualize seasonality patterns in alerts
You can now visualize patterns for alerts that are candidates for auto-suppression. You will see a link within alerts that are auto-suppressed or recommended for auto-suppression to launch a widget showing the historical and estimated trends for alert recurrence.

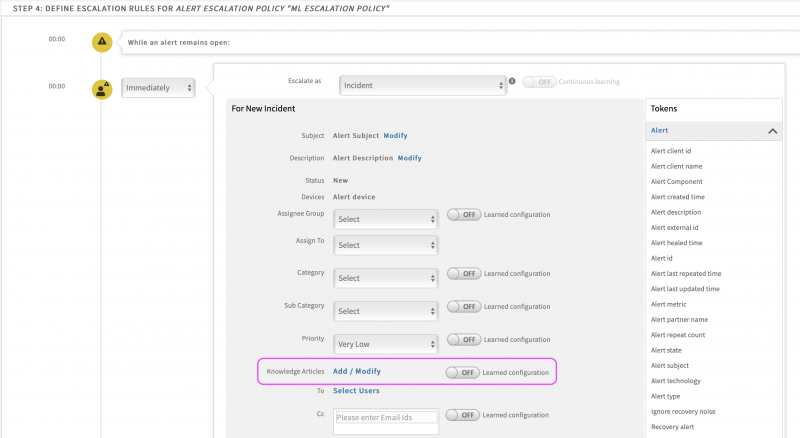
Link knowledge articles to incidents automatically
Knowledge articles play a vital role in helping the IT staff to resolve incidents. Now, you can configure KB articles as part of the alert escalation policy. The incident ticket created through the policy has knowledge articles linked. Alert escalation policies can also learn or be trained to automatically link relevant knowledge articles to incidents.
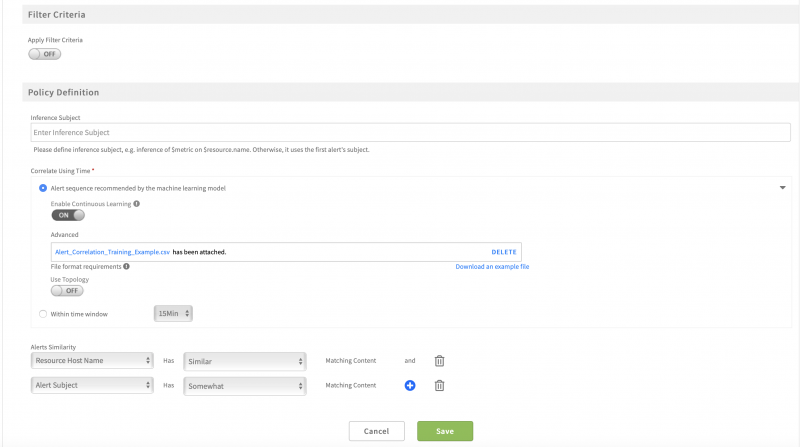
Simplified alert correlation policies
Alert correlation policies are now easier to configure with a newly designed page, which presents policy options in an intuitive layout.
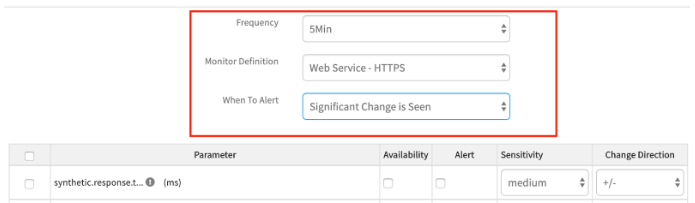
Change detection for all metrics
Before this release, change-based thresholds were available only for metrics collected by the agent and gateway. Now, these thresholds are available for all metrics, including those collected by public cloud infrastructure and web services.
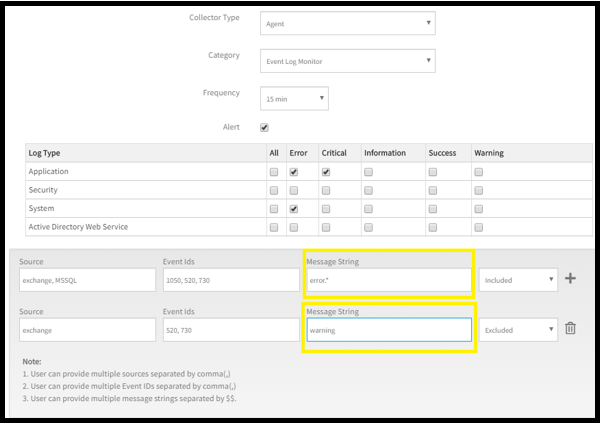
Improved filtering of Windows event logs
The monitoring template for Windows event logs now supports filtering on Message String, including Source and Event ID.
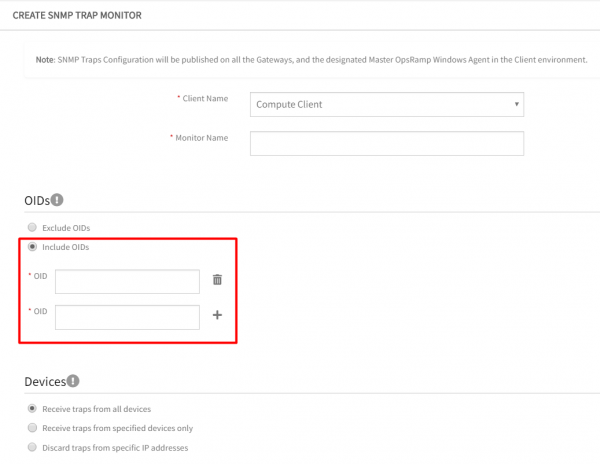
Improved filtering of SNMP Traps
You can now include specific inclusion filters in the SNMP Trap monitors, making it easy to monitor SNMP traps of interest.
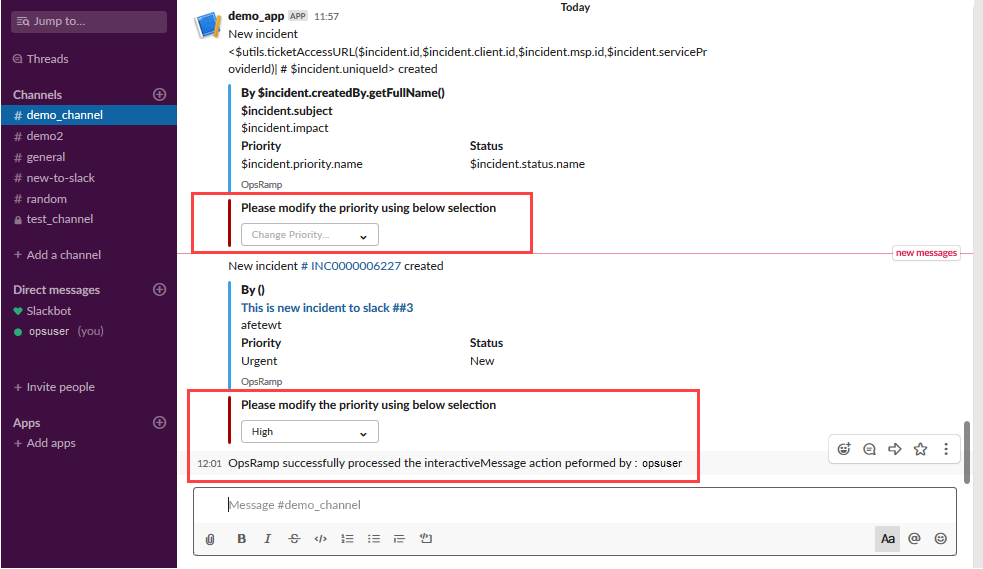
Interactive messages in Slack
With this release, the existing Slack integration is enhanced to support bi-directional integration. After configuration, users can view all OpsRamp-generated incidents as Slack messages on the configured channel and any updates on Slack messages are reflected in the OpsRamp incident. See Slack for more information.
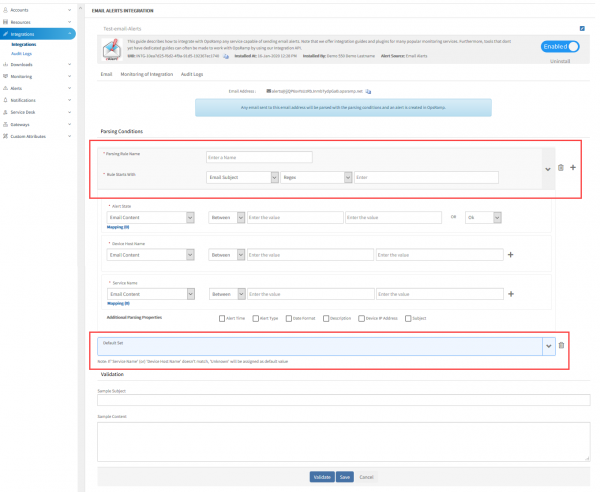
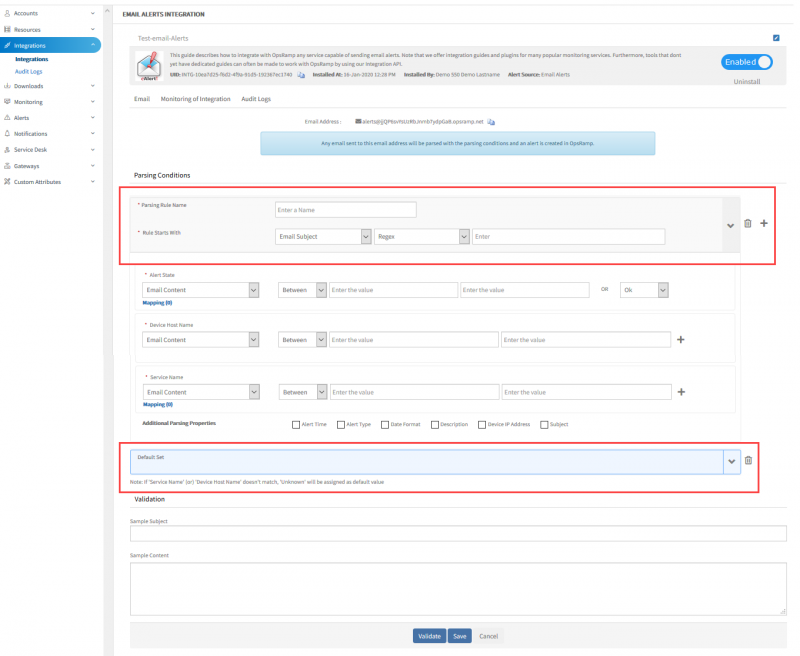
Usability improvements in email integration
The email-based integration framework has an improved user experience. The interface for defining parsing conditions is simplified and the integration framework allows users to define a default parsing condition to avoid dropped email notifications.
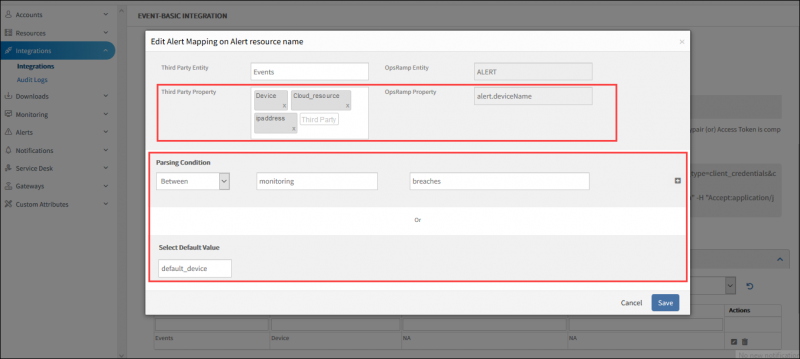
Multiple property and parsing support for webhook-based integrations
Webhook-based event integrations now support improved parsing of event payloads and
mapping event properties to OpsRamp event model.
Supported patterns:
- Between
- Before
- After
- Regular Expressions
New alert integrations
OpsRamp now includes integrations to ingest events, using webhooks, from the following products:
Hybrid Cloud Discovery and Monitoring
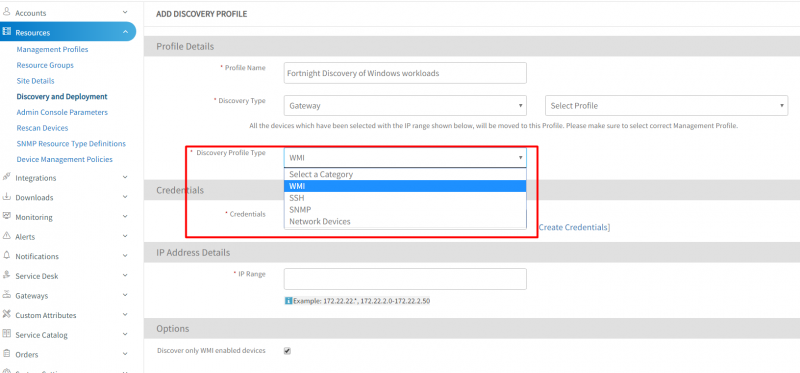
Improved Windows and Linux discovery
OpsRamp now enables remote discovery of Windows and Linux servers using WMI and SSH protocols. See Discovery for more information.
WMI discovery is supported only through Windows-based gateway, while SSH discovery is available from both Windows & Linux gateways.
Custom monitors for Windows servers
With this release, the gateway is available as a Windows application (see release note). Custom monitors, based on Powershell and WMI, are supported on the Windows gateway. You can now write agentless custom monitors for applications running on Windows systems.
See Agentless Monitors for more information.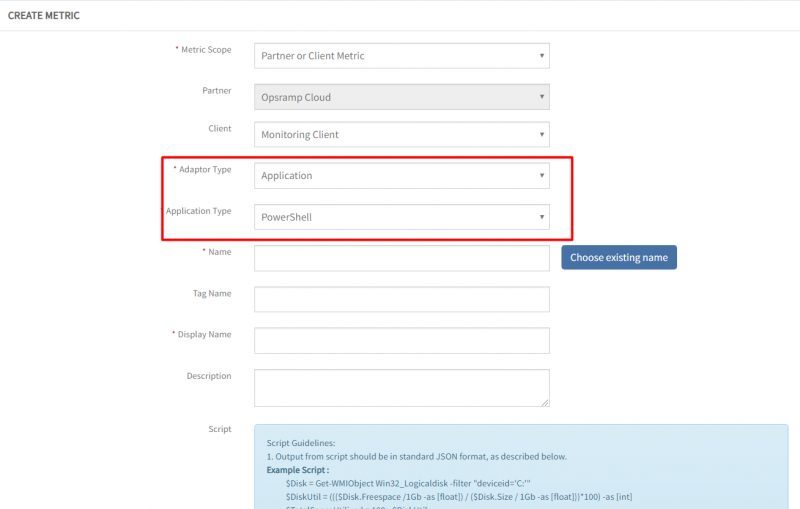
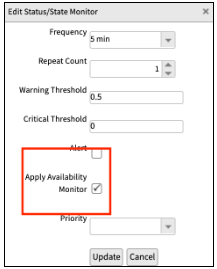
Default availability monitors for cloud resources
The “Status/State” metric found in cloud monitoring templates is now the default availability metric. This provides administrators with a high level understanding of resource availability after assigning monitoring templates.
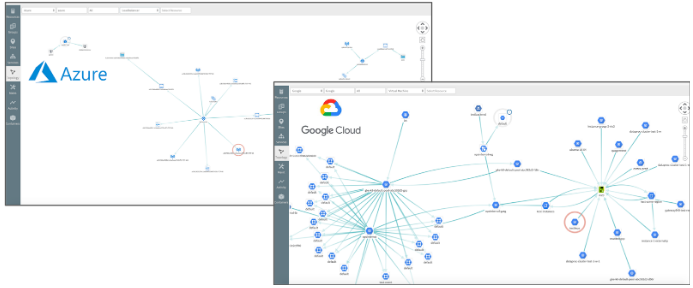
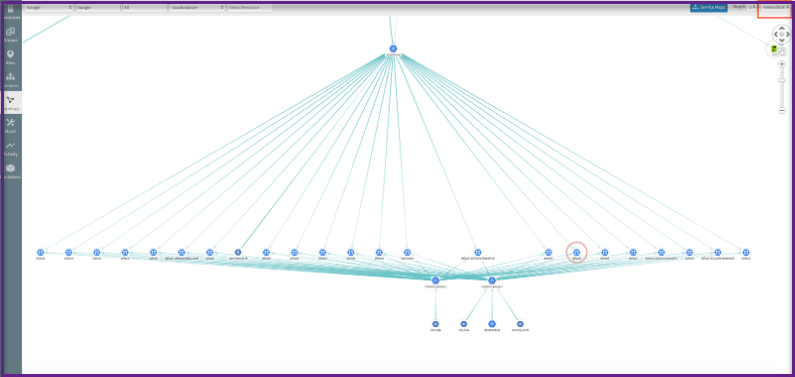
Topology discovery and visualization for Azure and Google Cloud Platform
Building on the existing support for AWS Topology, OpsRamp now supports automatic topology mapping for services in Azure and Google Cloud Platform. This enhanced topology enables teams to identify misconfigured routing rules, visualize VMs that have redundant network routes and more. This relationship data will also be leveraged by OpsRamp event correlation models to reduce alert fatigue and enter the cloud administrator more context when troubleshooting. See Service and Topology Maps for more information.
Expanded support for AWS, Azure and Google Cloud services
OpsRamp can now discover and monitor the following services:
AWS
- AWS Transit Gateway
- AWS CloudSearch
- AWS DocumentDB
Azure
- Azure Application Insights
- Azure Traffic Manager Profiles
- Azure Virtual Networks
- Azure Route Table
- Azure Virtual Machine Scale Set
- Azure SQL Elastic Pool
- Azure Service Bus
Google Cloud
- Google BigTable (Instances, Clusters, Nodes, Tables)
- Google Cloud Composer
- Google Cloud Filestore
- Google Cloud Firebase
- Google Cloud Firestore
- Google Cloud Memory Store for Redis
- Google Cloud Run
- Google Cloud TPU
- Google Cloud Tasks
For a complete list of supported AWS, Azure, and Google Cloud resources, see Support Matrix.
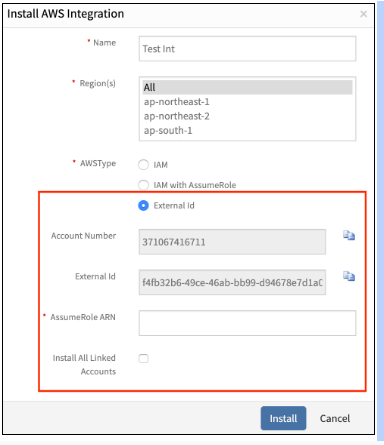
Onboard AWS resources with External ID and Role ARN
OpsRamp now allows users to onboard their AWS accounts using an External ID and Role ARN. This creates a more secure and stable mechanism for onboarding AWS resources and is aligned with AWS best practices. See Amazon AWS Integration for more information.
Topology map layout improvements
Users can visualize their discovered topology with a hierarchical view. With hierarchical views you can easily see dependency relationships, host connectivity to network infrastructure, and clustered resources.
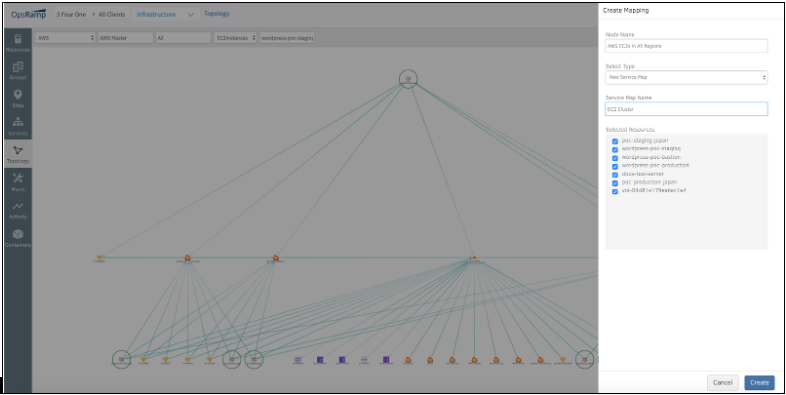
Create Service Map from Topology Map
Now, you can create service maps from discovered topology results. Bridging service maps and topology gives context when creating service maps and will ultimately deliver better alignment with application or infrastructure topology. See Service and Topology Maps for more information.
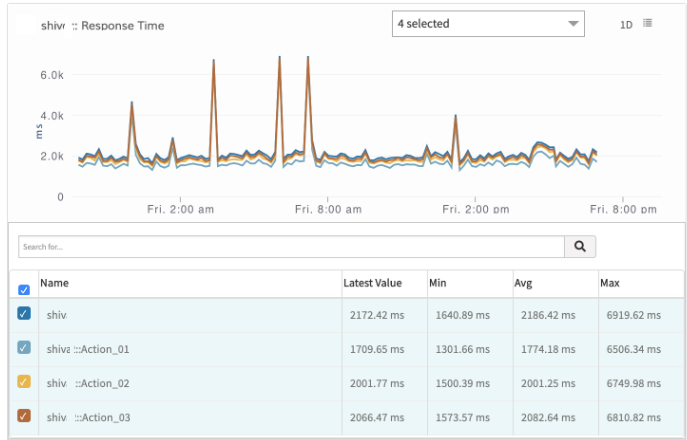
Step-wise breakdown of Synthetic transaction performance
After creating a custom HTTPs synthetic using the Selenium plugin, OpsRamp can now provide deep analysis into each step performed in the transaction. Having deeper insights into the Synthetic transaction enables web service owners to have more context when diagnosing and trying to pinpoint web service issues before the end users are impacted.
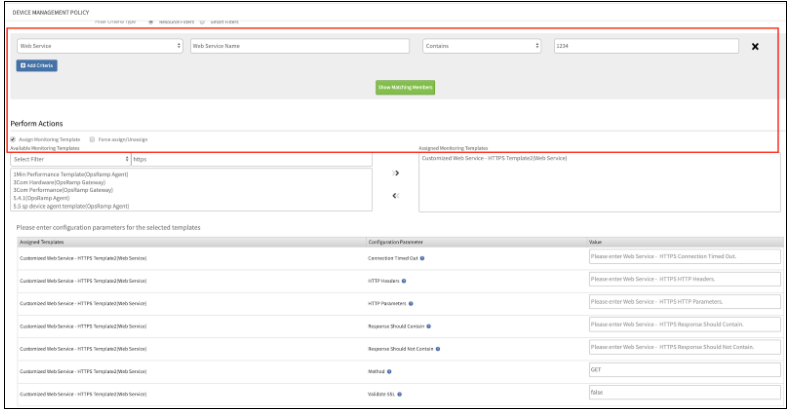
Improved template assignment for Synthetics
Users can now assign templates to web services using device management policies. Many of the configuration parameters for synthetic monitors have also been moved to templates to allow for easier deployment and configuration of synthetic resources at scale. See Monitoring for more information.
Case sensitive custom attributes
Custom attributes are now case sensitive. Any attributes that are ingested from Third-party tools, or created natively in OpsRamp now retain their case. This means that users can take advantage of any custom tags that are created in Third-party tools, or natively, to group resources, and created service maps.
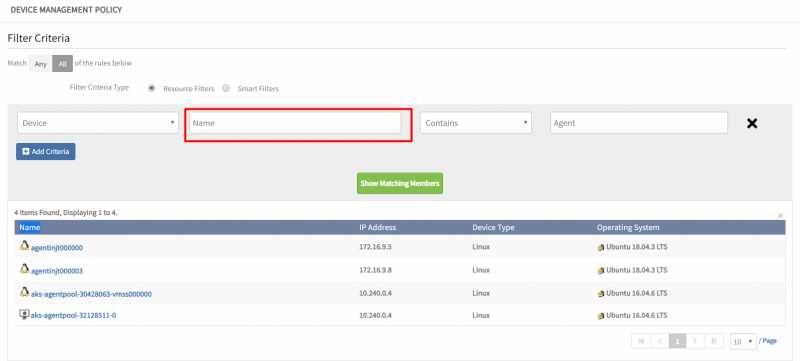
Uniform name attribute for all resource types
Users can now leverage the name attribute to create resource groups, assign monitoring templates or create service maps. The name attribute is derived from the following attributes with the corresponding priority:
- Alias Name
- Host Name
- Resource Name
Customers can now use a consistent name attribute to query and use across the entire platform.
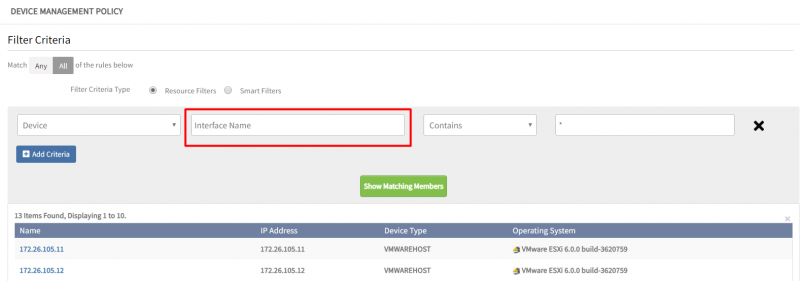
Define device group based on resource interfaces
Users may now use the interface names to group resources. This enables users to group resources that may share a common port or create service maps with the interfaces that support a service.
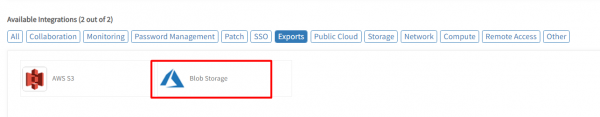
Azure Blob Store integration for data export
OpsRamp now supports Azure Blob storage. Users can take advantage of this integration, using the data export feature, to export data to Azure blob storage.
Instrumentation management
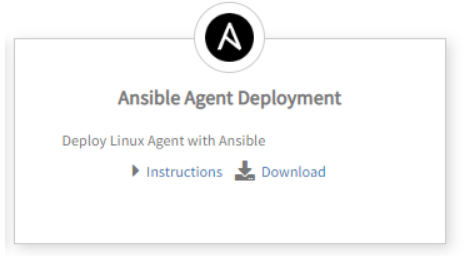
Ansible playbook to manage Linux Agent
Agent deployment on Linux machines can now be performed using Ansible playbooks. This feature helps users deploy and manage agents at scale with greater efficiency. Users can install agents, switch the agent from proxy to direct and vice versa, update agents, and uninstall agents. Users can download the Ansible playbook from the Agent download section. See Agents for more information.
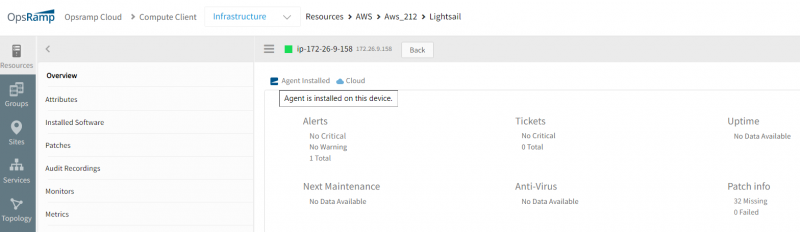
Automated Linux Agent deployment for AWS Lightsail
OpsRamp can now automatically deploy the Linux Agent onto auto-provisioned AWS Lightsail virtual machines. With this capability, OpsRamp provides visibility into VMs as soon as they appear.
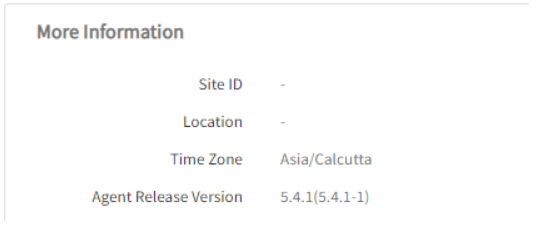
Changes in Linux and Windows Agent version numbering
The numbering scheme for OpsRamp Agent versions is changed to align with product release numbers. See Agents for more information.
Windows Agent Release Version Number:
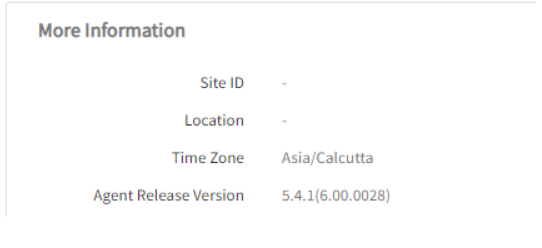
Linux Agent Release Version Number:
Agent installation and uninstallation logs
Windows and Linux Agents will now leave the trace of installation and uninstallation logs in the end machine. For installation and uninstall issues, these logs provide visibility about the Agent and help identify the root cause of the issue.
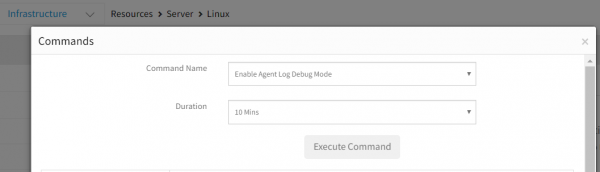
One-click to enable debug logs on agents
Agent logs can be set to debug mode from the OpsRamp UI. This makes it easy to temporarily enable debug mode to troubleshoot issues. See Agents for more information.
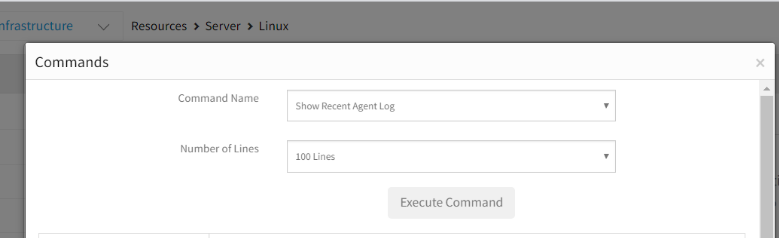
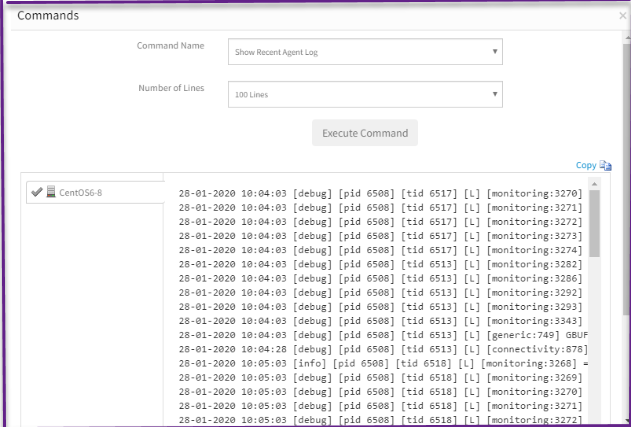
View agent logs from the UI
You can now see Agent logs from the UI using remote commands.
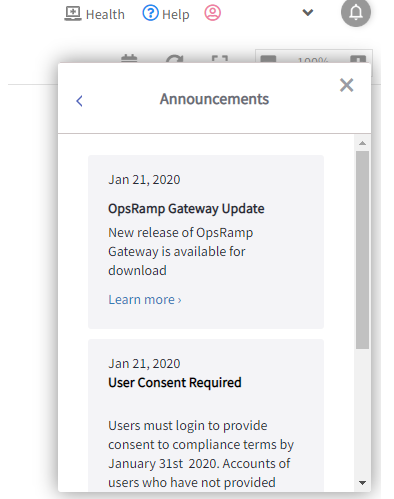
Release Notifications
A new notification feature is now available in the UI. OpsRamp will communicate product related notifications such as upcoming releases, gateway updates, and other information through this new channel.
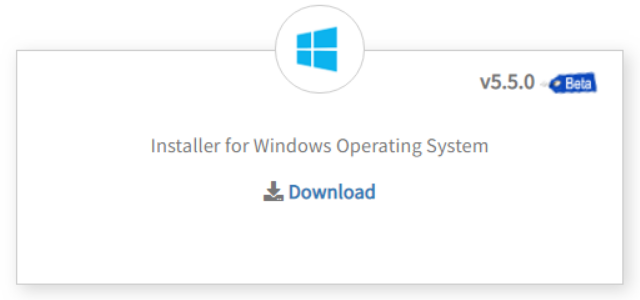
Windows Gateway (Beta)
The gateway is now available as a Windows application. See Gateways for more information.
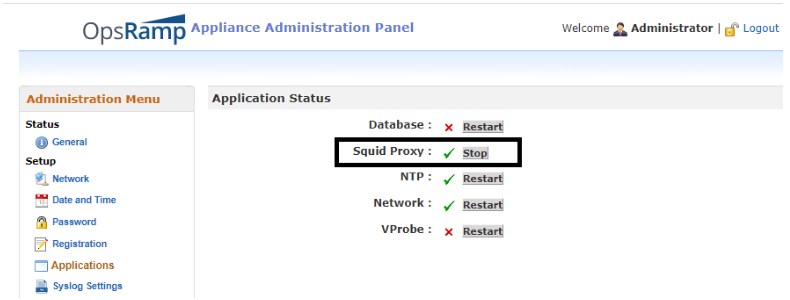
Manage proxy settings on gateways
As part of the gateway security measures, the proxy service on the gateway can be turned off. Users can do this from gateway web UI,console UI, or API.
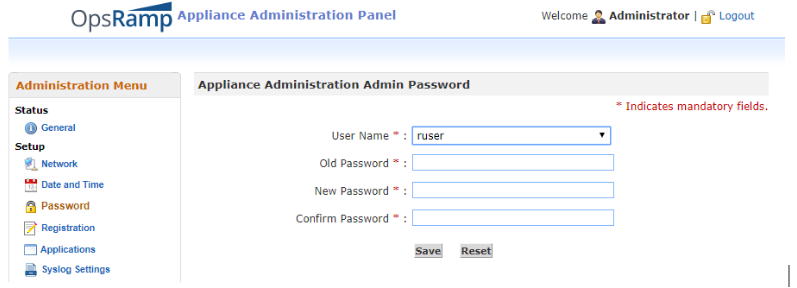
Password change option for ruser account on gateways
You can now change the password of the ruser account on the gateway.
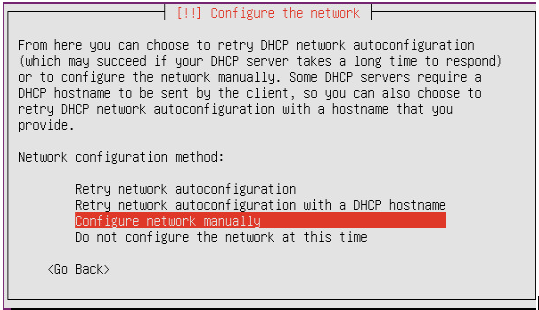
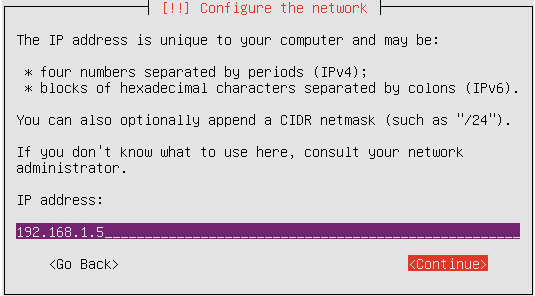
Gateway with persistent static IP configuration
By default, the gateway appliance uses the IP address assigned by DHCP during the installation. Before this release, the gateway did not persist the static IP address assigned in a non-DHCP network, between reboots. Now, the static IP address is persisted across reboots, on DHCP and non-DHCP networks.
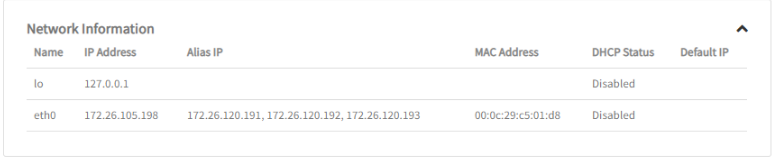
Resource alias IP detection
The OpsRamp Agent is now able to identify all primary and corresponding alias IP addresses on a resource and makes them available in the resource attributes section under “Network Information”. With this, users have visibility into all IPs that are assigned on one or more network interfaces present on a resource.
Access Controls
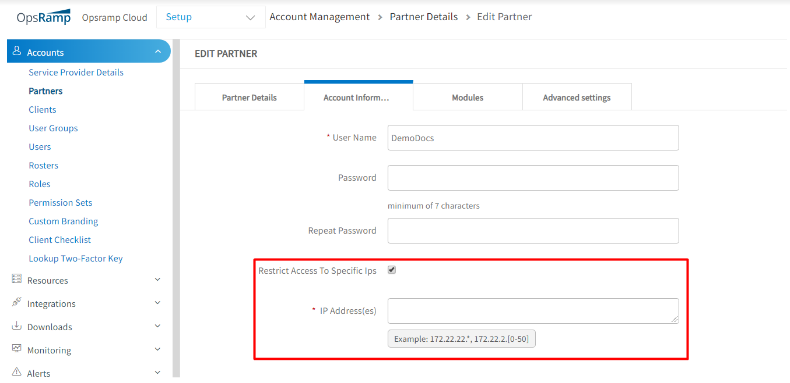
Restrict access from specific IPs
OpsRamp now provides flexibility for administrators to control access to the OpsRamp UI, based on a user IP address. Partner-level administrators can specify a list of IPs from where users can log in to OpsRamp.
Disabling multi-factor authentication requires one-time password
Users will need to re-authenticate themselves with OpsRamp using the one-time password before they can deactivate multi-factor authentication on user accounts. This provides another layer of security to ensure that organizations that require 2FA can stay in compliance.
APIs
OpsRamp platform provides a rich set of REST APIs across different platform components, enabling seamless integration with third-party products. This release introduces brand new APIs for topology and monitoring management, including enhancements to existing APIs.
Topology API
Now, you can extract Topology information from OpsRamp using REST APIs. Leverage this information to populate CMDB tools, do impact analysis, and more.
Minimal details of Resource
A new Resource API endpoint to fetch minimal details of resources like synthetics or RDS resources is now available. This API was designed to return only key attributes of resources so users could more quickly and efficiently access the resources they were looking for without receiving the full attribute payload.
Improved Patch API
Patching information on a resource now provides status about the installed patch, delivering context for any patching failure or issue that may arise during the patch.
Improved resource API
Device Management Policy APIs are updated with details about the required payload attributes and more attributes in the payload and responses. These checks ensure that administrators understand what payload attributes are needed to successfully create a device management policy using the API.
Improved client API
Client APIs is updated to restrict access of the platform by whitelisting IPs.
Deprecated features no longer available
As announced earlier in Planned Changes, the features below are no longer available in OpsRamp.
- Classic Infrastructure UI
- SSLv3 and RSA_with_RC4 Ciphers from NetApp Filer
- SNMP Trap Filters: SNMP Trap Filters are replaced with the new SNMP Trap Configuration module available under Monitoring Management in the Setup section.
- Removal of Download to PDF option for knowledge articles Download PDF menu option has now been removed from the knowledge base articles UI.
- Bulk Import option: You can use the resource APIs to add, change and remove resources in bulk.
- Alert integrations
The following integrations are removed from the available list and alternatives are recommended.
| Integration | Alternative Integration |
|---|---|
| OpsManager | Custom integration |
| DELLCOMPELLENT | Email Integration |
| SAP Solution Manager | Email Integration |
| New Relic Legacy | Use the latest New Relic integration |
User accounts without GDPR consent are disabled
As announced in a previous release, accounts of users who have not consented to the OpsRamp implementation of the GDPR policies are disabled. Contact Support to reactivate your account.
Order of Execution in Device Management policies
As announced in a previous release, the order of execution currently in device management policies are removed. This change has no impact on existing behavior or performance of device management policies.
Service Map UI Changes
In accordance with the deprecation of the classic infrastructure UI, there are several changes to the creation of service maps.