Dashboard
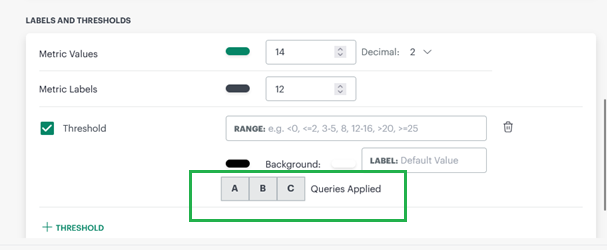
Ability to define threshold limits for each distinct metric units in metric tile Enhancement
In the Metric Tile with multiple queries, users can now define explicit thresholds and the unit of the metric per query instead of a common value for all queries.
Tabular Visualization for the Created Time Attribute for Alert Tile Enhancement
The tabular visualization for alert tile has now improved to show all the alert attributes, including Created Time.
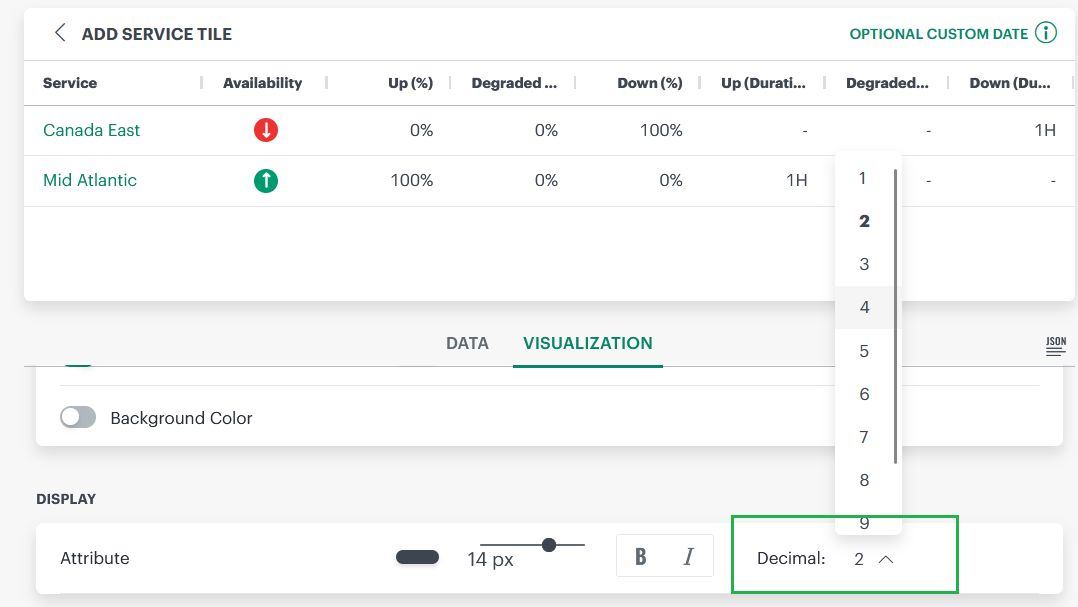
Added Ability to Configure Decimal Places to for Up Time (%) and Down Time (%) in Service Tile Enhancement
Users can now configure the decimal precision for the service tile for % Up Time and Down Time for the improved accuracy to show the right availability status.
Populate Metric Label Values on Filtered Metric Name Enhancement
Users will now see a filtering option for metric variables to fetch filters values for the variables.
Log Management
Log Alert Definitions Enhancement Enhancement
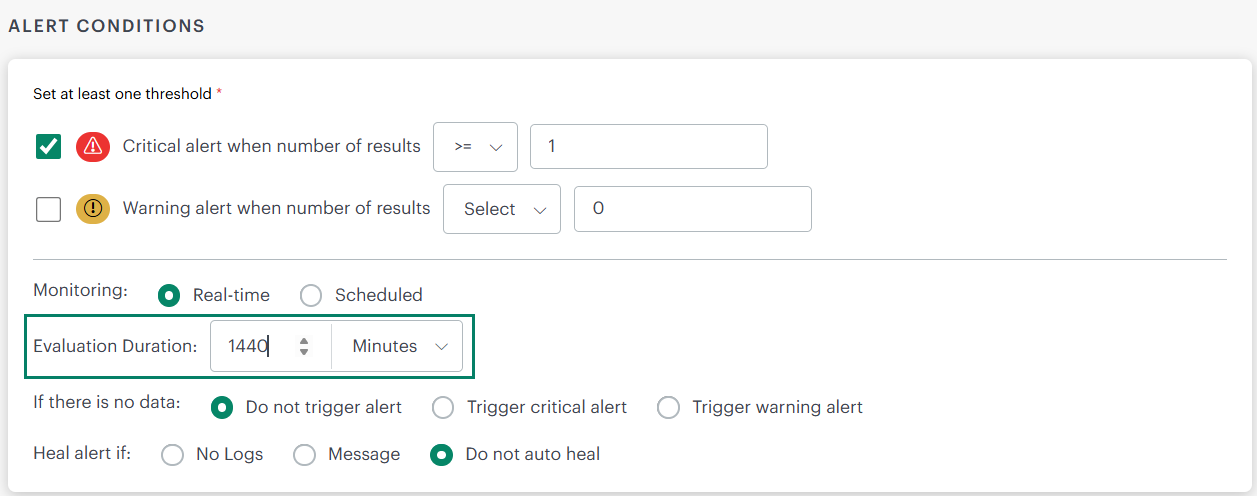
Earlier, the Evaluation Duration in OpsRamp’s Log Alert Definitions was limited to 30 minutes. This meant alerts could only be evaluated within short time windows, which caused repetitive triggers for long‑lived log events, Now, the Evaluation Duration in Log Alert Definitions has been extended from the maximum of 30 minutes to 1440 minutes (24 hours). This allows alerts to evaluate long‑lived log events such as password expiry notices, license expiration warnings, and certificate renewals without being restricted to short intervals.
Users can now configure alerts to evaluate at longer intervals, up to once per day, which reduces repetitive alerts for persistent log events; they can fine‑tune alert definitions to match event criticality and duration.
Elastic Stream Export Integration New Feature
The Elastic Stream Export is one of the exports that OpsRamp supports. This integration enables organizations to stream log data continuously from OpsRamp to Elasticsearch, index the data for efficient search, and analyze it through Kibana for visualization.
For more information, see Elastic Stream Export.
Service Management
Provide resourcetype attribute in ticket opsql Enhancement
Users will be able to filter for tickets created from Feb release onwards in ticket opsql using “resourceType” attribute.
Monitoring Management
SNMP Resource Type Definitions Moved to SNMP Integration Enhancement
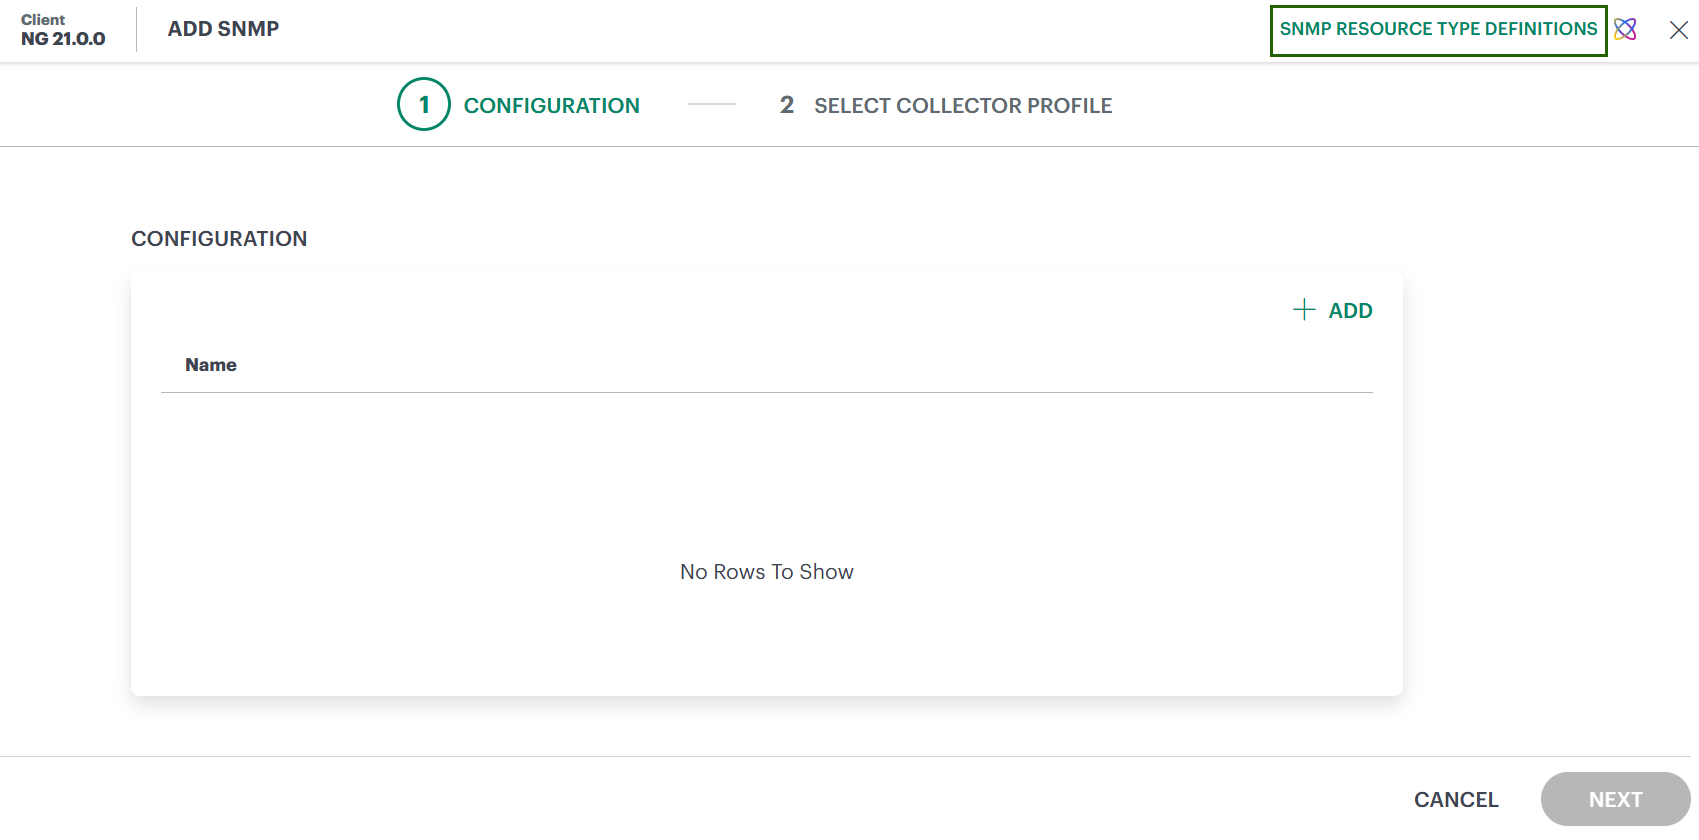
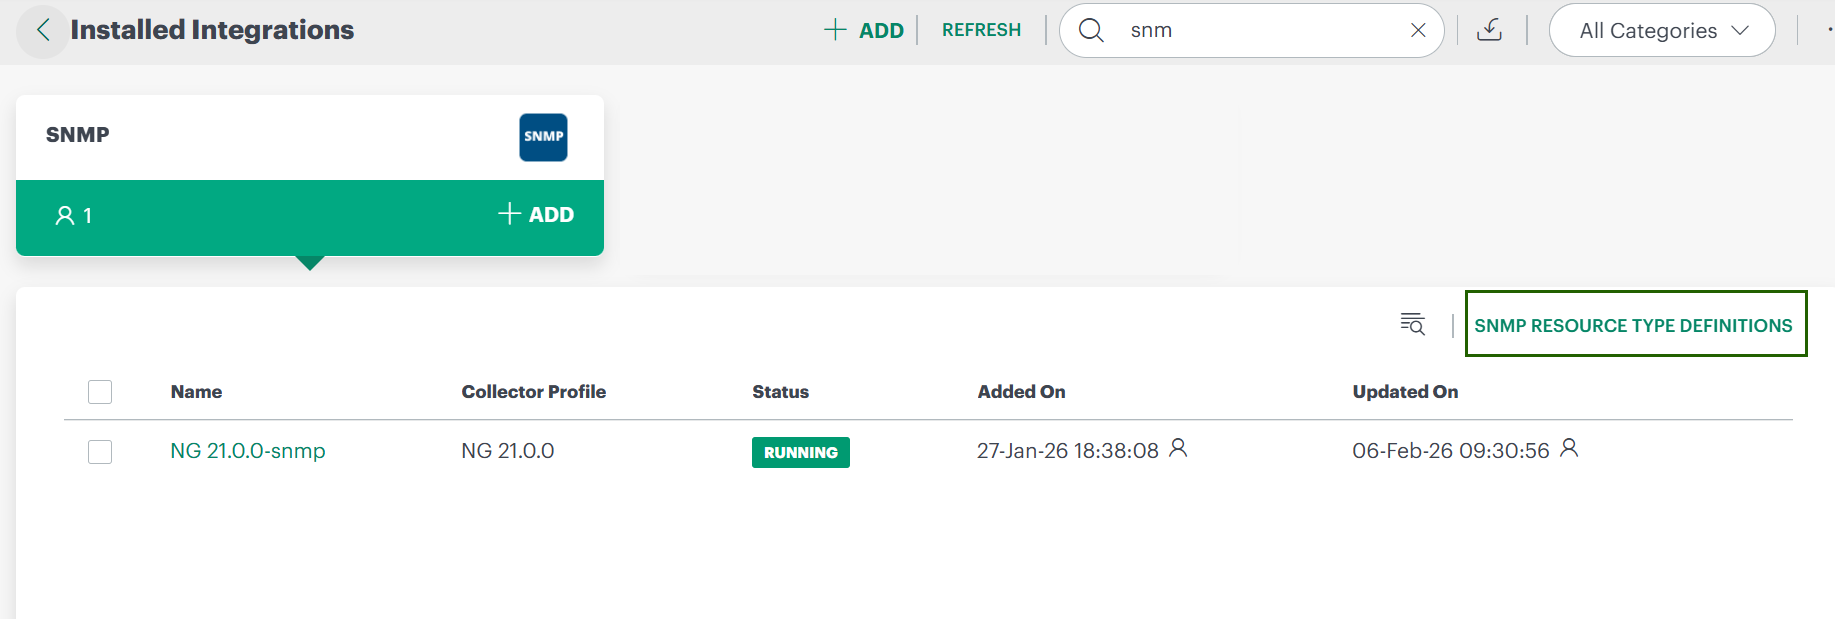
As part of the recent deprecation announcement, Deprecation of SNMP Resource Type Definition SNMP Resource Type Definitions are no longer available under Setup > Resources. They have been relocated to the SNMP Integration under Setup > Account > Integrations > SNMP.

You can now access SNMP Resource Type Definitions directly from the SNMP Integration in the following places:
- During SNMP integration setup: Use the link available while adding the SNMP integration (upper-right corner).
- After SNMP integration installation: On Installed Integrations, expand the SNMP Integration card to access the link.
Tracing
Trace Data Compression Enhancement
Earlier, trace data payloads were sent without compression. Now users can enable Snappy compression or ZSTD compression in ‘Tracing proxy’ configuration to send compressed trace data. Compressed payloads reduce transfer size while maintaining normal data flow of trace data in the portal. This enhancement ensures CPU and memory consumption remain stable during compression and return to minimal values when ingestion stops.
For more information, see Compression configuration.
Exports
Add additional filter to Streaming export integration Enhancement
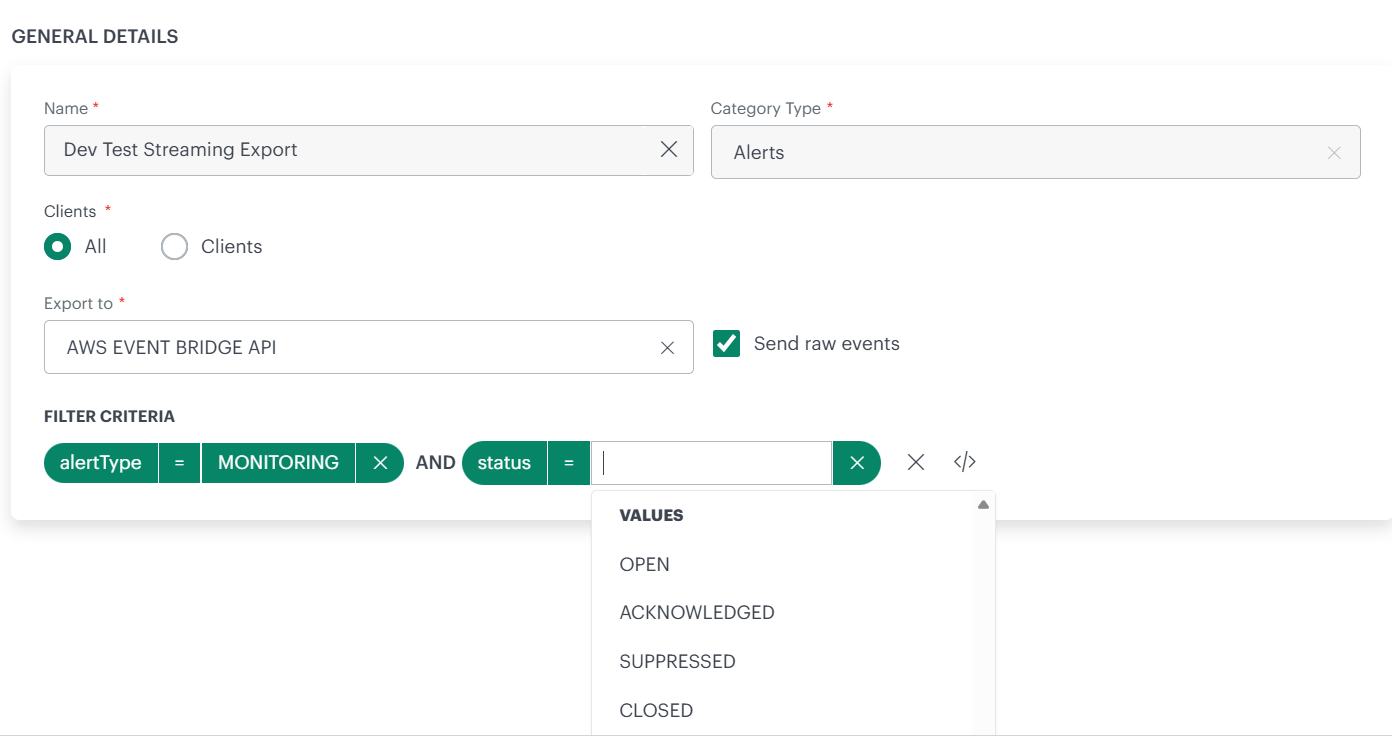
The Alert Streaming feature now allows users to filter alerts by “alert status” before streaming them to the target location.
Public Cloud
Cisco Meraki Integration - New Switch Model Support Enhancement
The Cisco Meraki integration now supports the C9200 switch model.
Impact:C9200 switches are now correctly discovered and classified, rather than appearing under the Other category. This update enables accurate model-specific classification and dedicated views within the integration.
Starlink Integration - API Migration Enhancement
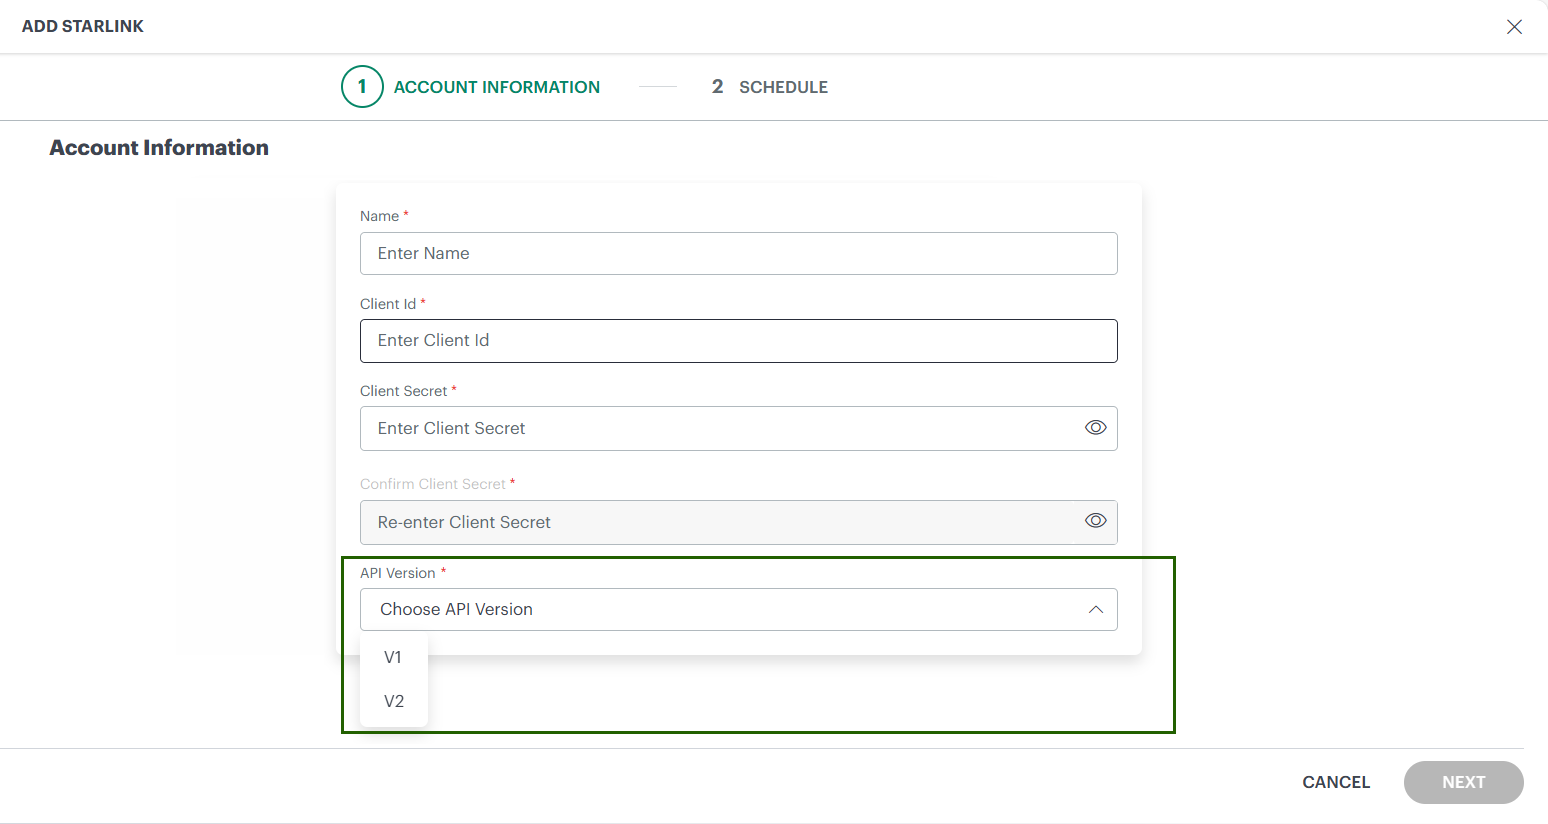
Starlink has introduced a new V2 API that replaces the existing V1 API and includes a revised authentication model. OpsRamp now supports both V1 and V2 APIs, enabling customers to migrate smoothly ahead of the V1 API deprecation on April 30, 2026.
What’s Changing:
- The V1 API uses user-based authentication, allowing a single integration to discover multiple Starlink accounts if the user has access.
- The V2 API uses service-account-based authentication, requiring a separate integration for each Starlink account with its own credentials.
- The V2 integration is treated as a new integration; historical data from V1 is not automatically retained.
Recommended Action:
- Identify the Starlink accounts you manage and plan to create separate V2 integrations for each account using service-account credentials.
- During integration setup, use the new dropdown to select either the Starlink V1 or V2 API during the transition period.
- To retain historical data for at least one account, update the existing integration with V2 credentials for the account with the largest inventory.
- Complete the migration to V2 before April 30, 2026, as Starlink V1 APIs will expire on this date and service disruption may occur if migration is not completed.
Service Maps
Consistent resource listing behavior Enhancement
In Service Maps, impacted resources are displayed in the impacted resources panel on the right side of the page.
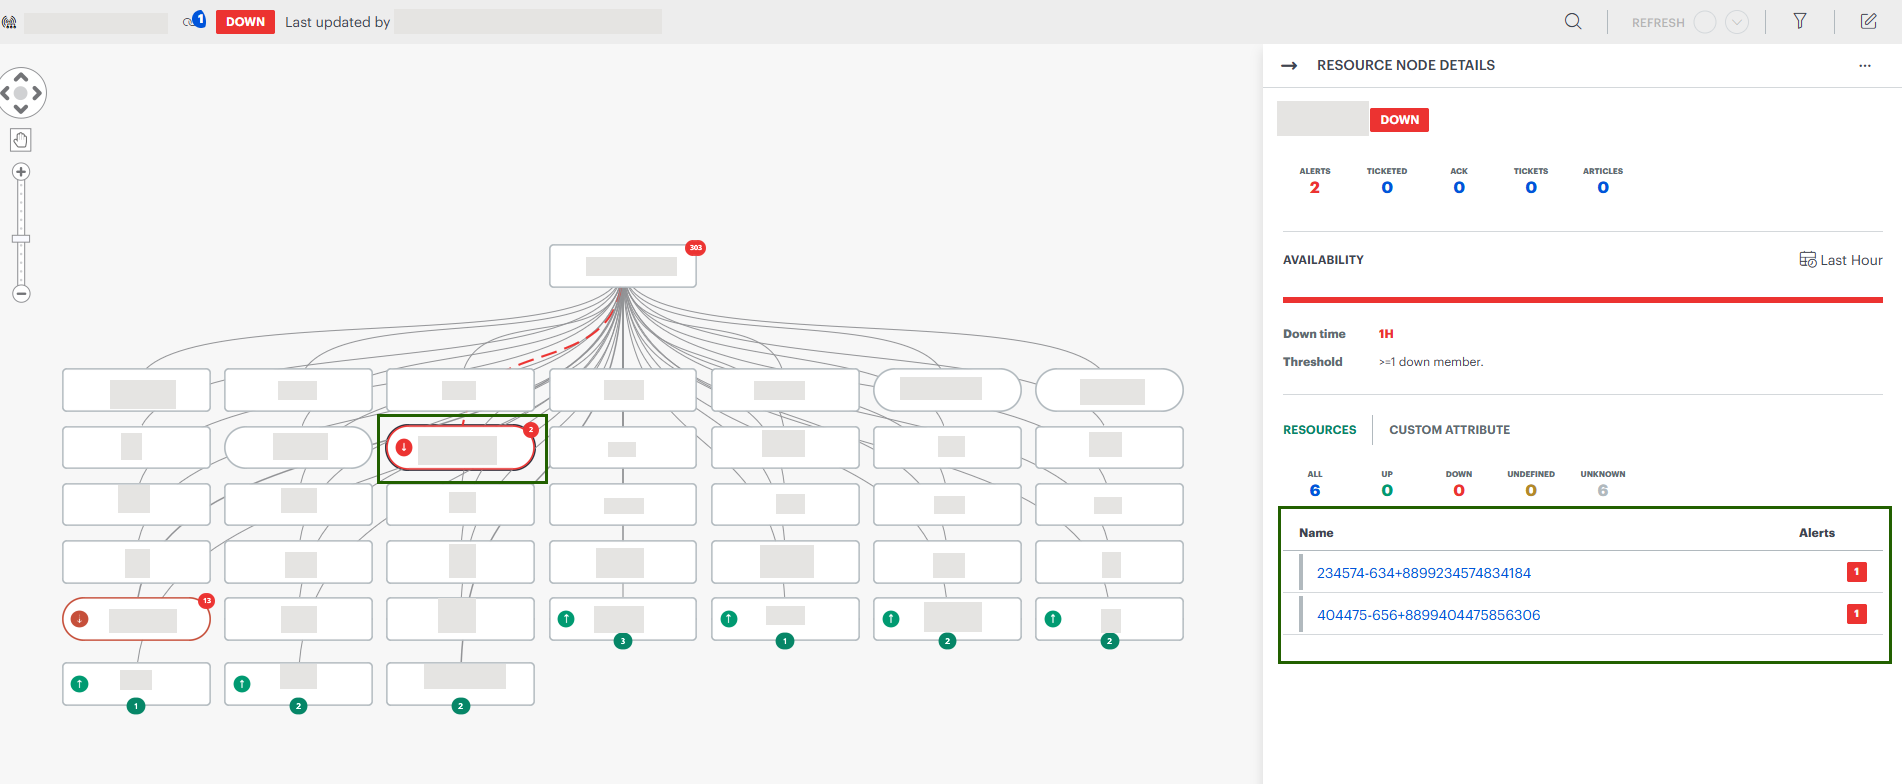
When a Service Map node is DOWN (service node or resource node), the panel shows:
- The total number of impacted resources
- A breakdown by availability stateThis allows you to quickly identify affected resources and take the necessary corrective action.
When a Service Map node is UP, the panel shows:
- The total number of resources
- A breakdown by availability state
- No impacting resources for the selected nodeIn both cases, click the resource count to open the detailed device listing in a new window.
Metrics Engine
Expanded Alerting Capacity Enhancement
Users can now configure up to 50 alert definitions per client, allowing broader and more granular monitoring across metrics, logs, and traces.
Kubernetes 2.0
Host Network Analysis
Host Network Analysis (formerly known as eBPF) is now generally available (GA) to all users. In this release, the beta flag has been removed, making the feature available by default.
Host Network Analysis is available under Infrastructure > Host Network Analysis. It provides deep, real‑time visibility into network traffic across Kubernetes 2.0 clusters, helping users analyze pod‑to‑pod and service‑level network behavior.
This capability is powered by eBPF and works with the Kubernetes 2.0 agent, enabling detailed insights into network traffic, latency, and communication patterns without additional configuration.
For more information, see Host Network Analytics documentation.