Features and Enhancements
Resource Management
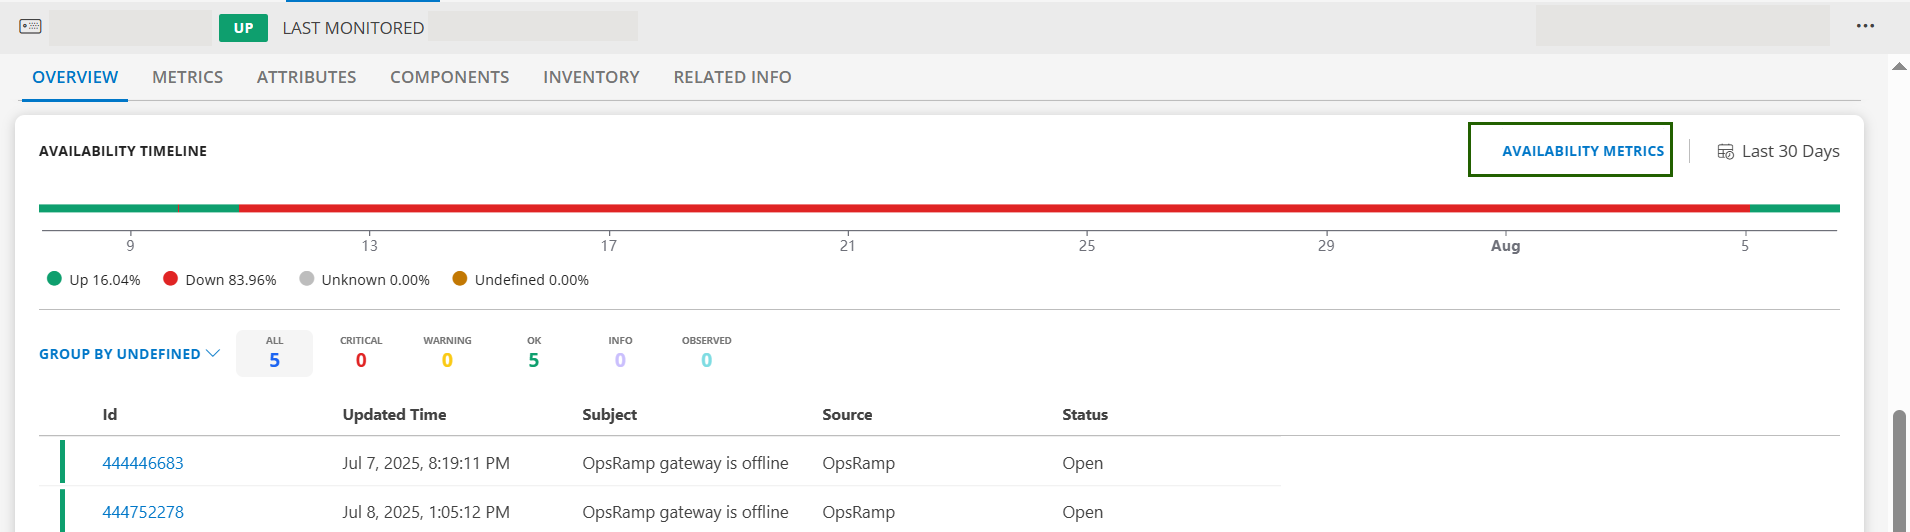
Availability Metrics Information in New Resource Page Enhancement
The Availability Metrics information from the legacy Resources page is now accessible on the new Resources page. To view these metrics, navigate to the Overview tab on the new Resources page and click the Availability Metrics button. The metrics will be displayed directly on the page for your convenience.
Tracing
Service 2.0 Improvements Enhancement
This release introduces several usability improvements across the Overview, Alerts, and Logs tabs to enhance visibility, consistency, and user interaction.
Overview Tab Added the operations banner from the Operations tab to the Overview tab to provide a comprehensive summary of service status and metrics in a single view.
Alerts Tab Enabled clickable tiles in the timeline graph that redirect users to Alerts Explorer with filters and timestamps pre-applied for immediate alert inspection.
Logs Tab
- Enabled interactive timeline tiles that launch Logs Explorer with relevant filters and timestamps for streamlined log analysis.
- Extended label filtering functionality to affect both the timeline and the listing data. Refined this behavior to ensure consistent and accurate filtering throughout the tab.
Reports
Availability Report by Time and Day Selection Enhancement
The Availability Details App now supports selecting specific hours (Included Hours) when viewing data for the Last Week or Last Month.
The new dropdown offers four options:
- 24 hours every day - Full-day analysis.
- Same time every day - Consistent hours across all days in a week.
- Same time every weekday - Ideal for regular business hours.
- Different times every day - Flexible hours for each day of the week.
This enhancement lets users focus on the most relevant time periods for their business, providing more accurate insights and improving operational decision-making.
Public Cloud
Enhanced Alibaba Cloud Support Enhancement
Enhanced Alibaba Cloud integration in OpsRamp delivers improved service coverage, regional compatibility, and platform resilience. Key updates include:
- SDK Upgrade: Migrated to Alibaba Cloud SDK V2 for better performance and long-term API compatibility.
- New Services Supported:
- ECI (Elastic Container Instance)
- CEN (Cloud Enterprise Network)
- ACK & ASK (Container Kubernetes Service)
- OSS (Object Storage Service)
- ALB (Application Load Balancer)
- Availability Zone Expansion: ECS monitoring now covers additional zones like
cn-shanghai-m, ensuring comprehensive visibility across all deployments.
Standardized SaaS Apps G2 Templates Enhancement
SaaS Applications G2 monitoring templates now follow the Meraki G2 structure for improved consistency and usability.
Key Enhancements:
- Single Monitor per Native Type - All related metrics are grouped under one monitor definition.
- Custom Alert Fields - Support for customizable alert subjects and descriptions.
See G2 templates list for more details.
Meraki Neighbour Discovery and Network Topology Mapping Enhancement
Enhanced Meraki integration now supports the discovery of neighboring devices using the Meraki Dashboard API and auto-populates network topology maps.
What’s New:
- Discovers and maps neighboring devices connected to Meraki hardware.
- Captures details including:
- Device ID, Name, Type
- Connected Port
- Neighbor MAC Address
- Auto-updates the topology view with relationship data.
- Firmware version of Meraki devices is now also captured.
Kubernetes 2.0 Agent
Deprecation of Kubelet and cAdvisor Infrastructure Metrics Collection
In the OpsRamp Kubernetes 2.0 Agent, infrastructure metrics collection from Kubelet and cAdvisor will no longer be supported with this release.
This change is part of our ongoing efforts to align with the Kubernetes best practices and enhancing the reliability and scalability of our monitoring capabilities.
- Any existing dashboards, alerts, or reports using Kubelet or cAdvisor infrastructure metrics will no longer receive new data after upgrading to Kubernetes 2.0.
- We recommend reviewing your monitoring configurations and transitioning to supported metrics sources (such as metrics from the Kubernetes API or node-level exporters) before upgrading.
Metrics Engine
Static Thresholds Now Support Negative Values Enhancement
You can now set negative values for both Warning and Critical ranges in static threshold alert definitions.
This enhancement provides greater flexibility for monitoring metrics where negative readings are relevant, such as temperature or power usage.
Upcoming Feature Deprecation
Deprecation of Legacy Scripts Feature
The legacy Scripts feature, previously available under Automation > Scripts, will be deprecated in August 2025. You can transition to the new Scripts v2, which remains accessible via Automation > Scripts v2. For further details, see H2-2024.