Dashboard
New Logs Tile Type in Dashboards New Feature
The Logs tile is now available in dashboards, providing powerful log filtering, visualization, and analysis capabilities.
Key features include:
- LogsQL Query Support – Build custom queries to refine logs and focus on relevant data.
- Group By Functionality – Categorize logs based on specific attributes to easily identify patterns and trends.
- Bar Visualization – View log data in a clear, graphical format for better insights.
- Enhanced Log Analysis – Improve visibility and streamline troubleshooting directly within dashboards. The new Logs tile provides users with:
- Faster Troubleshooting – Quickly filter and analyze logs using LogsQL queries, making it easier to identify and resolve issues without sifting through large amounts of data.
- Improved Data Organization – The Group By feature allows logs to be categorized based on key attributes, helping you spot patterns, trends, and anomalies at a glance.
- Greater Efficiency – Instead of manually searching through logs, you can build custom queries to display only relevant logs, saving time and effort.
- Enhanced Visibility – With log data integrated into dashboards, users get real-time insights into system events, performance, and errors, enabling proactive issue resolution.
Metric Unit Customization Enhancement
Introduced support for User-Defined Metric Units in the Metric Tile, ensuring that visualized Metric data displays with the relevant units.You can now append measurement units to metric values in the legend, making data interpretation clearer and more intuitive. This enhancement improves readability and provides better context for analytics.

Customizable Y-Axis Range for Metric Graphs Enhancement
This functionality allows you to define the lowest (minimum) and highest (maximum) values that the Y-axis will display on the Metric graph. By setting these values, you control the scale of the Y-axis, which can enhance data visualization within a specific range.

See Metric Tile for more information.
Improved Recurring Maintenance Window Display Enhancement
Scheduled maintenance tiles now provide clearer information through intuitive icons that indicate recurring maintenance window schedules. These icons display both the maintenance schedule details and their descriptions, enhancing clarity and ease of understanding.
![]()
Resource Management
Upgrading Notification User to Portal user or API user Enhancement
Support has been added for upgrading the Notification User access type to the Portal User and API User. This allows Notification Users to be promoted to Portal users, enabling them to log into the UI and access more advanced functionality. Depending on their specific needs, users can either interact directly with the platform through the portal or integrate with the system via the API.

See Promote Notification User to Portal/API User for more information.
Column Settings Search Enhancement Enhancement
The Column Settings search functionality has been enhanced to allow you to search both Custom Attributes and Resource Attributes simultaneously. The functionality allows you to:
- Add resource attribute and custom attribute column(s) to the resource listing screen as per your requirements.
- Display custom attribute(s) and their associated values for the resource(s) they are assigned to. You no longer need to dig through individual resources to view custom attributes and their values. Everything is displayed in one place.
- Search both Custom Attributes and Resource Attributes at the same time, making it easier to find the resources you are looking for.
- Make more informed decisions and better manage resources based on all available data, not just the default attributes.

See Customize columns for more information.
Reporting Apps
Hardware Details App New Feature
The Hardware Details App has been introduced in Reporting Apps to help users retrieve detailed hardware information for selected resources. This app generates reports in XLSX format, providing a structured view of key hardware attributes.

Alert Listings App Enhancement
The Alert Listings App now supports new configuration parameters:
- Alert By – Allows users to display alerts based on Created Time or Updated Time (defaults to Created Time if not specified).
- Analysis Period – Defines the analysis timeframe (Last 24 Hours, Last 7 Days, Last Month, Last 3 Months, or a Specific Period). If not selected, it defaults to Last 7 Days (-7d).
Ticket Details App Enhancement
The Ticket Details App now supports new configuration parameters:
- Ticket By – Allows users to display tickets based on Created Time, Closed Date, Updated Time, or Resolved Date (defaults to Created Time if not specified).
- Analysis Period – Defines the analysis timeframe (Last 24 Hours, Last 7 Days, Last Month, Last 3 Months, or a Specific Period). If not selected, it defaults to Last 7 Days (-7d).
Note
To improve performance and prevent API failures with large ticket volumes, theticket.conversationfield has been removed from the attribute’s selection.
Metrics Insight App Enhancement
To enhance the clarity and utility of the Metric Insight report, we have included specific units for each selected metric. This allows users to better understand the data presented and its implications. Each unit is clearly specified to ensure consistent interpretation and to facilitate a deeper analysis of the metrics involved.
Restrictions in Classic Reports Enhancement
Users can no longer create new on-demand or scheduled reports or modify any existing reports. However, previously scheduled reports will continue to run as per their set schedules, with notifications sent to designated users. Users can still view configurations and download existing reports as needed.
Event Management
Predefined Suppression Windows Enhancement
This functionality allows you to select predefined suppression windows while performing alert suppression actions.
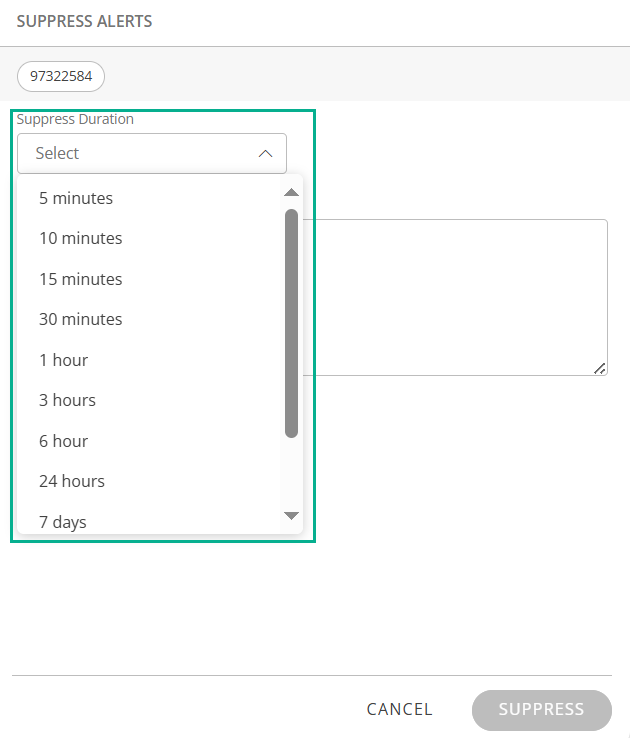
See Suppress an Alert for more information.
Public Cloud
Azure Integration: Support for New Services Enhancement
OpsRamp Azure Public Cloud Integration enables the discovery and metric collection for Azure Key Vault, Azure Websites, and their associated web jobs.This integration helps monitor Key Vaults and generates alerts when secrets are nearing expiration.
Support for EC2 Backup Events in AWS Accounts Enhancement
OpsRamp now supports AWS Backup events, generating critical alerts when a backup job state changes to FAILED, ABORTED, or EXPIRED. This applies to resource types such as DynamoDB, EBS, EC2, EFS, and Neptune.
Traces
Trace Spans to Resource Navigation Enhancement
Users can now directly navigate to the appropriate resource from the Trace span.
Note
Prerequisite: The Kubernetes 2.0 agent must be installed on the client.Trace Alert to Trace Explorer Navigation Enhancement
Users can navigate to the Trace Explorer during the time window when a trace alert is generated to obtain a detailed view of spans, which will aid in further troubleshooting.
Log Management
Navigation Between Resources and Logs Enhancement
Users can now easily navigate to the specific resource that generated a log, allowing for quick access to the right resource for further troubleshooting.
Note
Prerequisite: The Kubernetes 2.0 agent must be installed on the client.ORA Alerts Description Change Enhancement
Enhanced the log alert description by removing redundant information that is already provided as tags on the generated alert.
Network Topology Management (NTM)
Topology Nodes search enhancement Enhancement
The updated functionality dims non-relevant nodes during searches, making the search results more distinct and easier to identify.

Network Performance Management (NPM)
Enhanced custom metric dashboard Enhancement
The Custom Metric Dashboard now enables monitoring and alerting on the Top N records, eliminating the previous restriction of tracking only a specific source IP, port, or application. This enhancement allows customers to configure custom metrics using OpsQL queries to monitor multiple records dynamically.Additionally, the dashboard now displays the top N labels and allows users to configure alerts based on the top N records.
Updates in upcoming releases
Synthetics Template Standardization
Starting with the 04-U1 (April 2025) release, OpsRamp will update the synthetic template behavior to align with the alert threshold hierarchy used for other resources.
In OpsRamp, alerts for Generation 2 (G2) templates follow a defined hierarchy when evaluating thresholds:
Resource Component thresholds
Resource thresholds
Template Component thresholds
Template thresholds
When generating an alert, OpsRamp checks for thresholds in the order above, starting from Resource Component thresholds and moving down the list until it finds applicable thresholds.
Until the 03 U1 (March 2025) release, this model is applied to all resources except synthetic resources.
For Synthetics resources, when a template is assigned, OpsRamp automatically copies the Template Component level thresholds to the Resource Component level by default.
From 04-U1 (April 2025) OpsRamp will address this design gap. Synthetic resources will also follow the standard threshold hierarchy used for all other resources, removing this automatic copying behavior.
Impact on Existing Synthetic Resources After the April 2025 Release
If you have any template assigned to a Synthetics resource without customizations at the Resource Component level, OpsRamp will automatically apply the Template Component level thresholds. This may lead to new alerts for metrics if the assigned template includes Template Component level thresholds with alerting enabled.
Scenarios to Understand the Impact
Scenario 1: You Will Receive New Alerts
Example:
- Synthetic Resource: SR1
- Synthetic Template: ST1
- Metric Assigned: SM1
If you previously enabled Resource Component level thresholds for Metric SM1, but later deleted them, and if alerting is enabled at the Template Component level (ST1), you will receive new alerts. This will happen because OpsRamp will automatically apply the Template Component level thresholds as per hierarchy, which were previously absent at the Resource Component level.
Scenario 2: You Will Not Receive New Alerts
Example:
- Synthetic Resource: SR1
- Synthetic Template: ST1
- Metric Assigned: SM1
If you have disabled alerting at the Resource Component level for Metric SM1 but have alerting enabled at the Template Component level, you will not receive new alerts after the release. No action is required in this case.
How to Prevent New Alerts
If Scenario #1 applies to you and you wish to avoid receiving new alerts then you have to do any one of the following actions before April 2025 release:
Open the template and disable alerting at the Template Component level for the affected metric. This will prevent new alerts for that metric across the resources.
Open the Synthetics resource, navigate to the Resource Component level customization, and either:
- Create a Resource Component threshold for the metric, disabling alerting for it at the Resource Component level.
- Alternatively, if you have multiple resources and it’s challenging to set thresholds individually for each, you can clone the template and disable alerting at the Template Component levels.
- Create a Resource Component threshold for the metric, disabling alerting for it at the Resource Component level.
Contact OpsRamp support for the details about the impacted resources within your account and any futher