Agentless G2 - Windows OS Service Status - v4
Description
Monitors Windows services with regex support. Provide ServiceNames as comma-separated values, including regex patterns, using the following syntax: service_name1,service_name2,regexPattern1,regexPattern2. In this version, added dual Cmdlet Support (Get-WmiObject & Get-CimInstance) and excluded disabled services from monitoring.
Template Usage Guidelines:
- When assigning this template on the device, users need to pass specific input parameters. These parameters should be provided as one or more service names (not the service display names) or service name regex patterns.
- To provide multiple service names or service name regex patterns, separate them with commas.
SAMPLE CUSTOM SCRIPT ARGUMENTS
- Example 1 (With regex): ^opsramp,agent$,Power
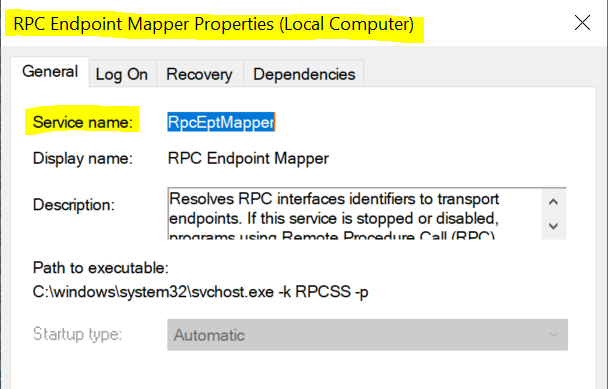
- Example 2 (Without Regex): Netlogon,Dnscache,RpcEptMapper
- Example 3: ^Dns|logon$,opsramp-agent,Power,,MsKeyboardFilter,SQL.*

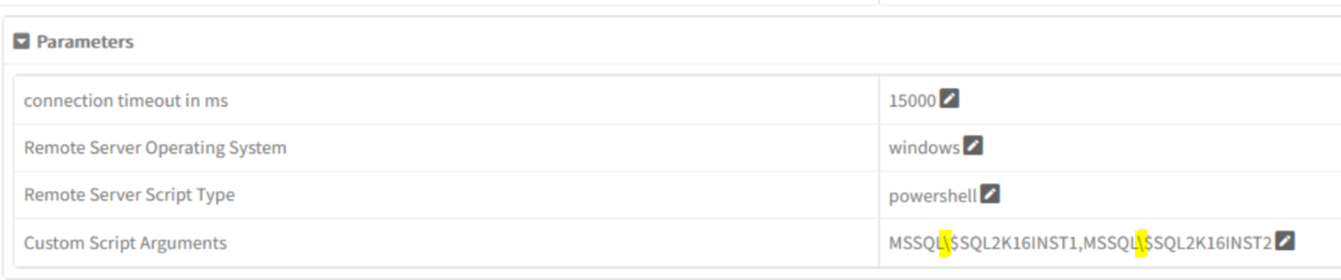
- If a service name includes a special character, such as $, add a backslash i.e., \ before the $ symbol, as shown in the following example:
- Example: MSSQL\$MSSQLSERVER01, MSSQL\$MSSQLSERVER02
Prerequisites
- Windows Gateway version 16.0.0 or later must support this template.
- The monitored device must run PowerShell version 3.0 or higher.
- Assign Windows credentials on the end device.
Supported Metric
| Monitor Name | Metric Name | Metric Display Name | Unit | Description |
|---|---|---|---|---|
| Agentless G2 - Windows OS Service Status - v4 | System_Windows_Service_Status_Ext | System Windows Service Status Ext | null | It gives the current status of the services by matching with the given service name(s) or regex patterns(s). Below are the possible values: Stopped - 0, Running - 1, Start Pending - 2, Stop Pending - 3, Continue Pending - 4, Pause Pending - 5, Paused - 6, Unknown - 7 |
Agentless G2 - Windows OS Service Status - v3
Description
In this version, we have excluded (Disabled mode) services from the monitoring. Additionally, enhanced PowerShell data collection mechanism by replacing deprecated cmdlets with modern alternatives for improved performance.
Template Usage Guidelines:
When assigning this template on the device, users need to pass specific input parameters. These parameters should be provided as one or more service names (not the service display names) or service name regex patterns.
To provide multiple service names or service name regex patterns, separate them with commas.
SAMPLE CUSTOM SCRIPT ARGUMENTSExample 1 (With regex): ^opsramp,agent$,Power
Example 2 (With regex): ^Dns|logon$,opsramp-agent,Power,,RemoteRegistry
Example 3 (Without Regex): Netlogon,Dnscache,RpcEptMapper
- If a service name includes a special character, such as $, add a backslash () before the $ symbol, as shown in the following example:Example: MSSQL$MSSQLSERVER01, MSSQL$MSSQLSERVER02

Prerequisites
- This template is supported on Windows Gateway version 16.0.0 and later.
- The monitored device must be running PowerShell version 3.0 or higher.
- Assign credentials of type Windows on the end device.
Supported Metric
| Monitor Name | Metric Name | Metric Display Name | Unit | Description |
|---|---|---|---|---|
| Agentless G2 - Windows OS Service Status - v3 | System_Windows_Service_Status_Ext | System Windows Service Status Ext | null | It gives the current status of the services by matching with the given service name(s) or regex patterns(s). Below are the possible values: Stopped - 0, Running - 1, Start Pending - 2, Stop Pending - 3, Continue Pending - 4, Pause Pending - 5, Paused - 6, Unknown - 7 |
Agentless G2 - Windows OS Service Status - v2
Description
Monitors Windows services with regex support. Provide ServiceNames as comma-separated values, including regex patterns, using the following syntax: service_name1,service_name2,regexPattern1,regexPattern2. Supported Version: This template works on Windows Gateway version 16.0.0 and above. The bug in the input parameters has been fixed in this version. It has been validated on Microsoft Windows 10 Enterprise and Microsoft Windows Server 2019 Standard.
Prerequisites
Works on Windows Gateway with version 16.0.0 and above.
Assign credentials of type Windows on the end device.
Template Usage Guidelines
While assigning the template on device, provide comma-separated service names(not service display names) or services regex patterns.
- Syntax: service name1,service name2,regexPattern1,regexPattern
- Examples:
- Input with regex: GoogleUpdater.*,opsramp,power
- Input without regex: opsramp-agent,sppsvc
Supported Metric
| Monitor Name | Metric Name | Metric Display Name | Unit | Description |
|---|---|---|---|---|
| Agentless G2 - Windows OS Service Status - v2 | System_Windows_Service_Status_Ext | System Windows Service Status Ext | % | It gives the current status of the services by matching with the given service name(s) or regex patterns(s). Below are the possible values: Stopped - 0, Running - 1, Start Pending - 2, Stop Pending - 3, Continue Pending - 4, Pause Pending - 5, Paused - 6, Unknown - 7. |
Agentless G2 - Windows OS Service Status
Note: This template has a bug at the monitor level. We recommend using the latest template (Agentless G2 - Windows OS Service Status - v2)
Description
Monitors Windows services with regex support. Provide ServiceNames with comma-separated values and regex support using the following syntax: service name1,service name2,regexPattern1,regexPattern2.
Prerequisites
- Works on Windows Gateway with version 16.0.0 and above.
- End device SSH credentials need to be added on end device itself.
Template Usage Guidelines:
While assigning the template on device, need to provide comma-separated service names and services regex patterns . Syntax: service name1,service name2,regexPattern1,regexPattern
Supported Metric
| Monitor Name | Metric Name | Metric Display Name | Unit | Description |
|---|---|---|---|---|
| Agentless G2 - Windows OS Service Status | System_Windows_Service_Status_Ext | System Windows Service Status Ext | Monitors the current status of the windows services that match with the given service name(s) or regex patterns(s). Below are the possible values: Stopped - 0,Running - 1,Start Pending - 2,Stop Pending - 3,Continue Pending - 4,Pause Pending - 5,Paused - 6,Unknown - 7 |
Agentless G2 - Linux OS Performance Monitoring - Advanced - v2
Description
Monitors the data related to OS resource parameters like Open FDs, Logged In users, Context Switches, Processes created, Running processes, Page Faults, Semaphores, Shared Memory IDs, Message queue IDs, TCP Connection states, Swap memory, Real memory Statistics and disk statistics.
Note: When the server is rebooted or when the disk counter’s valid range is exceeded, negative values for disk metrics will occur, as we are calculating rates. Version 2 template is redesigned for better reliability and maintainability with improved performance.
Prerequisites
- Ensure that the system has the
sscommand available to collect TCP connection data. - Ensure that it has util-linux version 2.19 or higher
- Ensure kernel version above 2.6 to collect disk-statistics data.
Supported Metric
| Monitor Name | Metric Name | Metric Display Name | Unit | Description |
|---|---|---|---|---|
| Agentless G2 - Linux Disk Statistics - v2 | system_linux_disk_IOQueueLength | System Linux Disk IOQueueLength | null | Monitors the length of the I/O queue for disk operations. |
| system_linux_disk_averageLatency | System Linux Disk AverageLatency | microsec | Monitors the average response time of the disk subsystem to process I/O requests. | |
| system_linux_disk_averageReadRequestSize | System Linux Disk AverageReadRequestSize | KB | Monitors the average size of read requests issued to the disk. | |
| system_linux_disk_averageRequestSize | System Linux Disk AverageRequestSize | KB | Monitors the average size of all read and write requests issued to the disk. | |
| system_linux_disk_averageWriteRequestSize | System Linux Disk AverageWriteRequestSize | KB | Monitors the average size of write requests issued to the disk. | |
| system_linux_disk_timeUtilization | System Linux Disk TimeUtilization | % | Monitors the utilization of the disk, measured as the percentage of time the disk is actively processing I/O operations. | |
| system_linux_disk_readOperationsRate | System Linux Disk ReadOperationsRate | psec | Monitors the rate of read operations issued to the disk per second. | |
| system_linux_disk_readThroughput | System Linux Disk ReadThroughput | KBps | Monitors the rate of data read from the disk per second. | |
| system_linux_disk_averageReadWaitTime | System Linux Disk AverageReadWaitTime | microsec | Monitors the average wait time for read requests. | |
| system_linux_disk_averageRequestWaitTime | System Linux Disk AverageRequestWaitTime | microsec | Monitors the time a disk operation (read and write) waits in the I/O queue before being processed. | |
| system_linux_disk_writeOperationsRate | System Linux Disk WriteOperationsRate | psec | Monitors the rate of write operations issued to the disk per second. | |
| system_linux_disk_writeThroughput | System Linux Disk WriteThroughput | KBps | Monitors the rate of data written to the disk per second. | |
| system_linux_disk_averageWriteWaitTime | System Linux Disk AverageWriteWaitTime | microsec | Monitors the average wait time for write requests. | |
| Agentless G2 - Linux Real Memory Statistics - v2 | system_linux_RealMemory_Scan_Rate | System Linux Real Memory Scan Rate | psec | Number of pages scanned (directly) per second. It will collect data for last 10 min (i.e time configured in /etc/cron.d/sysstat file). Prerequisite: sysstat package should be installed and sar -B command should respond. |
| system_linux_RealMemory_PageOuts_PagesPerSec | System Linux Real Memory PageOuts PagesPerSec | psec | Memory page out rate in pages per second. | |
| system_linux_RealMemory_PageOuts_KiloBytesPerSec | System Linux Real Memory PageOuts KiloBytesPerSec | KBps | Memory pages page out rate in Kilo Bytes per second. | |
| system_linux_RealMemory_SwapIns_KiloBytesPerSec | System Linux Real Memory SwapIns KiloBytesPerSec | KBps | Swap in rate in Kilo Bytes per second. | |
| system_linux_RealMemory_SwapOuts_KiloBytesPerSec | System Linux Real Memory SwapOuts KiloBytesPerSec | KBps | Swap out rate in Kilo Bytes per second. | |
| system_linux_RealMemory_PageIns_KiloBytesPerSec | System Linux Real Memory PageIns KiloBytesPerSec | KBps | Memory pages page in rate in Kilo Bytes per second. | |
| system_linux_RealMemory_PageIns_PagesPerSec | System Linux Real Memory PageIns PagesPerSec | psec | Memory pages page in rate in Pages per second. | |
| Agentless G2 - Linux Swap Memory Utilization | system_linux_swapMemory_Utilization | System Linux Swap Memory Utilization | % | Swap memory utilization in percent. |
| system_linux_individual_SwapArea_Utilization | System Linux Individual Swap Area Utilization | % | Individual swap area utilization in percent. | |
| Agentless G2 - Linux TCP Connection States | system_linux_tcp_connection_states | System Linux TCP Connection States | count | Monitors the count of TCP connections in various states on the Linux system. |
| Agentless G2 - Linux OS Resource Usage Statistics - v2 | system_linux_openFileDescriptors_Utilization | System Linux OpenFileDescriptors Utilization | % | Linux Open File Descriptors Used Percentage. |
| system_linux_openFileDescriptors_UsedCount | System Linux OpenFileDescriptors Used Count | count | Current number of Open File Descriptors. | |
| system_linux_loggedInUsers_Pct | System Linux Logged In Users Pct | % | Current number of logged in users percentage. | |
| system_linux_loggedInUsers_Count | System Linux LoggedInUsers Count | count | Current number of logged in users. | |
| system_linux_runningProcesses_Pct | System Linux Running Processes Pct | % | Current running processes percentage. | |
| system_linux_runningProcesses_Count | System Linux RunningProcesses Count | count | Current number of running processes. | |
| system_linux_Semaphores_Utilization | System Linux Semaphores Utilization | % | Semaphore arrays or sets used percentage. | |
| system_linux_Semaphores_UsedCount | System Linux Semaphores Used Count | count | Current number of semaphore arrays in use. | |
| system_linux_sharedMemoryIDs_Utilization | System Linux SharedMemoryIDs Utilization | % | Used percentage of shared memory IDs. | |
| system_linux_sharedMemoryIDs_UsedCount | System Linux SharedMemoryIDs Used Count | count | Current number of shared memory IDs in use. | |
| system_linux_messageQueueIDs_Utilization | System Linux MessageQueueIDs Utilization | % | Used percentage of current message queue IDs. | |
| system_linux_messageQueueIDs_UsedCount | System Linux MessageQueueIDs Used Count | count | Current number of message queue IDs in use. | |
| system_linux_kernelContextSwitchesPerSec | System Linux KernelContextSwitches PerSec | Count per sec | Monitors the count of context switches per second on the Linux system. | |
| system_linux_createdProcessesPerSec | System Linux CreatedProcesses PerSec | Count per sec | Provides the count of processes created or managed per second on the Linux system since the system was rebooted. | |
| system_linux_pageFaultsPerSec | System Linux PageFaults PerSec | Count per sec | Monitors the count of page faults per second on the Linux system. |
Agentless G2 - Linux OS Performance Monitoring - Advanced
Description
Monitors the data related to OS resource parameters like Open FDs, Logge In users, Context Switches, Processes created, Running processes, Page Faults, Semaphores, Shared Memory IDs, Message queue IDs, TCP Connection states, Swap memory, Real memory Statistics and disk statistics.
Note: When the server is rebooted or when the disk counters valid range is exceeded, negative values for disk metrics will occur, as we are calculating rates.
Prerequisites
- Ensure that the system has the
sscommand available to collect TCP connection data, and ensure that it has util‑linux version 2.19 or higher. - Ensure kernel version above 2.6 to collect disk‑statistics data.
Supported Metric
| Monitor Name | Metric Name | Metric Display Name | Unit | Description |
|---|---|---|---|---|
| Agentless G2 - Linux Disk Statistics | system_linux_disk_IOQueueLength | System Linux Disk IOQueueLength | null | Monitors the length of the I/O queue for disk operations. |
| system_linux_disk_averageLatency | System Linux Disk AverageLatency | microsec | Monitors the average response time of the disk subsystem to process I/O requests. | |
| system_linux_disk_averageReadRequestSize | System Linux Disk AverageReadRequestSize | KB | Monitors the average size of read requests issued to the disk. | |
| system_linux_disk_averageRequestSize | System Linux Disk AverageRequestSize | KB | Monitors the average size of all read and write requests issued to the disk. | |
| system_linux_disk_averageWriteRequestSize | System Linux Disk AverageWriteRequestSize | KB | Monitors the average size of write requests issued to the disk. | |
| system_linux_disk_timeUtilization | System Linux Disk TimeUtilization | % | Monitors the utilization of the disk, measured as the percentage of time the disk is actively processing I/O operations. | |
| system_linux_disk_readOperationsRate | System Linux Disk ReadOperationsRate | psec | Monitors the rate of read operations issued to the disk per second. | |
| system_linux_disk_readThroughput | System Linux Disk ReadThroughput | KBps | Monitors the rate of data read from the disk per second. | |
| system_linux_disk_averageReadWaitTime | System Linux Disk AverageReadWaitTime | microsec | Monitors the average wait time for read requests. | |
| system_linux_disk_averageRequestWaitTime | System Linux Disk AverageRequestWaitTime | microsec | Monitors the time a disk operation (read and write) waits in the I/O queue before being processed. | |
| system_linux_disk_writeOperationsRate | System Linux Disk WriteOperationsRate | psec | Monitors the rate of write operations issued to the disk per second. | |
| system_linux_disk_writeThroughput | System Linux Disk WriteThroughput | KBps | Monitors the rate of data written to the disk per second. | |
| system_linux_disk_averageWriteWaitTime | System Linux Disk AverageWriteWaitTime | microsec | Monitors the average wait time for write requests. | |
| Agentless G2 - Linux Real Memory Statistics | system_linux_RealMemory_Scan_Rate | System Linux Real Memory Scan Rate | psec | Number of pages scanned (directly) per second. It will collect data for last 10 min (i.e time configured in /etc/cron.d/sysstat file). Prerequisite: sysstat package should be installed and sar -B command should respond |
| system_linux_RealMemory_PageOuts_PagesPerSec | System Linux Real Memory PageOuts PagesPerSec | psec | Memory page out rate in pages per second. | |
| system_linux_RealMemory_PageOuts_KiloBytesPerSec | System Linux Real Memory PageOuts KiloBytesPerSec | KBps | Memory pages page out rate in Kilo Bytes per second. | |
| system_linux_RealMemory_SwapIns_KiloBytesPerSec | System Linux Real Memory SwapIns KiloBytesPerSec | KBps | Swap in rate in Kilo Bytes per second. | |
| system_linux_RealMemory_SwapOuts_KiloBytesPerSec | System Linux Real Memory SwapOuts KiloBytesPerSec | KBps | Swap out rate in Kilo Bytes per second. | |
| system_linux_RealMemory_PageIns_KiloBytesPerSec | System Linux Real Memory PageIns KiloBytesPerSec | KBps | Memory pages page in rate in Kilo Bytes per second. | |
| system_linux_RealMemory_PageIns_PagesPerSec | System Linux Real Memory PageIns PagesPerSec | psec | Memory pages page in rate in Pages per second. | |
| Agentless G2 - Linux Swap Memory Utilization | system_linux_swapMemory_Utilization | System Linux Swap Memory Utilization | % | Swap memory utilization in percent. |
| system_linux_individual_SwapArea_Utilization | System Linux Individual Swap Area Utilization | % | Individual swap area utilization in percent. | |
| Agentless G2 - Linux TCP Connection States | system_linux_tcp_connection_states | System Linux TCP Connection States | count | Monitors the count of TCP connections in various states on the Linux system. |
| Agentless G2 - Linux OS Resource Usage Statistics | system_linux_openFileDescriptors_Utilization | System Linux OpenFileDescriptors Utilization | % | Linux Open File Descriptors Used Percentage |
| system_linux_openFileDescriptors_UsedCount | System Linux OpenFileDescriptors Used Count | count | Current number of Open File Descriptors | |
| system_linux_loggedInUsers_Pct | System Linux Logged In Users Pct | % | Current number of logged in users percentage | |
| system_linux_loggedInUsers_Count | System Linux LoggedInUsers Count | count | Current number of logged in users | |
| system_linux_runningProcesses_Pct | System Linux Running Processes Pct | % | Current running processes percentage | |
| system_linux_runningProcesses_Count | System Linux RunningProcesses Count | count | Current number of running processes | |
| system_linux_Semaphores_Utilization | System Linux Semaphores Utilization | % | Semaphore arrays or sets used percentage | |
| system_linux_Semaphores_UsedCount | System Linux Semaphores Used Count | count | Current number of semaphore arrays in use | |
| system_linux_sharedMemoryIDs_Utilization | System Linux SharedMemoryIDs Utilization | % | Used percentage of shared memory ID's | |
| system_linux_sharedMemoryIDs_UsedCount | System Linux SharedMemoryIDs Used Count | count | Current number of shared memory ID?s in use | |
| system_linux_messageQueueIDs_Utilization | System Linux MessageQueueIDs Utilization | % | Used percentage of current message queue ID's | |
| system_linux_messageQueueIDs_UsedCount | System Linux MessageQueueIDs Used Count | count | Current number of message queue ID?s in use | |
| system_linux_kernelContextSwitchesPerSec | System Linux KernelContextSwitches PerSec | Count per sec | Monitors the count of context switches per second on the Linux system. | |
| system_linux_createdProcessesPerSec | System Linux CreatedProcesses PerSec | Count per sec | Provides the count of processes created or managed per second on the Linux system since the system was rebooted. | |
| system_linux_pageFaultsPerSec | System Linux PageFaults PerSec | Count per sec | Monitors the count of page faults per second on the Linux system. |
Array Networks
Description
Template to monitor the array networks metrics like memory utilization,CPU utilization,CPU temperature,Fan speed,powersupply state,health status,health connection failures,cache status,VIP status.
Prerequisites
NULL
Supported Metric
| Monitor Name | Metric Name | Metric Display Name | Unit | Description |
|---|---|---|---|---|
| Array Networks Powersupply Status | array_networks_PowersupplyState | Array Networks Powersupply State | Monitors the array networks powersupply state.[CA-SNMP-MIB8::powerstate:1.3.6.1.4.1.7564.32.3.0] | |
| Array Networks Health Monitoring | array_networks_HealthConnectionFailures | Array Networks Health Connection Failures | count | Monitors the Array Networks Health Connection Failures.[CA-SNMP-MIB8::hcConnFail:1.3.6.1.4.1.7564.27.1.2.1.11] |
| array_networks_HealthStatus | Array Networks Health Status | Monitors the array networks health status.[CA-SNMP-MIB8::hcStatus:1.3.6.1.4.1.7564.27.1.2.1.5,hcConnFail:1.3.6.1.4.1.7564.27.1.2.1.11] | ||
| Array Networks Performance Monitoring | array_networks_MemoryUtilization | Array Networks Memory Utilization | % | Monitors the array networks memory utilization.[CA-SNMP-MIB8::sysMemoryUtilization:1.3.6.1.4.1.7564.4.2.0] |
| array_networks_CPU_Utilization | Array Networks CPU Utilization | % | Monitors the array networks CPU utilization.[CA-SNMP-MIB8::cpuUtilization:1.3.6.1.4.1.7564.30.1.0] | |
| Array Networks Fan and Temperature - EXT | array_networks_Temperature | Array Networks Temperature | Celsius | Monitors the array networks system andCPU temperature.[CA-SNMP-MIB8::cputemp:1.3.6.1.4.1.7564.32.1.0] |
| array_networks_FanSpeed | Array Networks Fan Speed | rpm | Monitors the array networks fan speed.[CA-SNMP-MIB8::fanspeed:1.3.6.1.4.1.7564.32.2.0] | |
| Array Networks Cache and VIP Status | array_networks_VIP_Status | Array Networks VIP Status | Monitors the array networks VIP status.[CA-SNMP-MIB8::vipStatus:1.3.6.1.4.1.7564.22.1.0] | |
| array_networks_CacheStatus | Array Networks Cache Status | Monitors the array networks cache status.[CA-SNMP-MIB8::cacheStatus:1.3.6.1.4.1.7564.16.1.1.0,] |
AudioCodes Control Element Performance
Description
Template for AudioCodes control elements performance monitoring. It monitors Media Realm Packet Jitter,Media Realm Packet Delay,Media Realm Bytes Transmitted,Media Realm Bytes Received,Media Realm MOS(Mean Opinion Score),Media Realm Packet Loss Received,Media Realm Packet Loss Transmitted,SIP Atttempted Calls,SIP Call Duration,SIP Total Call Duration,SIP Failed Calls,SIP Success Fax Calls,SIP Trunk Group Utilization,SIP Trunk Group Utilization Percentage. Validated on Mediant 3000. SysObjid : 1.3.6.1.4.1.5003.8.1.1.49.
Prerequisites
The device should have support for AC-PM-Control-MIB.
Supported Metric
| Monitor Name | Metric Name | Metric Display Name | Unit | Description |
|---|---|---|---|---|
| AudioCodes - SIP Trunk Group Utilization Percentage | ac.pm.sip.trunk.group.utilization.percent | SIP Trunk Group Utilization Percentage | It monitors the AudioCodes SIP trunk group utilization percentage.[AC-PM-Control-MIB::acPMSIPTrunkGroupPercentageUtilizationVal:1.3.6.1.4.1.5003.10.8.2.52.27.1.3]. | |
| AudioCodes - SIP Trunk Group Utilization | ac.pm.sip.trunk.group.utilization | SIP Trunk Group Utilization | It monitors the AudioCodes SIP trunk group utilization.[AC-PM-Control-MIB::acPMSIPTrunkGroupUtilizationVal:1.3.6.1.4.1.5003.10.8.2.52.26.1.3]. | |
| AudioCodes - SIP Success Fax Calls | ac.pm.sip.success.fax.calls | SIP Success Fax Calls | It monitors the AudioCodes SIP success fax calls.[AC-PM-Control-MIB::acPMSIPFaxSuccessCallsVal:1.3.6.1.4.1.5003.10.8.2.52.10.1.3]. | |
| AudioCodes - SIP Failed Calls | ac.pm.sip.failed.calls | SIP Failed Calls | It monitors the AudioCodes SIP failed calls.[AC-PM-Control-MIB::acPMSIPFailCallsVal:1.3.6.1.4.1.5003.10.8.2.52.7.1.3]. | |
| AudioCodes - SIP Call Duration | ac.pm.sip.call.duration | SIP Call Duration | It monitors the AudioCodes SIP call duration.[AC-PM-Control-MIB::acPMSIPCallDurationVal:1.3.6.1.4.1.5003.10.8.2.52.2.1.3]. | |
| ac.pm.sip.total.call.duration | SIP Total Call Duration | It monitors the AudioCodes SIP total call duration.[AC-PM-Control-MIB::acPMSIPCallDurationTotal:1.3.6.1.4.1.5003.10.8.2.52.2.1.12]. | ||
| AudioCodes - SIP Atttempted Calls | ac.pm.sip.attempted.calls | SIP Attempted Calls | It monitors the AudioCodes SIP attempted calls.[AC-PM-Control-MIB::acPMSIPAttemptedCallsVal:1.3.6.1.4.1.5003.10.8.2.52.1.1.3]. | |
| AudioCodes - Media Realm Packet Loss Transmitted | ac.pm.media.realm.packet.loss.tx | Media Realm Packet Loss Transmitted | It monitors the AudioCodes media realm packet loss transmitted.[AC-PM-Control-MIB::acPMMediaRealmPacketLossTxVal:1.3.6.1.4.1.5003.10.8.2.53.11.1.3]. | |
| AudioCodes - Media Realm Packet Loss Received | ac.pm.media.realm.packet.loss.rx | Media Realm Packet Loss Received | It monitors the AudioCodes media realm packet loss received.[AC-PM-Control-MIB::acPMMediaRealmPacketLossRxVal:1.3.6.1.4.1.5003.10.8.2.53.10.1.3]. | |
| AudioCodes - Media Realm Packet Jitter | ac.pm.media.realm.packet.jitter | Media Realm Packet Jitter | It monitors the AudioCodes media realm packet jitter.[AC-PM-Control-MIB::acPMMediaRealmVERealmPacketJitterVal:1.3.6.1.4.1.5003.10.8.2.53.6.1.3] | |
| AudioCodes - Media Realm Packet Delay | ac.pm.media.realm.packet.delay | Media Realm Packet Delay | It monitors AudioCodes media realm packet delay.[AC-PM-Control-MIB::acPMMediaRealmVERealmPacketDelayVal:1.3.6.1.4.1.5003.10.8.2.53.5.1.3]. | |
| AudioCodes - Media Realm MOS(Mean Opinion Score) | ac.pm.media.realm.mos | Media Realm MOS(Mean Opinion Score) | It monitors the AudioCodes media realm MOS(Mean Opinion Score).[AC-PM-Control-MIB::acPMMediaRealmRealmMOSVal:1.3.6.1.4.1.5003.10.8.2.53.7.1.3]. | |
| AudioCodes - Media Realm Bytes Transmitted | ac.pm.media.realm.bytes.tx | Media Realm Bytes Transmitted | Bps | It monitors the AudioCodes media realm bytes transmitted.[AC-PM-Control-MIB::acPMMediaRealmBytesTxVal:1.3.6.1.4.1.5003.10.8.2.53.1.1.3]. |
| AudioCodes - Media Realm Bytes Received | ac.pm.media.realm.bytes.rx | Media Realm Bytes Received | Bps | It monitors the AudioCodes media realm bytes received.[AC-PM-Control-MIB::acPMMediaRealmBytesRxVal:1.3.6.1.4.1.5003.10.8.2.53.2.1.3]. |
APC Netbotz 75x Security and Environmental Monitoring
Description
Monitors the APC NetBotz sensors like Temperature Sensor, Vibration Sensor, Voltage Sensor, Smoke Sensor, Rssi Sensor, Rack Handle Sensor, Other State Sensor, Output Relay Sensor, Leak Sensor, Humidity Sensor, Dry Contact Sensor, Door Switch Sensor, Switched Outlet, Other Port Status, Camera Connection, Beacon, Door Lock Sensor, DewPoint Sensor, Current Input Sensor, Camera Motion Sensor, Battery Sensor, AmpDetect Sensor , AirFlow Sensor and Other Numeric Sensor.
Prerequisites
Device must have support for NetBotz50-MIB.
Supported Metric
| Monitor Name | Metric Name | Metric Display Name | Unit | Description |
|---|---|---|---|---|
| APC NetBotz Temperature Sensor - Error Status and Value | apc_netbotz5_temperature_sensor_ErrorStatus | Apc NetBotz5 Temperature Sensor Error Status | Monitors the error status of the temperature sensor. Possible values: normal(0), info(1), warning(2), error(3), critical(4), failure(5). | |
| APC NetBotz Humidity Sensor - Error Status and Value | apc_netbotz5_humidity_sensor_Value | Apc NetBotz5 Humidity Sensor Value | % | Monitors the relative humidity measured by the sensor in percent. |
| APC NetBotz Battery Sensor - Error Status and Value | apc_netbotz5_battery_sensor_value_Volts | Apc NetBotz5 Battery Sensor Value | v | Monitors the value measured by the battery sensor. |
| APC NetBotz Other State Sensor - Error Status | apc_netbotz5_otherstate_sensor_ErrorStatus | Apc NetBotz5 Other State Sensor Error Status | Monitors the operational status of the other state sensor. Possible values: normal(0), info(1), warning(2), error(3), critical(4), failure(5). | |
| APC NetBotz Smoke Sensor - Error Status and Value | apc_netbotz5_smoke_sensor_ErrorStatus | Apc NetBotz5 Smoke Sensor Error Status | Monitors the operational status of the smoke sensor. Possible values: normal(0), info(1), warning(2), error(3), critical(4), failure(5). | |
| APC NetBotz AirFlow Sensor - Error Status and Value | apc_netbotz5_airflow_sensor_value_MetersPerMinute | Apc NetBotz5 AirFlow Sensor Value | Monitors the air flow measured by the sensor in meters per minute. | |
| APC NetBotz Other Numeric Sensor - Error Status and Value | apc_netbotz5_othernumeric_sensor_ErrorStatus | Apc NetBotz5 Other Numeric Sensor Error Status | Monitors the operational status of the other numeric sensor. Possible values: normal(0), info(1), warning(2), error(3), critical(4), failure(5). | |
| APC NetBotz Current Input Sensor - Error Status and Value | apc_netbotz5_currentinput_sensor_ErrorStatus | Apc NetBotz5 Current Input Sensor Error Status | Monitors the operational status of the current input sensor. Possible values: normal(0), info(1), warning(2), error(3), critical(4), failure(5). | |
| APC NetBotz Leak Sensor - Error Status and Value | apc_netbotz5_leak_sensor_Value | Apc NetBotz5 Leak Sensor Value | Monitors whether a leak is detected. Possible values: undefined(-1), noLeak(0), leakDetected(1). | |
| APC NetBotz Dry Contact Sensor - Error Status and Value | apc_netbotz5_drycontact_sensor_Value | Apc NetBotz5 Dry Contact Sensor Value | Monitors whether the dry sensor contact is open or closed. Possible values: undefined(-1), open(0), closed(1). | |
| APC NetBotz Current Input Sensor - Error Status and Value | apc_netbotz5_currentinput_sensor_Value | Apc NetBotz5 Current Input Sensor Value | mA | Monitors the value measured by the current input sensor. |
| APC NetBotz Rack Handle Sensor - Error Status and Value | apc_netbotz5_rackhandle_sensor_Value | Apc NetBotz5 Rack Handle Sensor Value | Monitors the open or closed status of the rack handle sensor door. Possible values: undefined(-1), open(0), closed(1). | |
| APC NetBotz Rssi Sensor - Error Status and Value | apc_netbotz5_rssi_sensor_Value | Apc NetBotz5 Rssi Sensor Value | % | Monitors the value measured by the RSSI sensor. |
| APC NetBotz Output Relay Sensor - Error Status and Value | apc_netbotz5_outputrelay_sensor_ErrorStatus | Apc NetBotz5 Output Relay Sensor Error Status | Monitors the operational status of the output relay sensor. Possible values: normal(0), info(1), warning(2), error(3), critical(4), failure(5). | |
| APC NetBotz Beacon - Error Status and Value | apc_netbotz5_beacon_Value | Apc NetBotz5 Beacon Value | Monitors whether the beacon is flashing. Possible values: undefined(-1), off(0), on(1). | |
| APC NetBotz Voltage Sensor - Error Status and Value | apc_netbotz5_voltage_sensor_Value | Apc NetBotz5 Voltage Sensor Value | v | Monitors the value measured by the voltage sensor. |
| APC NetBotz Door Switch Sensor - Error Status and Value | apc_netbotz5_doorswitch_sensor_ErrorStatus | Apc NetBotz5 Door Switch Sensor Error Status | Monitors the operational status of the doorswitch sensor. Possible values: normal(0), info(1), warning(2), error(3), critical(4), failure(5). | |
| APC NetBotz Camera Connection And Error Status | apc_netbotz5_camera_connection_status | Apc NetBotz5 Camera Connection Status | Monitors the operational status of the camera. Possible values: disconnected(0), error(1), normal(2). | |
| APC NetBotz Temperature Sensor - Error Status and Value | apc_netbotz5_temperature_sensor_value_Farenheit | Apc NetBotz5 Temperature Sensor Value Farenheit | F | Monitors the temperature measured by the sensor in degree Farenheit. |
| APC NetBotz Beacon - Error Status and Value | apc_netbotz5_beacon_ErrorStatus | Apc NetBotz5 Beacon Error Status | Monitors the operational status of the beacon. Possible values: normal(0), info(1), warning(2), error(3), critical(4), failure(5). | |
| APC NetBotz Camera Connection And Error Status | apc_netbotz5_camera_error_status | Apc NetBotz5 Camera Error Status | Monitors the error status of the camera. Possible values: normal(0), info(1), warning(2), error(3), critical(4), failure(5). | |
| APC NetBotz AirFlow Sensor - Error Status and Value | apc_netbotz5_airflow_sensor_ErrorStatus | Apc NetBotz5 AirFlow Sensor Error Status | Monitors the error status of the airflow sensor. Possible values: normal(0), info(1), warning(2), error(3), critical(4), failure(5). | |
| APC NetBotz Humidity Sensor - Error Status and Value | apc_netbotz5_humidity_sensor_ErrorStatus | Apc NetBotz5 Humidity Sensor Error Status | Monitors the error status of the humidity sensor. Possible values: normal(0), info(1), warning(2), error(3), critical(4), failure(5). | |
| APC NetBotz Battery Sensor - Error Status and Value | apc_netbotz5_battery_sensor_ErrorStatus | Apc NetBotz5 Battery Sensor Error Status | Monitors the operational status of the battery sensor. Possible values: normal(0), info(1), warning(2), error(3), critical(4), failure(5). | |
| APC NetBotz DewPoint Sensor - Error Status and Value | apc_netbotz5_dewpoint_sensor_Value | Apc NetBotz5 DewPoint Sensor Value | F | Monitors the dew point reading in degrees Fahrenheit, measured by the sensor. |
| APC NetBotz Temperature Sensor - Error Status and Value | apc_netbotz5_temperature_sensor_value_Celsius | Apc NetBotz5 Temperature Sensor Value Celsius | Celsius | Monitors the temperature measured by the sensor in degree Celsius. |
| APC NetBotz Door Lock Sensor - Error Status and Value | apc_netbotz5_doorlock_sensor_Value | Apc NetBotz5 Door lock Sensor Value | Monitors whether door is unlocked(0) or locked(1). Possible values: undefined(-1), unlocked(0), locked(1). | |
| APC NetBotz Voltage Sensor - Error Status and Value | apc_netbotz5_voltage_sensor_ErrorStatus | Apc NetBotz5 Voltage Sensor Error Status | Monitors the operational status of the voltage sensor. Possible values: normal(0), info(1), warning(2), error(3), critical(4), failure(5). | |
| APC NetBotz Camera Motion Sensor - Error Status and Value | apc_netbotz5_cameramotion_sensor_Value | Apc NetBotz5 Camera Motion Sensor Value | Monitors whether motion is detected by the camera sensor. Possible values: undefined(-1), noMotion(0), motionDetected(1). | |
| APC NetBotz AmpDetect Sensor - Error Status and Value | apc_netbotz5_ampdetect_sensor_ErrorStatus | Apc NetBotz5 AmpDetect Sensor Error Status | Monitors the operational status of the ampdetect sensor. Possible values: normal(0), info(1), warning(2), error(3), critical(4), failure(5). | |
| apc_netbotz5_ampdetect_sensor_Value | Apc NetBotz5 AmpDetect Sensor Value | amps | Monitors the value measured by the sensor in amperes. | |
| APC NetBotz Switched Outlet - Error Status and Value | apc_netbotz5_switched_outlet_Value | Apc NetBotz5 Switched Oulet Value | Monitors whether the switched outlet is on or off. Possible values: -1: undefined, 0: off, 1: on. | |
| apc_netbotz5_switched_outlet_ErrorStatus | Apc NetBotz5 Switched Outlet Error Status | Monitors the operational status of the switched outlet. Possible values: normal(0), info(1), warning(2), error(3), critical(4), failure(5). | ||
| APC NetBotz Door Lock Sensor - Error Status and Value | apc_netbotz5_doorlock_sensor_ErrorStatus | Apc NetBotz5 Door Lock Sensor Error Status | Monitors the operational status of the doorlock sensor. Possible values: normal(0), info(1), warning(2), error(3), critical(4), failure(5). | |
| APC NetBotz Smoke Sensor - Error Status and Value | apc_netbotz5_smoke_sensor_Value | Apc NetBotz5 Smoke Sensor Value | Monitors whether smoke is detected. Possible values: -1: undefined, 0: noSmoke, 1: smokeDetected. | |
| APC NetBotz DewPoint Sensor - Error Status and Value | apc_netbotz5_dewpoint_sensor_ErrorStatus | Apc NetBotz5 DewPoint Sensor Error Status | Monitors the operational status of the dewpoint sensor. Possible values: normal(0), info(1), warning(2), error(3), critical(4), failure(5). | |
| APC NetBotz Rssi Sensor - Error Status and Value | apc_netbotz5_rssi_sensor_ErrorStatus | Apc NetBotz5 Rssi Sensor Error Status | Monitors the operational status of the RSSI sensor. Possible values: normal(0), info(1), warning(2), error(3), critical(4), failure(5). | |
| APC NetBotz Vibration Sensor - Error Status and Value | apc_netbotz5_vibration_sensor_Value | Apc NetBotz5 Vibration Sensor Value | Monitors whether vibration is detected. Possible values: undefined(-1), noVibration(0), vibrationDetected(1). | |
| APC NetBotz Dry Contact Sensor - Error Status and Value | apc_netbotz5_drycontact_sensor_ErrorStatus | Apc NetBotz5 Dry Contact Sensor Error Status | Monitors the operational status of the drycontact sensor. Possible values: normal(0), info(1), warning(2), error(3), critical(4), failure(5). | |
| APC NetBotz Rack Handle Sensor - Error Status and Value | apc_netbotz5_rackhandle_sensor_ErrorStatus | Apc NetBotz5 Rack Handle Sensor Error Status | Monitors the operational status of the rack handle sensor. Possible values: normal(0), info(1), warning(2), error(3), critical(4), failure(5). | |
| APC NetBotz Output Relay Sensor - Error Status and Value | apc_netbotz5_outputrelay_sensor_Value | Apc NetBotz5 Output Relay Sensor Value | Monitors whether the relay is open or closed. Possible values: undefined(-1), open(0), closed(1). | |
| APC NetBotz Other Port Status | apc_netbotz5_other_port_Status | Apc NetBotz5 Other Port Status | Monitors the operational status of the port. Possible values: disconnected(0), error(1), normal(2). | |
| APC NetBotz Door Switch Sensor - Error Status and Value | apc_netbotz5_doorswitch_sensor_Value | Apc NetBotz5 Door Switch Sensor Value | Monitors whether the door is open or closed. Possible values: undefined(-1), open(0), closed(1). | |
| APC NetBotz Camera Motion Sensor - Error Status and Value | apc_netbotz5_cameramotion_sensor_ErrorStatus | Apc NetBotz5 Camera Motion Sensor Error Status | Monitors the operational status of the camera motion sensor. Possible values: normal(0), info(1), warning(2), error(3), critical(4), failure(5). | |
| APC NetBotz Vibration Sensor - Error Status and Value | apc_netbotz5_vibration_sensor_ErrorStatus | Apc NetBotz5 Vibration Sensor Error Status | Monitors the operational status of the vibration sensor. Possible values: normal(0), info(1), warning(2), error(3), critical(4), failure(5). | |
| APC NetBotz Leak Sensor - Error Status and Value | apc_netbotz5_leak_sensor_ErrorStatus | Apc NetBotz5 Leak Sensor Error Status | Monitors the operational status of the leak sensor. Possible values: normal(0), info(1), warning(2), error(3), critical(4), failure(5). |
Bird Technologies 4042E Power Sensor
Description
It monitors the bird technologies 4042E power sensor statistics like power , reflected power , ptt state , Vswr , Max & Min Power and Vswr alarms.[BTG-4042E-MIB :: digitalChannelMinVSWRAlarm : 1.3.6.1.4.1.21581.1.7.320.1.7 , digitalChannelMaxVSWRAlarm : 1.3.6.1.4.1.21581.1.7.320.1.9 , digitalChannelMinPowerAlarm : 1.3.6.1.4.1.21581.1.7.320.1.11 , digitalChannelMaxPowerAlarm : 1.3.6.1.4.1.21581.1.7.320.1.13 , digitalChannelFrequencyHz : 1.3.6.1.4.1.21581.1.7.320.1.14 , digitalChannelPTTType : 1.3.6.1.4.1.21581.1.7.320.1.16 , digitalChannelPTTState : 1.3.6.1.4.1.21581.1.7.320.1.18 , digitalChannelForwardPower : 1.3.6.1.4.1.21581.1.7.320.1.19 , digitalChannelReflectedPower : 1.3.6.1.4.1.21581.1.7.320.1.20 , digitalChannelVSWR : 1.3.6.1.4.1.21581.1.7.320.1.21, sensor4042EMinVSWRAlarm : 1.3.6.1.4.1.21581.1.7.300.5 , sensor4042EMaxVSWRAlarm : 1.3.6.1.4.1.21581.1.7.300.7 , sensor4042EMinPowerAlarm : 1.3.6.1.4.1.21581.1.7.300.9 , sensor4042EMaxPowerAlarm : 1.3.6.1.4.1.21581.1.7.300.11 , sensor4042EForwardPower : 1.3.6.1.4.1.21581.1.7.300.14 , sensor4042EReflectedPower : 1.3.6.1.4.1.21581.1.7.300.15 , sensor4042EVSWR : 1.3.6.1.4.1.21581.1.7.300.16 , sensorAlarmMode : 1.3.6.1.4.1.21581.1.7.300.18].
Prerequisites
The device must provide support for the BTG-4042E-MIB.
Supported Metric
| Monitor Name | Metric Name | Metric Display Name | Unit | Description |
|---|---|---|---|---|
| Bird Technologies 4042E - Digital Channel Statistics and Alarms | btg_4042e_sensor_channel_min_vswr_Alarm | BTG 4042E Sensor Channel Min VSWR Alarm | Monitors whether alarm has occurred for VSWR below limit.[BTG-4042E-MIB :: digitalChannelMinVSWRAlarm : 1.3.6.1.4.1.21581.1.7.320.1.7].Possible values are inactive(1) and active(2) | |
| btg_4042e_sensor_channel_max_vswr_Alarm | BTG 4042E Sensor Channel Max VSWR Alarm | Monitors whether alarm has occurred for VSWR above limit.[BTG-4042E-MIB :: digitalChannelMaxVSWRAlarm : 1.3.6.1.4.1.21581.1.7.320.1.9].Possible values are inactive(1) and active(2) | ||
| btg_4042e_sensor_channel_min_power_Alarm | BTG 4042E Sensor Channel Min Power Alarm | Monitors whether alarm has occurred for power below limit.[BTG-4042E-MIB :: digitalChannelMinPowerAlarm : 1.3.6.1.4.1.21581.1.7.320.1.11].Possible values are inactive(1) and active(2). | ||
| btg_4042e_sensor_channel_max_power_Alarm | BTG 4042E Sensor Channel Max Power Alarm | Monitors whether alarm has occurred for power above limit.[BTG-4042E-MIB :: digitalChannelMaxPowerAlarm : 1.3.6.1.4.1.21581.1.7.320.1.13] | ||
| btg_4042e_sensor_channel_Frequency | BTG 4042E Sensor Channel Frequency | Hz | Monitors center frequency of channel in Hz.[BTG-4042E-MIB :: digitalChannelFrequencyHz : 1.3.6.1.4.1.21581.1.7.320.1.14] | |
| btg_4042e_sensor_channel_ptt_type | BTG 4042E Sensor Channel PTT Type | Monitors the ptt type.[BTG-4042E-MIB :: digitalChannelPTTType : 1.3.6.1.4.1.21581.1.7.320.1.16].Possible values are Disabled, Normally-Open or Normally-Closed. | ||
| btg_4042e_sensor_channel_ptt_State | BTG 4042E Sensor Channel PTT State | Monitors the ptt state.[BTG-4042E-MIB :: digitalChannelPTTState : 1.3.6.1.4.1.21581.1.7.320.1.18].Possible values are inactive(1) and active(2) | ||
| btg_4042e_sensor_channel_forward_Power | BTG 4042E Sensor Channel Forward Power | Monitors digital channel forward power.[BTG-4042E-MIB :: digitalChannelForwardPower : 1.3.6.1.4.1.21581.1.7.320.1.19] | ||
| btg_4042e_sensor_channel_reflected_Power | BTG 4042E Sensor Channel Reflected Power | Monitors the channel reflected power.[BTG-4042E-MIB :: digitalChannelReflectedPower : 1.3.6.1.4.1.21581.1.7.320.1.20] | ||
| btg_4042e_sensor_channel_Vswr | BTG 4042E Sensor Channel VSWR | Monitors the Vswr.[BTG-4042E-MIB :: digitalChannelVSWR : 1.3.6.1.4.1.21581.1.7.320.1.21] | ||
| Bird Technologies 4042E - Power and Alarm Statistics | btg_4042e_sensor_min_vswr_Alarm | BTG 4042E Sensor Min VSWR Alarm | Monitors the whether alarm has occurred for VSWR below limit.[BTG-4042E-MIB :: sensor4042EMinVSWRAlarm : 1.3.6.1.4.1.21581.1.7.300.5].Possible values are inactive(1) , active(2). | |
| btg_4042e_sensor_max_vswr_Alarm | BTG 4042E Sensor Max VSWR Alarm | Monitors whether alarm has occurred for VSWR above limit.[BTG-4042E-MIB :: sensor4042EMaxVSWRAlarm : 1.3.6.1.4.1.21581.1.7.300.7].Possible values are inactive(1) and active(2). | ||
| btg_4042e_sensor_min_power_Alarm | BTG 4042E Sensor Min Power Alarm | Monitors whether alarm has occurred for power below limit.[BTG-4042E-MIB :: sensor4042EMinPowerAlarm : 1.3.6.1.4.1.21581.1.7.300.9].Possible values are inactive(1) and active(2) | ||
| btg_4042e_sensor_max_power_Alarm | BTG 4042E Sensor Max Power Alarm | Monitors whether alarm has occurred for power above limit.[BTG-4042E-MIB :: sensor4042EMaxPowerAlarm : 1.3.6.1.4.1.21581.1.7.300.11].Possible values are inactive(1) and active(2). | ||
| btg_4042e_sensor_forward_Power | BTG 4042E Sensor Forward Power | Monitors the aggregate forward power across all channels.[BTG-4042E-MIB :: sensor4042EForwardPower : 1.3.6.1.4.1.21581.1.7.300.14] | ||
| btg_4042e_sensor_reflected_Power | BTG 4042E Sensor Reflected Power | Monitors the aggregate reflected power across all channels.[BTG-4042E-MIB :: sensor4042EReflectedPower : 1.3.6.1.4.1.21581.1.7.300.15.0] | ||
| btg_4042e_sensor_Vswr | BTG 4042E Sensor VSWR | Monitors the aggregate VSWR across all channels.[BTG-4042E-MIB :: sensor4042EVSWR : 1.3.6.1.4.1.21581.1.7.300.16] | ||
| BGP Neighbour Status | bgp.neighbour.status | BGP Neighbour Status | Provides BGP peer connection state. Possible values are 1- Idle,2- Connect,3- Active,4- Opensent,5- Openconfirm,6- Established [OID: 1.3.6.1.2.1.15.3.1.2,1.3.6.1.2.1.15.3.1.7,1.3.6.1.2.1.15.3.1.9,1.3.6.1.2.1.15.3.1.16]. |
Big Cloud Fabric (BCF) Switch Hardware Monitors
Description
It monitors the Big Cloud Fabric (BCF) Switch hardware parameters like Fan status,Fan speed,Power supply status,Temperature reading and Temperature status. Validated on Switch Light OS SWL-OS-BCF-4.0.0(0).
Prerequisites
No prerequisite
Supported Metric
| Monitor Name | Metric Name | Metric Display Name | Unit | Description |
|---|---|---|---|---|
| Big Cloud Fabric (BCF) Switch Fan Status | bcf.switch.fan.status | Fan Status | It monitors the Big Cloud Fabric switches fan status.[OID: 1.3.6.1.4.1.42623.1.2.2.1.2,1.3.6.1.4.1.42623.1.2.2.1.3] | |
| bcf.switch.fan.speed | Fan Speed | rpm | It monitors the rotation speed of the fan in RPM.[OID: 1.3.6.1.4.1.42623.1.2.2.1.5] | |
| Big Cloud Fabric (BCF) Switch Power Supply Status | bcf.switch.psu.status | Power Supply Status | It monitors the Big Cloud Fabric (BCF) power supply unit sensors status.[OIDs: 1.3.6.1.4.1.42623.1.2.3.1.2,1.3.6.1.4.1.42623.1.2.3.1.3,1.3.6.1.4.1.42623.1.2.3.1.4] | |
| Big Cloud Fabric (BCF) Switch Temperature Status | bcf.switch.temperature.status | Temperature Status | It monitors the Big Cloud Fabric (BCF) Switch Temperature Status.[OIDs: 1.3.6.1.4.1.42623.1.2.1.1.2,1.3.6.1.4.1.42623.1.2.1.1.3,1.3.6.1.4.1.42623.1.2.1.1.4] | |
| bcf.switch.temperature.value | Temperature in mC | It monitors the temperature of this sensor in mC.[OIDs: 1.3.6.1.4.1.42623.1.2.1.1.2,1.3.6.1.4.1.42623.1.2.1.1.4] |
Buffalo - Terastation NAS(Network Attached Storage)
Description
Template to monitor Buffalo Terastation NAS parameters like Array Status,Array Capacity,Array Used,Array Utilization,Disk Capacity,Disk Used,Disk Utilization,Disk Smart Status,Disk Status,Failover Status,iSCSI Volume Status,Logical Volume Capacity,Logical Volume Used,Logical Volume Utilization. Validated on BUFFALO-TeraStation -TS51210R - Ver.4.60.
Prerequisites
Device should have support for BUFFALO-NAS-MIB.
Supported Metric
| Monitor Name | Metric Name | Metric Display Name | Unit | Description |
|---|---|---|---|---|
| Buffalo - Terastation NAS Array | buffalo.terastation.nas.arrray.status | Array Status | It monitors the status of a RAID array. This value is read from the 'arrayx' line in the file at /etc/melco/diskinfo.
| |
| buffalo.terastation.nas.arrray.capacity | Array Capacity | GB | It monitors the the maximum capacity of each array.The defaultvalue is '-1'.[BUFFALO-NAS-MIB :: nasArrayCapacity : 1.3.6.1.4.1.5227.27.1.3.1.3] | |
| buffalo.terastation.nas.arrray.used | Array Used | GB | It monitors the usage of each array. The default value is '-1'.[BUFFALO-NAS-MIB :: nasArrayUsed : 1.3.6.1.4.1.5227.27.1.3.1.4] | |
| buffalo.terastation.nas.arrray.utilization | Array Utilization | % | It monitors the Array Utilization [BUFFALO-NAS-MIB :: nasArrayCapacity : 1.3.6.1.4.1.5227.27.1.3.1.3,nasArrayUsed : 1.3.6.1.4.1.5227.27.1.3.1.4] | |
| Buffalo - Terastation NAS Disk | buffalo.terastation.nas.disk.capacity | Disk Capacity | GB | It monitors the the maximum capacity of each drive The default value is '-1'.[BUFFALO-NAS-MIB :: nasDiskCapacity : 1.3.6.1.4.1.5227.27.1.2.1.3] |
| buffalo.terastation.nas.disk.used | Disk Used | GB | It monitors the usage of each drive. The default value is '-1'.[BUFFALO-NAS-MIB :: nasDiskUsed : 1.3.6.1.4.1.5227.27.1.2.1.4] | |
| buffalo.terastation.nas.disk.utilization | Disk Utilization | % | It monitors the Disk Utilization [BUFFALO-NAS-MIB :: nasDiskCapacity : 1.3.6.1.4.1.5227.27.1.2.1.3,nasDiskUsed : 1.3.6.1.4.1.5227.27.1.2.1.4] | |
| buffalo.terastation.nas.disk.smart.status | Disk Smart Status | Monitors the S.M.A.R.T. status of this storage device. Possible values are unavailable ( -2 ),unknown ( -1 ),normal ( 1 ),caution ( 2 ),fail ( 3 ) [BUFFALO-NAS-MIB :: nasDiskSMARTStauts : 1.3.6.1.4.1.5227.27.1.2.1.5] | ||
| Buffalo - TeraStation NAS Disk Status | buffalo.terastation.nas.disk.status | Disk Status | It monitors the status of internal drives. This value is read from the 'diskx' line in the file at /etc/melco/diskinfo.
| |
| Buffalo - Terastation NAS Failover Status | buffalo.terastation.nas.failure.status | Failover Status | It monitors the Failover Status possible values are idle ( 0 ),busy ( 1 ),startingMain ( 2 ),startingBackup ( 3 ),initializing ( 4 ),stopping ( 32 ) [BUFFALO-NAS-MIB :: nasFailoverStatus : 1.3.6.1.4.1.5227.27.1.7.2.0] | |
| Buffalo - Terastation NAS iSCSI Volume Status | buffalo.terastation.nas.iscsi.status | iSCSI Volume Status | It monitors the the connection status of the iSCSI volume. -'unknown(-1)' means the iSCSI volume is in an unknown state. -'connected(1)' means the iSCSI volume is connected via the iSCSI initiator. -'standing-by(2)' means the iSCSI volume is disconnected from the iSCSI initiator.[BUFFALO-NAS-MIB :: nasISCSIStatus : 1.3.6.1.4.1.5227.27.1.9.1.3] | |
| Buffalo - Terastation NAS Logical Volumes | buffalo.terastation.nas.lv.capacity | Logical Volume Capacity | GB | It monitors the Logical Volume Capacity [BUFFALO-NAS-MIB :: nasLVCapacity : 1.3.6.1.4.1.5227.27.1.6.1.1.5.1.3] |
| buffalo.terastation.nas.lv.used | Logical Volume Used | GB | It monitors the logical volume Used.[BUFFALO-NAS-MIB :: nasLVUsed : 1.3.6.1.4.1.5227.27.1.6.1.1.5.1.4] | |
| buffalo.terastation.nas.lv.utilization | Logical Volume Utilization | % | It monitors the logical volume utilization [BUFFALO-NAS-MIB :: nasLVCapacity : 1.3.6.1.4.1.5227.27.1.6.1.1.5.1.3,nasLVUsed : 1.3.6.1.4.1.5227.27.1.6.1.1.5.1.4] |
Bycast StorageGRID - Overall System Status
Description
Template to monitor the Bycast StorageGRID Overall System Status. Enterprise OID : 1.3.6.1.4.1.28669 .BYCAST-STORAGEGRID-MIB.
Prerequisites
No prerequisite
Supported Metric
| Monitor Name | Metric Name | Metric Display Name | Unit | Description |
|---|---|---|---|---|
| Bycast StorageGRID - Overall System Status | bycast.storagegrid.overall.system.status | Overall System Status | It monitors the system status of a StorageGRID.Possible values are unknown(1),adminDown(11),normal(21),notice(31),minor(41),major(51),critical(61) [BYCAST-STORAGEGRID-MIB::status:1.3.6.1.4.1.28669.1.0.1.1.1.0]. |
CTC Union GSW3208M2 Switch SFP - Ext
Description
Monitors the CTC Union GSW3208M2 switch sfp tx power, rx power, voltage and temperature. Validated on CTC Union GSW-3208M2 Switch ( SysObjOID : 1.3.6.1.4.1.4756.146 ). [ GSW-3208M2-MIB :: ctcSfpTxPower : 1.3.6.1.4.1.4756.146.40.10.30.1.10 , ctcSfpRxPower : 1.3.6.1.4.1.4756.146.40.10.30.1.11 , ctcSfpSupplyVoltage : 1.3.6.1.4.1.4756.146.40.10.30.1.14 , ctcSfpTemperature : 1.3.6.1.4.1.4756.146.40.10.30.1.15 ].
Prerequisites
Device must have support for GSW-3208M2-MIB.
Supported Metric
| Monitor Name | Metric Name | Metric Display Name | Unit | Metric Category | Description |
|---|---|---|---|---|---|
| CTC Union GSW3208M2 Switch SFP - Ext | ctc_gsw3208m2_switch_sfp_TxPower | CTC GSW3208M2 Switch SFP Tx Power | dBm | Power | Monitors the CTC GSW3208M2 switch sfp tx output power in dBm. [ GSW-3208M2-MIB :: ctcSfpTxPower : 1.3.6.1.4.1.4756.146.40.10.30.1.10 ].Note: The number following port_ in the component name represents the logical port number. For example, in port_9 and port_10, 9 and 10 are the logical port numbers. |
| ctc_gsw3208m2_switch_sfp_RxPower | CTC GSW3208M2 Switch SFP Rx Power | dBm | Power | Monitors the CTC GSW3208M2 switch sfp rx input power in dBm. [ GSW-3208M2-MIB :: ctcSfpRxPower : 1.3.6.1.4.1.4756.146.40.10.30.1.11 ].Note: The number following port_ in the component name represents the logical port number. For example, in port_9 and port_10, 9 and 10 are the logical port numbers. | |
| ctc_gsw3208m2_switch_sfp_Voltage | CTC GSW3208M2 Switch SFP Voltage | v | Power | Monitors the CTC GSW3208M2 switch sfp transceiver supply voltage in volts. [ GSW-3208M2-MIB :: ctcSfpSupplyVoltage : 1.3.6.1.4.1.4756.146.40.10.30.1.14 ].Note: The number following port_ in the component name represents the logical port number. For example, in port_9 and port_10, 9 and 10 are the logical port numbers. | |
| ctc_gsw3208m2_switch_sfp_Temperature | CTC GSW3208M2 Switch SFP Temperature | Celsius | Thermal | Monitors the CTC GSW3208M2 switch sfp transceiver temperature in degree celsius. [ GSW-3208M2-MIB :: ctcSfpTemperature : 1.3.6.1.4.1.4756.146.40.10.30.1.15 ].Note: The number following port_ in the component name represents the logical port number. For example, in port_9 and port_10, 9 and 10 are the logical port numbers. |
CTC Union GSW3208M2 Switch
Description
Monitors the CTC Union GSW3208M2 switch thermal port temperature and status, additional interface statistics like tx and rx packets, unicast, multicast, broadcast packets and drops, and rx crc alignment errors, runts, giants,fragments and jabber. Validated on CTC Union GSW-3208M2 Switch ( SysObjOID : 1.3.6.1.4.1.4756.146 ). [ GSW-3208M2-MIB :: ctcThermalPortTemperature : 1.3.6.1.4.1.4756.146.30.20.1.2 , ctcThermalPortStatus : 1.3.6.1.4.1.4756.146.30.20.1.3 , ctcRxPackets : 1.3.6.1.4.1.4756.146.40.10.50.1.2 , ctcRxUnicast : 1.3.6.1.4.1.4756.146.40.10.50.1.4 , ctcRxMulticast : 1.3.6.1.4.1.4756.146.40.10.50.1.5 , ctcRxBroadcast : 1.3.6.1.4.1.4756.146.40.10.50.1.6 , ctcRxDrops : 1.3.6.1.4.1.4756.146.40.10.50.1.15 , ctcRxCrcAlign : 1.3.6.1.4.1.4756.146.40.10.50.1.16 , ctcRxUndersize : 1.3.6.1.4.1.4756.146.40.10.50.1.17 , ctcRxOversize : 1.3.6.1.4.1.4756.146.40.10.50.1.18 , ctcRxFragments : 1.3.6.1.4.1.4756.146.40.10.50.1.19 , ctcRxJabber : 1.3.6.1.4.1.4756.146.40.10.50.1.20 , ctcTxPackets : 1.3.6.1.4.1.4756.146.40.10.50.1.22 , ctcTxUnicast : 1.3.6.1.4.1.4756.146.40.10.50.1.24 , ctcTxMulticast : 1.3.6.1.4.1.4756.146.40.10.50.1.25 , ctcTxBroadcast : 1.3.6.1.4.1.4756.146.40.10.50.1.26 , ctcTxDrops : 1.3.6.1.4.1.4756.146.40.10.50.1.35 , ctcTxcollisions : 1.3.6.1.4.1.4756.146.40.10.50.1.36 ].
Prerequisites
Device must have support for GSW-3208M2-MIB.
Supported Metric
| Monitor Name | Metric Name | Metric Display Name | Unit | Metric Category | Description |
|---|---|---|---|---|---|
| CTC Union GSW3208M2 Switch - Thermal Port | ctc_gsw3208m2_switch_thermal_port_Temperature | CTC GSW3208M2 Switch Thermal Port Temperature | Celsius | THERMAL | Monitors the CTC GSW3208M2 switch current chip temperature in degrees celcius. [ GSW-3208M2-MIB :: ctcThermalPortTemperature : 1.3.6.1.4.1.4756.146.30.20.1.2 ] |
| ctc_gsw3208m2_switch_thermal_port_Status | CTC GSW3208M2 Switch Thermal Port Status | AVAILABILITY | Monitors the CTC GSW3208M2 switch thermal port status. [ GSW-3208M2-MIB :: ctcThermalPortStatus : 1.3.6.1.4.1.4756.146.30.20.1.3 ] Possible values are : 1 : thermalProtected , 2 : operatingNormally. | ||
| CTC Union GSW3208M2 Switch - Additional Interface Statistics | ctc_gsw3208m2_switch_interface_RxPackets | CTC GSW3208M2 Switch Interface Rx Packets | packets/sec | PERFORMANCE | Monitors the CTC GSW3208M2 switch number of received (good and bad) packets. [ GSW-3208M2-MIB :: ctcRxPackets : 1.3.6.1.4.1.4756.146.40.10.50.1.2 ] |
| ctc_gsw3208m2_switch_interface_RxUnicast | CTC GSW3208M2 Switch Interface Rx Unicast Packets | packets/sec | PERFORMANCE | Monitors the CTC GSW3208M2 switch number of received (good and bad) unicast packets. [ GSW-3208M2-MIB :: ctcRxUnicast : 1.3.6.1.4.1.4756.146.40.10.50.1.4 ] | |
| ctc_gsw3208m2_switch_interface_RxMulticast | CTC GSW3208M2 Switch Interface Rx Multicast Packets | packets/sec | PERFORMANCE | Monitors the CTC GSW3208M2 switch number of received (good and bad) multicast packets. [ GSW-3208M2-MIB :: ctcRxMulticast : 1.3.6.1.4.1.4756.146.40.10.50.1.5 ] | |
| ctc_gsw3208m2_switch_interface_RxBroadcast | CTC GSW3208M2 Switch Interface Rx Broadcast Packets | packets/sec | PERFORMANCE | Monitors the CTC GSW3208M2 switch number of received (good and bad) broadcast packets. [ GSW-3208M2-MIB :: ctcRxBroadcast : 1.3.6.1.4.1.4756.146.40.10.50.1.6 ] | |
| ctc_gsw3208m2_switch_interface_RxDrops | CTC GSW3208M2 Switch Interface Rx Drops | packets/sec | PERFORMANCE | Monitors the CTC GSW3208M2 switch number of frames dropped due to lack of receive buffers or egress congestion. [ GSW-3208M2-MIB :: ctcRxDrops : 1.3.6.1.4.1.4756.146.40.10.50.1.15 ] | |
| ctc_gsw3208m2_switch_interface_RxCrcAlign | CTC GSW3208M2 Switch Interface Rx CRC Alignment Errors | packets/sec | PERFORMANCE | Monitors the CTC GSW3208M2 switch number of frames received with crc or alignment errors. [ GSW-3208M2-MIB :: ctcRxCrcAlign : 1.3.6.1.4.1.4756.146.40.10.50.1.16 ] | |
| ctc_gsw3208m2_switch_interface_RxRunts | CTC GSW3208M2 Switch Interface Rx Runts | packets/sec | PERFORMANCE | Monitors the CTC GSW3208M2 switch interface received runts. [ GSW-3208M2-MIB :: ctcRxUndersize : 1.3.6.1.4.1.4756.146.40.10.50.1.17 ] | |
| ctc_gsw3208m2_switch_interface_RxGiants | CTC GSW3208M2 Switch Interface Rx Giants | packets/sec | PERFORMANCE | Monitors the CTC GSW3208M2 switch interface received giants. [ GSW-3208M2-MIB :: ctcRxOversize : 1.3.6.1.4.1.4756.146.40.10.50.1.18 ] | |
| ctc_gsw3208m2_switch_interface_RxFragments | CTC GSW3208M2 Switch Interface Rx Fragments | packets/sec | PERFORMANCE | Monitors the CTC GSW3208M2 switch number of short frames received with invalid crc. [ GSW-3208M2-MIB :: ctcRxFragments : 1.3.6.1.4.1.4756.146.40.10.50.1.19 ] | |
| ctc_gsw3208m2_switch_interface_RxJabber | CTC GSW3208M2 Switch Interface Rx Jabber | packets/sec | PERFORMANCE | Monitors the CTC GSW3208M2 switch number of long frames received with invalid crc. [ GSW-3208M2-MIB :: ctcRxJabber : 1.3.6.1.4.1.4756.146.40.10.50.1.20 ] | |
| ctc_gsw3208m2_switch_interface_TxPackets | CTC GSW3208M2 Switch Interface Tx Packets | packets/sec | PERFORMANCE | Monitors the CTC GSW3208M2 switch number of transmitted (good and bad) packets. [ GSW-3208M2-MIB :: ctcTxPackets : 1.3.6.1.4.1.4756.146.40.10.50.1.22 ] | |
| ctc_gsw3208m2_switch_interface_TxUnicast | CTC GSW3208M2 Switch Interface Tx Unicast Packets | packets/sec | PERFORMANCE | Monitors the CTC GSW3208M2 switch number of transmitted (good and bad) unicast packets. [ GSW-3208M2-MIB :: ctcTxUnicast : 1.3.6.1.4.1.4756.146.40.10.50.1.24 ] | |
| ctc_gsw3208m2_switch_interface_TxMulticast | CTC GSW3208M2 Switch Interface Tx Multicast Packets | packets/sec | PERFORMANCE | Monitors the CTC GSW3208M2 switch number of transmitted (good and bad) multicast packets. [ GSW-3208M2-MIB :: ctcTxMulticast : 1.3.6.1.4.1.4756.146.40.10.50.1.25 ] | |
| ctc_gsw3208m2_switch_interface_TxBroadcast | CTC GSW3208M2 Switch Interface Tx Broadcast Packets | packets/sec | PERFORMANCE | Monitors the CTC GSW3208M2 switch number of transmitted (good and bad) broadcast packets. [ GSW-3208M2-MIB :: ctcTxBroadcast : 1.3.6.1.4.1.4756.146.40.10.50.1.26 ] | |
| ctc_gsw3208m2_switch_interface_TxDrops | CTC GSW3208M2 Switch Interface Tx Drops | packets/sec | PERFORMANCE | Monitors the CTC GSW3208M2 switch number of frames dropped due to output buffer congestion. [ GSW-3208M2-MIB :: ctcTxDrops : 1.3.6.1.4.1.4756.146.40.10.50.1.35 ] | |
| ctc_gsw3208m2_switch_interface_TxCollisions | CTC GSW3208M2 Switch Interface Tx Collisions | packets/sec | PERFORMANCE | Monitors the CTC GSW3208M2 switch number of frames dropped due to excessive or late collisions. [ GSW-3208M2-MIB :: ctcTxcollisions : 1.3.6.1.4.1.4756.146.40.10.50.1.36 ] |
Cyxtera Appgate
Description
Template to monitor Cyxtera Appgate parameters like Sdp Appliance,Ctrl Authentication & Authorization,Ctrl License,Sdp Appliance Network Interfaces,Sdp Appliance Roles,Sdp Vpn,Ctrl Client Authentications Total,Ctrl Client Authentications Error,Ctrl Client AuthorizationTotal,Ctrl Client Authorization Error,Ctrl Admin Authentication Total,Ctrl Admin Authentication Error,Ctrl Admin Authorization Total,Ctrl Admin Authorization Error,Total number of entitled users in license,Total number of entitled sites in license,Total usage of licensed users,Total usage of licensed sites,Cyxtera appgate sdp appliance parameters like Sdp Appliance Cpu Usage Percent,Sdp Appliance Disk Usage Percent,Sdp Appliance Disk Total Bytes,Sdp Appliance Disk Used Bytes,Sdp Appliance Memory Usage Percent,Sdp Appliance Memory Total Bytes,Sdp Appliance Memory Used Bytes,Sdp Appliance Status,Sdp Appliance Upgrade Status,Sdp Appliance Network Interfaces parameters like Sdp Appliance Nic Tx Speed,Sdp Appliance Nic Rx Speed,Cyxtera appgate sdp appliance roles status,Role number of sessions,Sdp VpnTotal Memory Usage,Sdp VpnTotal Sessions.[CYXTERA-MIB :: ctrlClientAuthenticationTotal : 1.3.6.1.4.1.53245.1.1.6.1.1.1.0,ctrlClientAuthenticationError : 1.3.6.1.4.1.53245.1.1.6.1.1.3.0,ctrlClientAuthorizationTotal : 1.3.6.1.4.1.53245.1.1.6.1.2.1.0,ctrlClientAuthorizationError : 1.3.6.1.4.1.53245.1.1.6.1.2.3.0,ctrlAdminAuthenticationTotal : 1.3.6.1.4.1.53245.1.1.6.2.1.1.0,ctrlAdminAuthenticationError : 1.3.6.1.4.1.53245.1.1.6.2.1.3.0,ctrlAdminAuthorizationTotal : 1.3.6.1.4.1.53245.1.1.6.2.2.1.0,ctrlAdminAuthorizationError : 1.3.6.1.4.1.53245.1.1.6.2.2.3.0,ctrlLicenseEntitledUsers : 1.3.6.1.4.1.53245.1.1.6.3.1.1.0,ctrlLicenseEntitledSites : 1.3.6.1.4.1.53245.1.1.6.3.1.2.0,ctrlLicenseUsedUsers : 1.3.6.1.4.1.53245.1.1.6.3.2.1.0,ctrlLicenseUsedSites : 1.3.6.1.4.1.53245.1.1.6.3.2.2.0,sdpApplianceCpuUsagePercent : 1.3.6.1.4.1.53245.1.1.11.1.1.0,sdpApplianceDiskUsagePercent : 1.3.6.1.4.1.53245.1.1.11.2.1.0,sdpApplianceDiskTotalBytes : 1.3.6.1.4.1.53245.1.1.11.2.3.0,sdpApplianceDiskUsedBytes : 1.3.6.1.4.1.53245.1.1.11.2.4.0,sdpApplianceMemoryUsagePercent : 1.3.6.1.4.1.53245.1.1.11.3.1.0,sdpApplianceMemoryTotalBytes : 1.3.6.1.4.1.53245.1.1.11.3.3.0,sdpApplianceMemoryUsedBytes : 1.3.6.1.4.1.53245.1.1.11.3.4.0,sdpApplianceStatus : 1.3.6.1.4.1.53245.1.1.11.8.0,sdpApplianceUpgradeStatus : 1.3.6.1.4.1.53245.1.1.11.9.1.0,sdpApplianceNicTxSpeed : 1.3.6.1.4.1.53245.1.1.11.4.3.1.2,sdpApplianceNicRxSpeed : 1.3.6.1.4.1.53245.1.1.11.4.3.1.3,sdpApplianceRoleStatus : 1.3.6.1.4.1.53245.1.1.11.6.1.2,sdpApplianceRoleNumberOfSessions : 1.3.6.1.4.1.53245.1.1.11.6.1.4,vpnTotalMemoryUsage : 1.3.6.1.4.1.53245.1.1.5.10.0,vpnTotalSessions : 1.3.6.1.4.1.53245.1.1.5.11.0]
Prerequisites
No prerequisite
Supported Metric
| Monitor Name | Metric Name | Metric Display Name | Unit | Description |
|---|---|---|---|---|
| Cyxtera Appgate - Ctrl Authentication & Authorization | cyxtera_appgate_ctrladminauthentication_CtrlAdminAuthenticationTotal | Cyxtera Appgate Ctrl Admin Authentication Total | count | Monitors the cyxtera appgate ctrl admin total authentication.[CYXTERA-MIB :: ctrlAdminAuthenticationTotal : 1.3.6.1.4.1.53245.1.1.6.2.1.1.0] |
| cyxtera_appgate_ctrladminauthorizationtotal_CtrlAdminAuthorizationTotal | Cyxtera Appgate Ctrl Admin Authorization Total | count | Monitors the cyxtera appgate ctrl admin total authorization.[CYXTERA-MIB :: ctrlAdminAuthorizationTotal : 1.3.6.1.4.1.53245.1.1.6.2.2.1.0] | |
| cyxtera_appgate_ctrlclientauthentication_CtrlClientAuthenticationError | Cyxtera Appgate Ctrl Client Authentications Error | count | Monitors the cyxtera appgate ctrl client authentications total error.[CYXTERA-MIB :: ctrlClientAuthenticationError : 1.3.6.1.4.1.53245.1.1.6.1.1.3] | |
| cyxtera_appgate_ctrladminauthorizationerror_CtrlAdminAuthorizationError | Cyxtera Appgate Ctrl Admin Authorization Error | count | Monitors the cyxtera appgate ctrl admin total authorization error.[CYXTERA-MIB :: ctrlAdminAuthorizationError : 1.3.6.1.4.1.53245.1.1.6.2.2.3.0] | |
| cyxtera_appgate_ctrlclientauthentication_CtrlClientAuthenticationTotal | Cyxtera Appgate Ctrl Client Authentications Total | count | Monitors the cyxtera appgate ctrl client total authentications.[CYXTERA-MIB :: ctrlClientAuthenticationTotal : 1.3.6.1.4.1.53245.1.1.6.1.1.1] | |
| cyxtera_appgate_ctrlclientauthentication_CtrlClientAuthorizationTotal | Cyxtera Appgate Ctrl Client Authorization Total | count | Monitors the cyxtera appgate ctrl client total authorization.[CYXTERA-MIB :: ctrlClientAuthorizationTotal : 1.3.6.1.4.1.53245.1.1.6.1.2.1] | |
| cyxtera_appgate_ctrlclientauthentication_CtrlClientAuthorizationError | Cyxtera Appgate Ctrl Client Authorization Error | count | Monitors the cyxtera appgate ctrl total client authorization error.[CYXTERA-MIB :: ctrlClientAuthorizationError : 1.3.6.1.4.1.53245.1.1.6.1.2.3] | |
| cyxtera_appgate_ctrladminauthenticationerror_CtrlAdminAuthenticationError | Cyxtera Appgate Ctrl Admin Authentication Error | count | Monitors the cyxtera appgate ctrl admin total error authentication.[CYXTERA-MIB :: ctrlAdminAuthenticationError : 1.3.6.1.4.1.53245.1.1.6.2.1.3.0] | |
| Cyxtera Appgate - Ctrl License | cyxtera_appgate_ctrlLicense_CtrlLicenseUsedSites | Cyxtera Appgate Ctrl License Used Sites | count | Monitors the total usage of licensed sites.[CYXTERA-MIB :: ctrlLicenseUsedSites : 1.3.6.1.4.1.53245.1.1.6.3.2.2.0] |
| cyxtera_appgate_ctrlLicense_CtrlLicenseEntitledSites | Cyxtera Appgate Ctrl License Entitled Sites | count | Monitors the total number of entitled sites in cyxtera appgate ctrl license.[CYXTERA-MIB :: ctrlLicenseEntitledSites : 1.3.6.1.4.1.53245.1.1.6.3.1.2.0] | |
| cyxtera_appgate_ctrlLicense_CtrlLicenseEntitledUsers | Cyxtera Appgate Ctrl License Entitled Users | count | Monitors the total number of entitled users in cyxtera appgate ctrl license.[CYXTERA-MIB :: ctrlLicenseEntitledUsers : 1.3.6.1.4.1.53245.1.1.6.3.1.1.0] | |
| cyxtera_appgate_ctrlLicense_CtrlLicenseUsedUsers | Cyxtera Appgate Ctrl License Used Users | count | Monitors the total usage of licensed users.[CYXTERA-MIB :: ctrlLicenseUsedUsers : 1.3.6.1.4.1.53245.1.1.6.3.2.1.0] | |
| Cyxtera Appgate - Sdp Appliance | cyxtera_appgate_sdpappliance_SdpApplianceMemoryUsedGB | Cyxtera Appgate Sdp Appliance Memory Used GB | GB | Monitors the cyxtera appgate sdp appliance memory used in GB.[CYXTERA-MIB :: sdpApplianceMemoryUsedBytes : 1.3.6.1.4.1.53245.1.1.11.3.4.0] |
| cyxtera_appgate_sdpappliance_SdpApplianceStatus | Cyxtera Appgate Sdp Appliance Status | Monitors the status of cyxtera appgate sdp appliance. Alert will be generated when the status is not Healthy.[CYXTERA-MIB :: sdpApplianceStatus : 1.3.6.1.4.1.53245.1.1.11.8.0] | ||
| cyxtera_appgate_sdpappliance_SdpApplianceDiskUsagePercent | Cyxtera Appgate Sdp Appliance Disk Usage Percent | % | Monitors the cyxtera appgate sdp appliance disk usage in percent.[CYXTERA-MIB :: sdpApplianceDiskUsagePercent : 1.3.6.1.4.1.53245.1.1.11.2.1.0] | |
| cyxtera_appgate_sdpappliance_SdpApplianceCpuUsagePercent | Cyxtera Appgate Sdp Appliance Cpu Usage Percent | % | Monitors the cyxtera appgate sdp appliance cpu usage in percent.[CYXTERA-MIB :: sdpApplianceCpuUsagePercent : 1.3.6.1.4.1.53245.1.1.11.1.1.0] | |
| cyxtera_appgate_sdpappliance_SdpApplianceDiskTotalGB | Cyxtera Appgate Sdp Appliance Disk Total GB | GB | Monitors the cyxtera appgate sdp appliance disk total in GB.[CYXTERA-MIB :: sdpApplianceDiskTotalBytes : 1.3.6.1.4.1.53245.1.1.11.2.3.0] | |
| cyxtera_appgate_sdpappliance_SdpApplianceUpgradeStatus | Cyxtera Appgate Sdp Appliance Upgrade Status | Monitors the cyxtera appgate sdp appliance upgrade status.[CYXTERA-MIB :: sdpApplianceUpgradeStatus : 1.3.6.1.4.1.53245.1.1.11.9.1.0] | ||
| cyxtera_appgate_sdpappliance_SdpApplianceDiskUsedGB | Cyxtera Appgate Sdp Appliance Disk Used GB | GB | Monitors the cyxtera appgate sdp appliance disk used in GB.[CYXTERA-MIB :: sdpApplianceDiskUsedBytes : 1.3.6.1.4.1.53245.1.1.11.2.4.0] | |
| cyxtera_appgate_sdpappliance_SdpApplianceMemoryUsagePercent | Cyxtera Appgate Sdp Appliance Memory Usage Percent | % | Monitors the cyxtera appgate sdp appliance memory usage in percent.[CYXTERA-MIB :: sdpApplianceMemoryUsagePercent : 1.3.6.1.4.1.53245.1.1.11.3.1.0] | |
| cyxtera_appgate_sdpappliance_SdpApplianceMemoryTotalGB | Cyxtera Appgate Sdp Appliance Memory Total GB | GB | Monitors the cyxtera appgate sdp appliance memory total in GB.[CYXTERA-MIB :: sdpApplianceMemoryTotalBytes : 1.3.6.1.4.1.53245.1.1.11.3.3.0] | |
| Cyxtera Appgate - Sdp Appliance Network Interfaces | cyxtera_appgate_sdpappliancenetworkinterfaces_SdpApplianceNicTxSpeed | Cyxtera Appgate Sdp Appliance Nic Tx Speed | Kbps | Monitors the cyxtera appgate sdp appliance network interface tx speed.[CYXTERA-MIB :: sdpApplianceNicTxSpeed : 1.3.6.1.4.1.53245.1.1.11.4.3.1.2] |
| cyxtera_appgate_sdpappliancenetworkinterfaces_SdpApplianceNicRxSpeed | Cyxtera Appgate Sdp Appliance Nic Rx Speed | Kbps | Monitors the cyxtera appgate sdp appliance network interface Rx Speed.[CYXTERA-MIB :: sdpApplianceNicRxSpeed : 1.3.6.1.4.1.53245.1.1.11.4.3.1.3] | |
| Cyxtera Appgate - Sdp Appliance Roles | cyxtera_appgate_sdpapplianceroles_SdpApplianceRoleNumberOfSessions | Cyxtera Appgate Sdp Appliance Role Number Of Sessions | count | Monitors the cyxtera appgate sdp appliance role number of sessions.[CYXTERA-MIB :: sdpApplianceRoleNumberOfSessions : 1.3.6.1.4.1.53245.1.1.11.6.1.4] |
| cyxtera_appgate_sdpapplianceroles_SdpApplianceRoleStatus | Cyxtera Appgate Sdp Appliance Role Status | Monitors the cyxtera appgate sdp appliance role status.Alert will be generated when the status is not Healthy.[CYXTERA-MIB :: sdpApplianceRoleStatus : 1.3.6.1.4.1.53245.1.1.11.6.1.2] | ||
| Cyxtera Appgate - Sdp Vpn | cyxtera_appgate_sdpvpn_VpnTotalMemoryUsage | Cyxtera Appgate Sdp VpnTotal Memory Usage | Bytes | Monitors the total memory usage by the firewall engine in bytes.[CYXTERA-MIB :: vpnTotalMemoryUsage : 1.3.6.1.4.1.53245.1.1.5.10.0] |
| cyxtera_appgate_sdpvpn_VpnTotalSessions | Cyxtera Appgate Sdp Vpn Total Sessions | count | Monitors the total number of sessions in VPN.[CYXTERA-MIB :: vpnTotalSessions : 1.3.6.1.4.1.53245.1.1.5.11.0] |
Dns - Performance
Note
This template will be deprecated soon.Description
It monitors dns metrics like dns name response time and dns name response state.
Prerequisites
No prerequisite
Supported Metric
| Monitor Name | Metric Name | Metric Display Name | Unit | Description |
|---|---|---|---|---|
| Dns - Performance | dns.name.response.time | DNS Name Response Time | ms | The response time for DNS query for a given record,tagged by hostname |
| dns.name.resolved.state | DNS Name resolved state | NULL | Dns state whether it is resolved or not. If it is resolved returns boolean value |
Dot3 Interface Statistics
Description
Monitors the statistics for a collection of Ethernet-like interfaces attached to a particular system.
Prerequisites
No prerequisite
Supported Metric
| Monitor Name | Metric Name | Metric Display Name | Unit | Description |
|---|---|---|---|---|
| Dot3 Stats | dot3.excessive.collisions | Interface Excessive Collisions Count | Monitors the current number of frames for which transmission on a particular interface fails due to excessive collisions.[OID: 1.3.6.1.2.1.10.7.2.1.9] | |
| dot3.internal.mac.rcverrors | Interface Internal MAC Receive Errors | Monitors the current number of frames for which reception on a particular interface fails due to an internal MAC sub-layer receive error.[OID: 1.3.6.1.2.1.10.7.2.1.16] | ||
| dot3.Internal.mac.transmiterrors | Interface Internal MAC Transmit Errors | Monitors the current number of frames for which transmission on a interface fails due to an internal sub-layer transmit error.[OID: 1.3.6.1.2.1.10.7.2.1.10] | ||
| dot3.late.collisions | Interface Late Collisions | Monitors the current number of times that a collision is on a particular interface later than slot-time into the transmission of a packet.[OID: 1.3.6.1.2.1.10.7.2.1.8] | ||
| dot3.multiple.collision.frames | Interface Multiple Collision Frames | Monitors the current number of frames that are involved in more than one collision and are subsequently transmitted successfully.[OID: 1.3.6.1.2.1.10.7.2.1.5] | ||
| dot3.single.collision.frames | Interface Single Collisions | Monitors the current number of frames that are involved in a single collision,and are subsequently transmitted successfully.[OID: 1.3.6.1.2.1.10.7.2.1.4] | ||
| fcs.errors | Interface FCS Errors | Provides the current number of frames received on a particular interface that are an integral number of octets in length but do not pass the FCS check.[OID: 1.3.6.1.2.1.10.7.2.1.3] |
DS1 Interface Statistics - G2
Description
Monitors errored seconds,severely errored seconds and unavailable seconds on DS1 interfaces.
Prerequisites
No prerequisite
Supported Metric
| Monitor Name | Metric Name | Metric Display Name | Unit | Description |
|---|---|---|---|---|
| DS1 Interface Stats | ds1.total.errored.secs | Total Errored Seconds | Monitors the number of Errored Seconds encountered by a DS1 interface in the previous 24-hour interval.[OIDs: 1.3.6.1.2.1.10.18.9.1.2,1.3.6.1.2.1.2.2.1.2] | |
| ds1.total.severely.errored.secs | Total Severely Errored Seconds | Monitors the number of Severely Errored Seconds encountered by a DS1 interface in the previous 24-hour interval.[OIDs: 1.3.6.1.2.1.10.18.9.1.3,1.3.6.1.2.1.2.2.1.2] | ||
| ds1.total.unavailable.secs | Total Unavailable Seconds | Monitors the number of Unavailable Seconds encountered by a DS1 interface in the previous 24-hour interval.[OIDs: 1.3.6.1.2.1.10.18.9.1.5,1.3.6.1.2.1.2.2.1.2] |
Eaton PDU - Performance
Description
Provides all the PDU parameters such as - the environmental Input Power,Voltage and Current measurements,Strapping status,Communication status of the EPDU,controller - sensor status etc
Prerequisites
No prerequisite
Supported Metric
| Monitor Name | Metric Name | Metric Display Name | Unit | Description |
|---|---|---|---|---|
| Eaton PDU Basic Details | eaton.pdu.frequency.status | Input Frequency Status | Status of the measured input frequency relative to the nominal frequency and the admitted tolerance.[OID : 1.3.6.1.4.1.534.6.6.7.3.1.1.4.0.1] | |
| eaton.pdu.internal.status | Eaton PDU Internal Status | Provides status of the internal failure inside the PDU.[OID: 1.3.6.1.4.1.534.6.6.7.1.2.1.31.0] | ||
| eaton.pdu.strapping.status | Eaton PDU Strapping Status | Provides status of the external communication with a strapping unit.[OID: 1.3.6.1.4.1.534.6.6.7.1.2.1.32.0] | ||
| eaton.pdu.communication.status | Eaton PDU Communication Status | Provides status of the internal communication with the PDU.[OID: 1.3.6.1.4.1.534.6.6.7.1.2.1.30.0] | ||
| Eaton PDU Contact Sensor Status | eaton.pdu.contact.state2 | Eaton PDU Contact State - 2 | Provides the state of the contact sensor.Possible values are 1: contactBad(-1),2: contactOpen(0) and 3: contactClosed(1).[OID: 1.3.6.1.4.1.534.6.6.7.7.3.1.4.0.1,1.3.6.1.4.1.534.6.6.7.7.3.1.4.0.2]. | |
| eaton.pdu.contact.state | Eaton PDU Contact State | Provides the state of the contact sensor.Possible values are 1: contactBad(-1),2: contactOpen(0) and 3: contactClosed(1).[OID: 1.3.6.1.4.1.534.6.6.7.7.3.1.4.0.1,1.3.6.1.4.1.534.6.6.7.7.3.1.4.0.2]. | ||
| eaton.pdu.contact.probe.status | Eaton PDU Contact Probe Status - 1 | Indicates whether a probe is connected or not. Will not be returned if the contact sensor is internal to the ePDU,in that case only contactState should be read. Possible values are 1: bad(-1),2: disconnected(0) and 3: connected(1).[OID: 1.3.6.1.4.1.534.6.6.7.7.3.1.3.0.1]. | ||
| eaton.pdu.contact.probe.status.2 | Eaton PDU Contact Probe Status - 2 | Indicates whether a probe is connected or not .Will not be returned if the contact sensor is internal to the ePDU,in that case only contactState should be read. Possible values are 1: bad(-1),2: disconnected(0) and 3: connected(1).[OID: 1.3.6.1.4.1.534.6.6.7.7.3.1.3.0.2]. | ||
| Eaton PDU Humidity Status | eaton.pdu.humidity.probe.status | Eaton PDU Humidity Probe Status | Indicates whether a probe is connected or not. Possible values are 1: bad(-1),2: disconnected(0) and 3: connected(1).[OID: 1.3.6.1.4.1.534.6.6.7.7.2.1.3.0.1] | |
| eaton.pdu.humidity.threshold.status | Eaton PDU Humidity Threshold Status | Provides status of the measured humidity relative to the configured thresholds. Possible values are 1: good(0),2: lowWarning(1),3: lowCritical(2),4: highWarning(3) and 5: highCritical(4).[OID: 1.3.6.1.4.1.534.6.6.7.7.2.1.5.0.1] | ||
| eaton.pdu.humidity.value | Eaton PDU Humidity Value | Provides the Humidity Value. Units are tenths of a percent relative humidity.[OID: 1.3.6.1.4.1.534.6.6.7.7.2.1.4.0.1]. | ||
| Eaton PDU Input Voltage and Current | Input Voltage Value - 2 | mV | An input voltage measurement value. Units are millivolts. | |
| eaton.pdu.input.current.2 | Input Current Value - 2 | amps | An input current measurement value. Units are milliamps. | |
| eaton.pdu.input.current.1 | Input Current Value - 1 | amps | An input current measurement value. Units are milliamps. | |
| eaton.pdu.input.voltage.1 | Input Voltage Value - 1 | mV | An input voltage measurement value. Units are millivolts. | |
| Eaton PDU Temperature | eaton.pdu.temperature.value | Eaton PDU Temperature Value | Celsius | Provides Temperature. Units are in tenths of a degree according to the scale specified by temperatureScale (either Fahrenheit or Celsius). Divide by ten to get degrees. |
| eaton.pdu.temperature.probe.status | Eaton PDU Temperature Probe Status | Indicates whether a probe is connected or not. Possible Values are 1: bad(-1),2: disconnected(0) and 3: connected(1) .[OID : enterprises.534.6.6.7.7.1.1.3.0.1] | ||
| eaton.pdu.temperature.threshold.status | Eaton PDU Temperature Threshold Status | Provides status of the measured temperature relative to the configured thresholds. Possible values 1: good(0),2: lowWarning(1),3: lowCritical(2),4: highWarning(3) and 5: highCritical(4).[OID: 1.3.6.1.4.1.534.6.6.7.7.1.1.5.0.1] | ||
| Eaton PDU Total Input Power Measurements | eaton.pdu.input.VA | Eaton PDU Input Total VA | Provides input Total VA value. Units are VA. A negative value indicates that this object is not available.[OID: 1.3.6.1.4.1.534.6.6.7.3.5.1.3.0.1]. | |
| eaton.pdu.input.watts | Eaton PDU Input Watts | W | Provides input Watts value. Units are Watts. A negative value indicates that this object is not available.[OID: 1.3.6.1.4.1.534.6.6.7.3.5.1.4.0.1] |
Eaton XUPS Health
Description
Template to monitor Xtreme Unidirectional Protection System (XUPS). Monitors battery capacity,battery current,battery voltage,battery time remaining,environment temperature,output load,input frequency,output frequency,battery status (ABM) and Ambient Temperature. Can be applied on all the XUPS devices.
Prerequisites
No prerequisite
Supported Metric
| Monitor Name | Metric Name | Metric Display Name | Unit | Description |
|---|---|---|---|---|
| XUPS Battery Statistics | xups.battery.capacity | XUPS Battery Capacity | % | Provides the XUPS battery percent charge.[OID: 1.3.6.1.4.1.534.1.2.4] |
| xups.battery.current | XUPS Battery Current | amps | Provides the Xtreme Unidirectional Protection System (XUPS) battery current as reported by the UPS metering. Current is positive when discharging,negative when recharging the battery. Alert will get generated when the value is greater than equal to 30.[OID: 1.3.6.1.4.1.534.1.2.3.0] | |
| xups.battery.voltage | XUPS Battery Voltage | v | Battery voltage as reported by the UPS meters. Monitor failure indicates a problem with the voltage being supplied to end devices. There may not be enough voltage presently being provided to attached devices. As a result,devices may not operate as expected.[OID: 1.3.6.1.4.1.534.1.2.2.0] | |
| xups.battery.time.remaining | XUPS Battery Time Remaining | s | Provides the XUPS battery run time in seconds before UPS turns off due to low battery.[OID: 1.3.6.1.4.1.534.1.2.1]. | |
| XUPS Battery Status (ABM) | xups.battery.abm.status | XUPS Battery Status (ABM) | The status of the Advanced Battery Management.[OID: 1.3.6.1.4.1.534.1.2.5.0] | |
| XUPS Environment Temperature | xups.environment.ambient.temperature | XUPS Environment Ambient Temperature | C | Provides the Xtreme Unidirectional Protection System (XUPS) reading of the ambient temperature in the vicinity of the UPS or SNMP agent. Alert wil get generated when the value is not equal to zero.[OID: 1.3.6.1.4.1.534.1.6.1]. |
| xups.environment.remote.temperature | XUPS Environment Remote Temperature | C | Provides the XUPS reading of a remote temperature sensor connected to the UPS or SNMP agent.[OID: 1.3.6.1.4.1.534.1.6.5]. | |
| XUPS I/O Frequency | xups.input.frequency | XUPS Input Frequency | Hz | The utility line frequency in tenths of Hz. Monitor failure indicates that the power being supplied to devices is fluctuating. Devices may be susceptible to problems with receiving power at varying frequencies.[OID: 1.3.6.1.4.1.534.1.3.1.0] |
| xups.output.frequency | XUPS Output Frequency | Hz | The measured UPS output frequency in tenths of Hz. Monitor failure indicates that the power being supplied to devices is fluctuating. Devices may be susceptible to problems when receiving power at varying frequencies. Note: This configuration assumes that 60 Hz is nominal. Non-North American countries may have different nominal frequencies. As well,if your equipment is very sensitive,the range of acceptable values should be adjusted accordingly.[OID: 1.3.6.1.4.1.534.1.4.2.0] | |
| XUPS Output Load | xups.output.load | XUPS Output Load | % | The UPS output load in percent of rated capacity. Monitor failure indicates that the percentage load attached to the UPS has been exceeded. The output load affects the running time of all components being supplied battery power.[OID: 1.3.6.1.4.1.534.1.4.1.0] |
| XUPS Output Status | xups.output.status | XUPS Output Status | The present source of output power.[OID: 1.3.6.1.4.1.534.1.4.5.0] |
Eaton Phoenixtec - UPS Health
Description
Monitors the Eaton Phoenixtec - UPS Health Metrics like Status, Estimated Minutes Remaining, Estimated Charge Remaining, Temperature, ABM Status, UPS Environment Temperature and Humidity, System Input Statistics like Frequency, Voltage, Current, Power,UPS System Output Statistics like Frequency, Voltage, Power , Load, Watts, System Status and Temperature. Validated on Eaton Phoenixtec Network Management Card for UPS. [ SysObjectOID : 1.3.6.1.4.1.935.10.1 ]. [ EPPC-MIB :: upsEBatteryStatus : 1.3.6.1.4.1.935.10.1.1.3.1.0, upsEBatteryEstimatedMinutesRemaining : 1.3.6.1.4.1.935.10.1.1.3.3.0, upsEBatteryEstimatedChargeRemaining : 1.3.6.1.4.1.935.10.1.1.3.4.0, upsEBatteryTemperature : 1.3.6.1.4.1.935.10.1.1.3.8.0, upsEBatteryABMStatus : 1.3.6.1.4.1.935.10.1.1.3.10.0, upsEEnvironmentCurrentTemperature : 1.3.6.1.4.1.935.10.1.1.6.1.1.0 , upsEEnvironmentCurrentHumidity : 1.3.6.1.4.1.935.10.1.1.6.2.1.0, upsESystemInputFrequency : 1.3.6.1.4.1.935.10.1.1.2.16.1.2, upsESystemInputVoltage : 1.3.6.1.4.1.935.10.1.1.2.16.1.3, upsESystemInputCurrent : 1.3.6.1.4.1.935.10.1.1.2.16.1.4, upsESystemInputWatts : 1.3.6.1.4.1.935.10.1.1.2.16.1.5, upsESystemOutputFrequency : 1.3.6.1.4.1.935.10.1.1.2.18.1.2, upsESystemOutputVoltage : 1.3.6.1.4.1.935.10.1.1.2.18.1.3, upsESystemOutputCurrent : 1.3.6.1.4.1.935.10.1.1.2.18.1.4, upsESystemOutputWatts : 1.3.6.1.4.1.935.10.1.1.2.18.1.5, upsESystemOutputLoad : 1.3.6.1.4.1.935.10.1.1.2.18.1.7, upsESystemStatus : 1.3.6.1.4.1.935.10.1.1.2.1.0, upsESystemTemperature : 1.3.6.1.4.1.935.10.1.1.2.2.0].
Prerequisites
Device must have support for EPCC-MIB
Supported Metric
| Monitor Name | Metric Name | Metric Display Name | Unit | Description |
|---|---|---|---|---|
| Eaton Phoenixtec - UPS Battery Statistics | eppc_ups_battery_Status | EPPC UPS Battery Status | Monitors the EPPC UPS Battery Status. [ EPPC-MIB :: upsEBatteryStatus : 1.3.6.1.4.1.935.10.1.1.3.1.0 ] Possible values are 1 : unknown, 2 : batteryNormal, 3 : batteryLow, 4 : batteryDepleted, 5 : batteryDischarging, 6 : batteryFailure | |
| eppc_ups_battery_EstimatedMinutesRemaining | EPPC UPS Battery Estimated Minutes Remaining | m | Monitors the EPPC UPS Battery Estimated Minutes Remaining. [ EPPC-MIB :: upsEBatteryEstimatedMinutesRemaining : 1.3.6.1.4.1.935.10.1.1.3.3.0 ] | |
| eppc_ups_battery_EstimatedChargeRemaining | EPPC UPS Battery Estimated Charge Remaining | % | Monitors the EPPC UPS Battery Estimated Charge Remaining. [ EPPC-MIB :: upsEBatteryEstimatedChargeRemaining : 1.3.6.1.4.1.935.10.1.1.3.4.0 ] | |
| eppc_ups_battery_Temperature | EPPC UPS Battery Temperature | Celsius | Monitors the EPPC UPS Battery Temperature. [ EPPC-MIB :: upsEBatteryTemperature : 1.3.6.1.4.1.935.10.1.1.3.8.0 ] | |
| eppc_ups_battery_ABMStatus | EPPC UPS Battery ABM Status | Monitors the EPPC UPS Battery ABM Status. [ EPPC-MIB :: upsEBatteryABMStatus : 1.3.6.1.4.1.935.10.1.1.3.10.0 ] Possible values are 1 : charge, 2 : float, 3 : rest, 4 : discharge, 5 : disable | ||
| eppc_ups_environment_CurrentTemperature | EPPC UPS Environment Current Temperature | Celsius | Monitors the EPPC UPS Environment Current Temperature. [ upsEEnvironmentCurrentTemperature : 1.3.6.1.4.1.935.10.1.1.6.1.1.0 ] | |
| eppc_ups_environment_CurrentHumidity | EPPC UPS Environment Current Humidity | % | Monitors the EPPC UPS Environment Current Humidity. [ EPPC-MIB :: upsEEnvironmentCurrentHumidity : 1.3.6.1.4.1.935.10.1.1.6.2.1.0 ] | |
| eppc_ups_system_input_Frequency | EPPC UPS System Input Frequency | Hz | Monitors the EPPC UPS System Input Frequency. [ EPPC-MIB :: upsESystemInputFrequency : 1.3.6.1.4.1.935.10.1.1.2.16.1.2 ] | |
| eppc_ups_system_input_Voltage | EPPC UPS System Input Voltage | v | Monitors the EPPC UPS System Input Voltage. [ EPPC-MIB :: upsESystemInputVoltage : 1.3.6.1.4.1.935.10.1.1.2.16.1.3 ] | |
| eppc_ups_system_input_Current | EPPC UPS System Input Current | amps | Monitors the EPPC UPS System Input Current. [ upsESystemInputCurrent : 1.3.6.1.4.1.935.10.1.1.2.16.1.4 ] | |
| eppc_ups_system_input_Power | EPPC UPS System Input Power | W | Monitors the EPPC UPS System Input Power. [ EPPC-MIB :: upsESystemInputWatts : 1.3.6.1.4.1.935.10.1.1.2.16.1.5 ] | |
| eppc_ups_system_output_Frequency | EPPC UPS System Output Frequency | Hz | Monitors the EPPC UPS System Output Frequency. [ EPPC-MIB :: upsESystemOutputFrequency : 1.3.6.1.4.1.935.10.1.1.2.18.1.2 ] | |
| eppc_ups_system_output_Voltage | EPPC UPS System Output Voltage | v | Monitors the EPPC UPS System Output Voltage. [ EPPC-MIB :: upsESystemOutputVoltage : 1.3.6.1.4.1.935.10.1.1.2.18.1.3 ] | |
| eppc_ups_system_output_Current | EPPC UPS System Output Current | amps | Monitors the EPPC UPS System Output Current. [ EPPC-MIB :: upsESystemOutputCurrent : 1.3.6.1.4.1.935.10.1.1.2.18.1.4 ] | |
| eppc_ups_system_output_Power | EPPC UPS System Output Power | W | Monitors the EPPC UPS System Output Power. [ EPPC-MIB :: upsESystemOutputWatts : 1.3.6.1.4.1.935.10.1.1.2.18.1.5 ] | |
| eppc_ups_system_output_Load | EPPC UPS System Output Load | % | Monitors the EPPC UPS System Output Load. [ EPPC-MIB :: upsESystemOutputLoad : 1.3.6.1.4.1.935.10.1.1.2.18.1.7 ] | |
| eppc_ups_system_Status | EPPC UPS System Status | Monitors the EPPC UPS System Status. [ EPPC-MIB :: upsESystemStatus : 1.3.6.1.4.1.935.10.1.1.2.1.0 ] Possible values are 1 : power-on, 2 : stand-by, 3 : by-pass, 4 : line, 5 : battery, 6 : battery-test, 7 : fault, 8 : converter, 9 : eco, 10 : shutdown, 11 : on-booster, 12 : on-reducer, 13 : other | ||
| eppc_ups_system_Temperature | EPPC UPS System Temperature | Celsius | Monitors the EPPC UPS System Temperature. The temperature of UPS presented in 0.1 degree. [ EPPC-MIB :: upsESystemTemperature : 1.3.6.1.4.1.935.10.1.1.2.2 ] |
EMC RPA Cluster Performance
Description
EMC RPA Cluster Performance.
Prerequisites
No prerequisite
Supported Metric
| Monitor Name | Metric Name | Metric Display Name | Unit | Description |
|---|---|---|---|---|
| EMC RPA Cluster Performance Monitor | storage.emcrpa.cluster.traffic.applicationthroughputstatistics.applicationincomingwrites | EMCRPA Cluster Traffic Application IncomingWrites | NULL | EMCRPA Cluster Traffic Application IncomingWrites |
| storage.emcrpa.cluster.traffic.applicationthroughputstatistics.inthroughput | EMCRPA Cluster Traffic Application InThroughput | Mbps | EMCRPA Cluster Traffic Application InThroughput | |
| storage.emcrpa.cluster.traffic.connectionscompressionratio.compressionratio | EMCRPA Cluster Traffic Connections CompressionRatio | NULL | EMCRPA Cluster Traffic Connections CompressionRatio | |
| storage.emcrpa.cluster.traffic.initthroughputstatistics.connectionsoutthroughput.outthroughput | EMCRPA Cluster Traffic Connection OutThroughput | Mbps | EMCRPA Cluster Traffic Connection OutThroughput | |
| storage.emcrpa.cluster.traffic.initthroughputstatistics.inthroughput | EMCRPA Cluster Traffice InThroughput | Mbps | EMCRPA Cluster Traffice InThroughput | |
| storage.emcrpa.cluster.traffic.applicationthroughputstatistics.connectionsoutthroughput | EMCRPA Cluster Traffic Connections OutThroughput | Mbps | EMCRPA Cluster Traffic Connections OutThroughput |
EMC RPA Consistency Group Performance
Description
EMC RPA Consistency Group Performance
Prerequisites
No prerequisite
Supported Metric
| Monitor Name | Metric Name | Metric Display Name | Unit | Description |
|---|---|---|---|---|
| EMC RPA Consistency Group Performance Monitor | storage.emcrpa.consistencygroupcopystatistics.averageIncomingThroughput | EMCRPA ConsistencyGroup Average IncomingThroughput | Mbps | EMCRPA ConsistencyGroup Average IncomingThroughput |
| storage.emcrpa.consistencygroupcopystatistics.averageincomingwrites | EMCRPA ConsitencyGroup Average IncomingWrites | NULL | EMCRPA ConsitencyGroup Average IncomingWrites | |
| storage.emcrpa.consistencygroupcopystatistics.incomingThroughput | EMCRPA ConsistencyGroup IncomingThroughput | Mbps | EMCRPA ConsistencyGroup IncomingThroughput | |
| storage.emcrpa.consistencygroupcopystatistics.incomingWrites | EMCRPA ConsitencyGroup IncomingWrites | NULL | EMCRPA ConsitencyGroup IncomingWrites | |
| storage.emcrpa.consistencygroupcopystatistics.journalstatistics.distributionfinished | EMCRPA ConsistencyGroup Distribution Finished State | NULL | EMCRPA ConsistencyGroup Distribution Finished State | |
| storage.emcrpa.consistencygroupcopystatistics.journalStatistics.imageAccessSizeLeftInBytes | EMCRPA ConsistencyGroup Journal Image Access Size Left in Bytes | Bytes | EMCRPA ConsistencyGroup Journal Image Access Size Left in Bytes | |
| storage.emcrpa.consistencygroupcopystatistics.journalstatistics.imageaccesstimeleftinseconds | EMCRPA ConsitencyGroup Image Access Time Left | s | EMCRPA ConsitencyGroup Image Access Time Left | |
| storage.emcrpa.consistencygroupcopystatistics.journalstatistics.imageaccesstotalsizeinbytes | EMCRPA ConsistencyGroup Image Access Total Size | Bytes | EMCRPA ConsistencyGroup Image Access Total Size | |
| storage.emcrpa.consistencygroupcopystatistics.journalstatistics.tspusagepercentage | EMCRPA ConsistencyGroup Tsp Usage Percentage | % | EMCRPA ConsistencyGroup Tsp Usage Percentage | |
| storage.emcrpa.consistencygroupcopystatistics.journalstatistics.tspusageinbytes | EMCRPA ConsistencyGroup Tsp Usage in Bytes | Bytes | EMCRPA ConsistencyGroup Tsp Usage in Bytes | |
| storage.emcrpa.consistencygroupcopystatistics.journalstatistics.journallaginbytes | EMCRPA ConsistencyGroup Journal Lag in Bytes | Bytes | EMCRPA ConsistencyGroup Journal Lag in Bytes | |
| storage.emcrpa.consistencygroupcopystatistics.journalstatistics.consolidationstatistics.savedSpace | EMCRPA ConsistencyGroup Journal SavedSpace | NULL | EMCRPA ConsistencyGroup Journal SavedSpace | |
| storage.emcrpa.consistencygroupcopystatistics.journal.consolidation.percentageOfSavedSpace | EMCRPA ConsitencyGroup Journal Consolidation SavedSpace Percentage | % | EMCRPA ConsitencyGroup Journal Consolidation SavedSpace Percentage | |
| storage.emcrpa.consistencygroupcopystatistics.journalstatistics.fastforward | EMCRPA ConsitencyGroup Journal FastForword State | NULL | EMCRPA ConsitencyGroup Journal FastForword State | |
| storage.emcrpa.consistencygroupcopystatistics.journalstatistics.movingfrom.timeinmicroseconds | EMCRPA ConsistencyGroup Move From Time | microsec | EMCRPA ConsistencyGroup Move From Time | |
| storage.emcrpa.consistencygroupcopystatistics.journalstatistics.movingto.timeinmicroseconds | EMCRPA ConsistencyGroup Move To Time | microsec | EMCRPA ConsistencyGroup Move To Time | |
| storage.emcrpa.consistencygroupcopystatistics.journalstatistics.actualjournalsizeinbytes | EMCRPA ConsitencyGroup Actual JournalSize in Bytes | Bytes | EMCRPA ConsitencyGroup Actual JournalSize in Bytes | |
| storage.emcrpa.consistencygroupcopystatistics.journalstatistics.actualjournalusageinbytes | EMCRPA ConsistencyGroup Actual Journal Usage in Bytes | Bytes | EMCRPA ConsistencyGroup Actual Journal Usage in Bytes | |
| storage.emcrpa.consistencygrouplinkstatistics.initstatistics.initcompletionportion | EMCRPA ConsistencyGroup Init Completion Portion | NULL | EMCRPA ConsistencyGroup Init Completion Portion | |
| storage.emcrpa.consistencygrouplinkstatistics.initstatistics.initincomingthroughput | EMCRPA ConsistencyGroup Init IncomingThroughput | Mbps | EMCRPA ConsistencyGroup Init IncomingThroughput | |
| storage.emcrpa.consistencygrouplinkstatistics.initstatistics.initoutgoingthroughput | EMCRPA ConsistencyGroup Link Init OutgoingThroughput | Mbps | EMCRPA ConsistencyGroup Link Init OutgoingThroughput | |
| storage.emcrpa.consistencygrouplinkstatistics.initstatistics.numberOfgrids | EMCRPA ConsistencyGroup Link Init Grid Count | NULL | EMCRPA ConsistencyGroup Link Init Grid Count | |
| storage.emcrpa.consistencygrouplinkstatistics.pipestatistics.averagejournalcompressionratio | EMCRPA ConsistencyGroup Pipe Average Journal CompressionRatio | NULL | EMCRPA ConsistencyGroup Pipe Average Journal CompressionRatio | |
| storage.emcrpa.consistencygrouplinkstatistics.pipestatistics.compressionratio | EMCRPA ConsistencyGroup Pipe CompressionRatio | NULL | EMCRPA ConsistencyGroup Pipe CompressionRatio | |
| storage.emcrpa.consistencygrouplinkstatistics.pipestatistics.detachdatarate | EMCRPA ConsistencyGroup Link Pipe Detach Data | NULL | EMCRPA ConsistencyGroup Link Pipe Detach Data | |
| storage.emcrpa.consistencygrouplinkstatistics.pipestatistics.detachdata | EMCRPA ConsistencyGroup Link Detach Data | NULL | EMCRPA ConsistencyGroup Link Detach Data | |
| storage.emcrpa.consistencygrouplinkstatistics.pipestatistics.transactioncounter | EMCRPA ConsistencyGroup Link Pipe Transaction Counter | NULL | EMCRPA ConsistencyGroup Link Pipe Transaction Counter | |
| storage.emcrpa.consistencygrouplinkstatistics.pipestatistics.timecounter | EMCRPA ConsistencyGroup Link TimeCounter | NULL | EMCRPA ConsistencyGroup Link TimeCounter | |
| storage.emcrpa.consistencygrouplinkstatistics.pipestatistics.datacounter | EMCRPA ConsistencyGroup Pipe Datacounter | NULL | EMCRPA ConsistencyGroup Pipe Datacounter | |
| storage.emcrpa.consistencygrouplinkstatistics.pipestatistics.numberofgrids | EMCRPA ConsistencyGroup Link Pipe Grid Count | NULL | EMCRPA ConsistencyGroup Link Pipe Grid Count | |
| storage.emcrpa.consistencygrouplinkstatistics.pipestatistics.outgoingthroughput | EMCRPA ConsistencyGroup Link Pipe Outgoing Throughput | Mbps | EMCRPA ConsistencyGroup Link Pipe Outgoing Throughput | |
| storage.emcrpa.consistencygrouplinkstatistics.pipestatistics.replicationmode | EMCRPA ConsistencyGroup Link ReplicationMode | EMCRPA ConsistencyGroup Link ReplicationMode | ||
| storage.emcrpa.consistencygrouplinkstatistics.pipestatistics.syncremotelink | EMCRPA ConsistencyGroup Sync RemoteLink | NULL | EMCRPA ConsistencyGroup Sync RemoteLink | |
| storage.emcrpa.consistencygrouplinkstatistics.pipestatistics.deduplicationratio | EMCRPA ConsistencyGroup Link DeduplicationRatio | NULL | EMCRPA ConsistencyGroup Link DeduplicationRatio | |
| storage.emcrpa.consistencyGroupLinkStatistics.pipe.averageDeduplicationRatioss | EMCRPA ConsistencyGroupLink Pipe Deduplication Average Ratio | NULL | EMCRPA ConsistencyGroupLink Pipe Deduplication Average Ratio |
EMCRPA RPA Performance
Description
EMCRPA RPA Performance
Prerequisites
No prerequisite
Supported Metric
| Monitor Name | Metric Name | Metric Display Name | Unit | Description |
|---|---|---|---|---|
| EMCRPA RPA Performance Monitor | storage.emcrpa.rpa.cpuusage | EMCRPA RPA Cpu Usage | % | EMCRPA RPA Cpu Usage |
| storage.emcrpa.rpa.traffic.applicationthroughputstatistics.applicationincomingwrites | EMCRPA RPA Traffic Application IncomingWrites | NULL | EMCRPA RPA Traffic Application IncomingWrites | |
| storage.emcrpa.rpa.traffic.applicationthroughputstatistics.connectionsoutthroughput.outthroughput | EMCRPA RPA Traffic Application Connections OutThroughput | Mbps | EMCRPA RPA Traffic Application Connections OutThroughput | |
| storage.emcrpa.rpa.traffic.applicationthroughputstatistics.inthroughput | EMCRPA RPA Traffic Application InThroughput | Mbps | EMCRPA RPA Traffic Application InThroughput | |
| storage.emcrpa.rpa.traffic.connectionscompressionratio.compressionratio | EMCRPA RPA Traffic CompressionRatio | NULL | EMCRPA RPA Traffic CompressionRatio | |
| storage.emcrpa.rpa.traffic.initthroughputstatistics.connectionsoutthroughput.outthroughput | EMCRPA RPA Traffic Init Connections OutThroughput | Mbps | EMCRPA RPA Traffic Init Connections OutThroughput | |
| storage.emcrpa.rpa.traffic.initthroughputstatistics.inthroughput | EMCRPA RPA Traffic InThroughput | Mbps | EMCRPA RPA Traffic InThroughput |
Enterasys CTRON Chassis Monitors - G2
Description
Applicable on the Enterasys Networks C5 and B5. Monitors CTRON Chassis Fan Module State,power supply state etc. Can be applied on Enterasys Networks,Inc. C5G124-24P2 Rev 06.71.04.0004. SNMP Obj Id=1.3.6.1.4.1.5624.2.1.143.
Prerequisites
No prerequisite
Supported Metric
| Monitor Name | Metric Name | Metric Display Name | Unit | Description |
|---|---|---|---|---|
| CTRON Chassis Environment Fan Status | ctron.chassis.environment.fan.state | CTRON Chassis Environment Fan State | Monitors the status of the chassis fan. Possible values are 1- unknown,2- normal,3- testing,4- slow,5- inoperative,6- off.[OIDs: 1.3.6.1.4.1.52.4.1.1.8.1.12.1.1,1.3.6.1.4.1.52.4.1.1.8.1.12.1.3,1.3.6.1.4.1.52.4.1.1.8.1.12.1.2] | |
| CTRON Chassis Fan Module State | ctron.chassis.fan.module.state | CTRON Chassis Fan Module State | Monitors the fan modules state. Possible status values are 1- infoNotAvailable,2- notInstalled,3- installedAndOperating,4- installedAndNotOperating.[OIDs: 1.3.6.1.4.1.52.4.3.1.3.1.1.1,1.3.6.1.4.1.52.4.3.1.3.1.1.2] | |
| CTRON Chassis Power Supply State | ctron.chassis.power.supply.state | CTRON Chassis Power Supply State | Monitors the power supply's state. Possible values are 1- infoNotAvailable,2- notInstalled,3- installedAndOperating,4- installedAndNotOperating.[OIDs: 1.3.6.1.4.1.52.4.3.1.2.1.1.1,1.3.6.1.4.1.52.4.3.1.2.1.1.2] |
Entity Operational State
Description
Template to monitors the entities (like Fan,Power,Temperature,Voltage etc.) operational status [ENTITY-MIB :: entPhysicalName : 1.3.6.1.2.1.47.1.1.1.1.7,ENTITY-STATE-MIB :: entStateOper : 1.3.6.1.2.1.131.1.1.1.3]
Prerequisites
No prerequisite
Supported Metric
| Monitor Name | Metric Name | Metric Display Name | Unit | Description |
|---|---|---|---|---|
| Entity Operational State | entity_operational_state | Entity Operational State | Monitors the entities (like Fan,Power,Temperature,Voltage etc.) operational status. Possible values for the operational status are: 1-unknown,2-inoperable,3-operable,4-testing.[ENTITY-MIB :: entPhysicalName : 1.3.6.1.2.1.47.1.1.1.1.7,ENTITY-STATE-MIB :: entStateOper : 1.3.6.1.2.1.131.1.1.1.3] |
Entity Physical Sensor Reading and Status - Ext
Description
Template to monitor entity physical sensors (like electric potential ac,electric potential dc,electric current,power,frequency,temperature,percent relative humidity,shaft revolutions per minute and cubic meters per minute (airflow)) values and their operational statuses. Prerequisites: Device should support ENTITY-SENSOR-MIB,ENTITY-MIB and their tables like entPhySensorType-1.3.6.1.2.1.99.1.1.1.1,entPhySensorScale-1.3.6.1.2.1.99.1.1.1.2,entPhySensorPrecision-1.3.6.1.2.1.99.1.1.1.3,entPhySensorValue-1.3.6.1.2.1.99.1.1.1.4,entPhySensorOperStatus-1.3.6.1.2.1.99.1.1.1.5,entPhysicalName-1.3.6.1.2.1.47.1.1.1.1.7
Prerequisites
No prerequisite
Supported Metric
| Monitor Name | Metric Name | Metric Display Name | Unit | Description |
|---|---|---|---|---|
| Entity Physical Sensor Reading and Status - Ext | ent.physical.sensor.frequency | Frequency | Hz | It represents an Entity Frequency Sensor value.[ENTITY-SENSOR-MIB::OIDs: 1.3.6.1.2.1.47.1.1.1.1.7,1.3.6.1.2.1.99.1.1.1.1,1.3.6.1.2.1.99.1.1.1.2,1.3.6.1.2.1.99.1.1.1.3,1.3.6.1.2.1.99.1.1.1.4] |
| ent.physical.sensor.relative.humidity | Relative Humidity(RH) % | % | It represents an Entity Relative Humidity(RH) Sensor value.[ENTITY-SENSOR-MIB::OIDs: 1.3.6.1.2.1.47.1.1.1.1.7,1.3.6.1.2.1.99.1.1.1.1,1.3.6.1.2.1.99.1.1.1.2,1.3.6.1.2.1.99.1.1.1.3,1.3.6.1.2.1.99.1.1.1.4] | |
| ent.physical.sensor.electric.current | Electric Current | amps | It represents an Entity Electric Current Sensor value.[ENTITY-SENSOR-MIB::OIDs: 1.3.6.1.2.1.47.1.1.1.1.7,1.3.6.1.2.1.99.1.1.1.1,1.3.6.1.2.1.99.1.1.1.2,1.3.6.1.2.1.99.1.1.1.3,1.3.6.1.2.1.99.1.1.1.4] | |
| ent.physical.sensor.rpm | RPM | rpm | It represents an Entity RPM Sensor value.[ENTITY-SENSOR-MIB::OIDs: 1.3.6.1.2.1.47.1.1.1.1.7,1.3.6.1.2.1.99.1.1.1.1,1.3.6.1.2.1.99.1.1.1.2,1.3.6.1.2.1.99.1.1.1.3,1.3.6.1.2.1.99.1.1.1.4] | |
| ent.physical.sensor.power | Power | W | It represents an Entity Power Sensor value.[ENTITY-SENSOR-MIB::OIDs: 1.3.6.1.2.1.47.1.1.1.1.7,1.3.6.1.2.1.99.1.1.1.1,1.3.6.1.2.1.99.1.1.1.2,1.3.6.1.2.1.99.1.1.1.3,1.3.6.1.2.1.99.1.1.1.4] | |
| ent.physical.sensor.operational.status | Operational Status | Monitors the physical sensors (like Fan,Power,Temperature,Voltage etc.) operational status. Possible values for the operational status are: 1- ok: indicates that the agent can obtain the sensor value,2- unavailable: indicates that the agent presently cannot obtain the sensor value,3- nonoperational: indicates that the agent believes the sensor is broken. The sensor could have a hard failure (disconnected wire),or a soft failure such as out-of-range,jittery,or wildly fluctuating readings.[ENTITY-SENSOR-MIB::entPhySensorOperStatus-1.3.6.1.2.1.99.1.1.1.5,entPhysicalName-1.3.6.1.2.1.47.1.1.1.1.7] | ||
| ent.physical.sensor.electric.potential.dc | Electric Potential DC | v | It represents an Entity Electric Potential DC Sensor value.[ENTITY-SENSOR-MIB::OIDs: 1.3.6.1.2.1.47.1.1.1.1.7,1.3.6.1.2.1.99.1.1.1.1,1.3.6.1.2.1.99.1.1.1.2,1.3.6.1.2.1.99.1.1.1.3,1.3.6.1.2.1.99.1.1.1.4] | |
| ent.physical.sensor.electric.potential.ac | Electric Potential AC | v | It represents an Entity Electric Potential AC Sensor value.[ENTITY-SENSOR-MIB::OIDs: 1.3.6.1.2.1.47.1.1.1.1.7,1.3.6.1.2.1.99.1.1.1.1,1.3.6.1.2.1.99.1.1.1.2,1.3.6.1.2.1.99.1.1.1.3,1.3.6.1.2.1.99.1.1.1.4] | |
| ent.physical.sensor.airflow | Airflow (cmm) | It represents an Entity Cubic Meters per minute (airflow) Sensor value.[ENTITY-SENSOR-MIB::OIDs: 1.3.6.1.2.1.47.1.1.1.1.7,1.3.6.1.2.1.99.1.1.1.1,1.3.6.1.2.1.99.1.1.1.2,1.3.6.1.2.1.99.1.1.1.3,1.3.6.1.2.1.99.1.1.1.4] | ||
| ent.physical.sensor.temperature | Celsius | It represents an Entity Temperature Sensor value.[ENTITY-SENSOR-MIB::OIDs: 1.3.6.1.2.1.47.1.1.1.1.7,1.3.6.1.2.1.99.1.1.1.1,1.3.6.1.2.1.99.1.1.1.2,1.3.6.1.2.1.99.1.1.1.3,1.3.6.1.2.1.99.1.1.1.4] |
Entity Physical Sensor Reading and Status - Ext - Rev2
Description
Template to monitor entity physical sensors (like electric potential ac,electric potential dc,electric current,power,frequency,temperature,percent relative humidity,shaft revolutions per minute and cubic meters per minute (airflow)) values and their operational statuses. REVISION: 202107310000Z. Description: Enhanced the script to take entPhysicalDescr incase of empty entPhysicalName.
Prerequisites
No prerequisite
Supported Metric
| Monitor Name | Metric Name | Metric Display Name | Unit | Description |
|---|---|---|---|---|
| Entity Physical Sensor Reading and Status - Ext - Rev2 | ent.physical.sensor.frequency | Frequency | Hz | It represents an Entity Frequency Sensor value.[ENTITY-SENSOR-MIB::OIDs: 1.3.6.1.2.1.47.1.1.1.1.7,1.3.6.1.2.1.99.1.1.1.1,1.3.6.1.2.1.99.1.1.1.2,1.3.6.1.2.1.99.1.1.1.3,1.3.6.1.2.1.99.1.1.1.4] |
| ent.physical.sensor.relative.humidity | Relative Humidity(RH) % | % | It represents an Entity Relative Humidity(RH) Sensor value.[ENTITY-SENSOR-MIB::OIDs: 1.3.6.1.2.1.47.1.1.1.1.7,1.3.6.1.2.1.99.1.1.1.1,1.3.6.1.2.1.99.1.1.1.2,1.3.6.1.2.1.99.1.1.1.3,1.3.6.1.2.1.99.1.1.1.4] | |
| ent.physical.sensor.electric.current | Electric Current | amps | It represents an Entity Electric Current Sensor value.[ENTITY-SENSOR-MIB::OIDs: 1.3.6.1.2.1.47.1.1.1.1.7,1.3.6.1.2.1.99.1.1.1.1,1.3.6.1.2.1.99.1.1.1.2,1.3.6.1.2.1.99.1.1.1.3,1.3.6.1.2.1.99.1.1.1.4] | |
| ent.physical.sensor.rpm | RPM | rpm | It represents an Entity RPM Sensor value.[ENTITY-SENSOR-MIB::OIDs: 1.3.6.1.2.1.47.1.1.1.1.7,1.3.6.1.2.1.99.1.1.1.1,1.3.6.1.2.1.99.1.1.1.2,1.3.6.1.2.1.99.1.1.1.3,1.3.6.1.2.1.99.1.1.1.4] | |
| ent.physical.sensor.power | Power | W | It represents an Entity Power Sensor value.[ENTITY-SENSOR-MIB::OIDs: 1.3.6.1.2.1.47.1.1.1.1.7,1.3.6.1.2.1.99.1.1.1.1,1.3.6.1.2.1.99.1.1.1.2,1.3.6.1.2.1.99.1.1.1.3,1.3.6.1.2.1.99.1.1.1.4] | |
| ent.physical.sensor.operational.status | Operational Status | Monitors the physical sensors (like Fan,Power,Temperature,Voltage etc.) operational status. Possible values for the operational status are: 1- ok: indicates that the agent can obtain the sensor value,2- unavailable: indicates that the agent presently cannot obtain the sensor value,3- nonoperational: indicates that the agent believes the sensor is broken. The sensor could have a hard failure (disconnected wire),or a soft failure such as out-of-range,jittery,or wildly fluctuating readings.[ENTITY-SENSOR-MIB::entPhySensorOperStatus-1.3.6.1.2.1.99.1.1.1.5,entPhysicalName-1.3.6.1.2.1.47.1.1.1.1.7] | ||
| ent.physical.sensor.electric.potential.dc | Electric Potential DC | v | It represents an Entity Electric Potential DC Sensor value.[ENTITY-SENSOR-MIB::OIDs: 1.3.6.1.2.1.47.1.1.1.1.7,1.3.6.1.2.1.99.1.1.1.1,1.3.6.1.2.1.99.1.1.1.2,1.3.6.1.2.1.99.1.1.1.3,1.3.6.1.2.1.99.1.1.1.4] | |
| ent.physical.sensor.electric.potential.ac | Electric Potential AC | v | It represents an Entity Electric Potential AC Sensor value.[ENTITY-SENSOR-MIB::OIDs: 1.3.6.1.2.1.47.1.1.1.1.7,1.3.6.1.2.1.99.1.1.1.1,1.3.6.1.2.1.99.1.1.1.2,1.3.6.1.2.1.99.1.1.1.3,1.3.6.1.2.1.99.1.1.1.4] | |
| ent.physical.sensor.airflow | Airflow (cmm) | It represents an Entity Cubic Meters per minute (airflow) Sensor value.[ENTITY-SENSOR-MIB::OIDs: 1.3.6.1.2.1.47.1.1.1.1.7,1.3.6.1.2.1.99.1.1.1.1,1.3.6.1.2.1.99.1.1.1.2,1.3.6.1.2.1.99.1.1.1.3,1.3.6.1.2.1.99.1.1.1.4] | ||
| ent.physical.sensor.temperature | Celsius | It represents an Entity Temperature Sensor value.[ENTITY-SENSOR-MIB::OIDs: 1.3.6.1.2.1.47.1.1.1.1.7,1.3.6.1.2.1.99.1.1.1.1,1.3.6.1.2.1.99.1.1.1.2,1.3.6.1.2.1.99.1.1.1.3,1.3.6.1.2.1.99.1.1.1.4] |
Entity Physical Sensor Status
Description
Monitors the entity physical sensors (like Fan,Power,Temperature,Voltage etc.) operational status and their most recently measured values.[OIDs: 1.3.6.1.2.1.47.1.1.1.1.7,1.3.6.1.2.1.99.1.1.1.4,1.3.6.1.2.1.99.1.1.1.5,1.3.6.1.2.1.99.1.1.1.6]
Prerequisites
No prerequisite
Supported Metric
| Monitor Name | Metric Name | Metric Display Name | Unit | Description |
|---|---|---|---|---|
| Entity Physical Sensor Status | physical.sensor.operational.status | Physical Sensor Operational Status | Monitors the physical sensors (like Fan,Power,Temperature,Voltage etc.) operational status and their most recently measured values. Possible values for the operational status are: 1- ok: indicates that the agent can obtain the sensor value,2- unavailable: indicates that the agent presently cannot obtain the sensor value,3- nonoperational: indicates that the agent believes the sensor is broken. The sensor could have a hard failure (disconnected wire),or a soft failure such as out-of-range,jittery,or wildly fluctuating readings.[OIDs: 1.3.6.1.2.1.99.1.1.1.4,1.3.6.1.2.1.99.1.1.1.5,1.3.6.1.2.1.99.1.1.1.6] |
Ethernet-like Interface PAUSE Stats
Description
Monitors the MAC Control frames received and transmitted through ethernet-like interfaces with an opcode indicating the PAUSE operation.
Prerequisites
No prerequisite
Supported Metric
| Monitor Name | Metric Name | Metric Display Name | Unit | Description |
|---|---|---|---|---|
| Ethernet-like Interfaces PAUSE Stats | network.interface.pause.frames.in | PAUSE In Frames | psec | Represents the MAC Control frames received on this interface with an opcode indicating the PAUSE operation.[OIDs: 1.3.6.1.2.1.10.7.10.1.3,1.3.6.1.2.1.10.7.10.1.5] |
| network.interface.pause.frames.out | PAUSE Out Frames | psec | Represents the MAC Control frames transmitted on this interface with an opcode indicating the PAUSE operation.[OIDs: 1.3.6.1.2.1.10.7.10.1.4,1.3.6.1.2.1.10.7.10.1.6] |
Extreme Enterasys - Hardware Monitoring
Description
This template is applicable on Extreme Enterasys devices. Monitors the basic parameters like fan and power supply status.
Prerequisites
No prerequisite
Supported Metric
| Monitor Name | Metric Name | Metric Display Name | Unit | Description |
|---|---|---|---|---|
| Extreme Enterasys FAN Status | extreme.enterasys.fan.state | Extreme Enterasys FAN Status | Monitors the FAN module status.[OID: 1.3.6.1.4.1.52.4.3.1.3.1.1.1,1.3.6.1.4.1.52.4.3.1.3.1.1.2]. | |
| Extreme Enterasys Power Supply Status | extreme.enterasys.power.supply.state | Extreme Enterasys Power Supply Status | Monitors the Power suply state.[OID: 1.3.6.1.4.1.52.4.3.1.2.1.1.1,1.3.6.1.4.1.52.4.3.1.2.1.1.2] |
Extreme Enterasys - Performance
Description
This template is applicable on Extreme Enterasys devices. Monitors the basic parameters like CPU utilization,memory utilization.
Prerequisites
No prerequisite
Supported Metric
| Monitor Name | Metric Name | Metric Display Name | Unit | Description |
|---|---|---|---|---|
| Extreme Enterasys - Memory Utilization | extreme_enterasys_memory_Utilization | Extreme Enterasys Memory Utilization | % | It monitors the extreme enterasys memory utilization.[etsysResourceStorageSize:1.3.6.1.4.1.5624.1.2.49.1.3.1.1.4,etsysResourceStorageAvailable:1.3.6.1.4.1.5624.1.2.49.1.3.1.1.5] |
| Extreme Enterasys CPU Utilization | extreme.enterasys.cpu.utilization | Extreme Enterasys CPU Utilization | % | Monitors the Enterasys switch average processor CPU over the last 1min.[OID: 1.3.6.1.4.1.5624.1.2.49.1.1.1.1.3]. |
Extreme VSP 7200 Series
Description
Template to monitor Extreme VSP 7200 Series Switches . It monitors Power Supply Status,2k Card Operational Status,VOSS System Sensor Temperature,VOSS System Temperature Status,CPU Utilization,Memory Utilization,CP System CPU Temperature,CP System MAC Temperature,CP System PHY1 Temperature,CP System PHY2 Temperature,CP System MAC2 Temperature.
Prerequisites
Device should have support for RAPID-CITY.mib
Supported Metric
| Monitor Name | Metric Name | Metric Display Name | Unit | Description |
|---|---|---|---|---|
| Extreme - 2k Card Operational Status | extreme.2k.card.operational.status | 2k Card Operational Status | It monitors the Extreme 2k card operational status. Possible values are 1 - up,2 - down,3 - testing,4 - unknown,5 - dormant,6 - upMaster,7 - upDormant,8 - upWarmstandby.[RAPID-CITY.mib::rc2kCardFrontOperStatus - 1.3.6.1.4.1.2272.1.100.6.1.5] | |
| Extreme - Power Supply Status | extreme.chassis.power.supply.status | Power Supply Status | It monitors the Extreme power supply status. Possible values are 1 - unknown(status can not be determined),2 - up(present and supplying power),3 - down(present,but failure indicated) [RAPID-CITY.mib::rcChasPowerSupplyOperStatus - 1.3.6.1.4.1.2272.1.4.8.1.1.2] | |
| Extreme - Single CP System | extreme.cp.system.cpu.temperature | CP System CPU Temperature | Celsius | It monitors the temperature in celsius of the air near CPU area.[RAPID-CITY.mib::rcSingleCpSystemCpuTemperature - 1.3.6.1.4.1.2272.1.212.1] |
| extreme.cp.system.mac.temperature | CP System MAC Temperature | Celsius | It monitors the temperature in celsius of the air near MAC area.[RAPID-CITY.mib::rcSingleCpSystemMacTemperature - 1.3.6.1.4.1.2272.1.212.2] | |
| extreme.cp.system.phy1.temperature | CP System PHY1 Temperature | Celsius | It monitors the temperature in celsius of the air near PHY1 area.[RAPID-CITY.mib::rcSingleCpSystemPhy1Temperature - 1.3.6.1.4.1.2272.1.212.3] | |
| extreme.cp.system.phy2.temperature | CP System PHY2 Temperature | Celsius | It monitors the temperature in celsius of the air near PHY2 area.[RAPID-CITY.mib::rcSingleCpSystemPhy2Temperature - 1.3.6.1.4.1.2272.1.212.4] | |
| extreme.cp.system.mac2.temperature | CP System MAC2 Temperature | Celsius | It monitors the temperature in celsius of the air near MAC2 area.[RAPID-CITY.mib::rcSingleCpSystemMac2Temperature - 1.3.6.1.4.1.2272.1.212.5] | |
| Extreme - Slot Performance | extreme.cpu.utilization | CPU Utilization | % | It monitors the Extreme CPU utilization in percentage [RAPID-CITY.mib::rcKhiSlotCpuCurrentUtil - 1.3.6.1.4.1.2272.1.85.10.1.1.2] |
| extreme.memory.utilization | Memory Utilization | % | It monitors the extreme memory utilization in percentage.[RAPID-CITY.mib::rcKhiSlotMemUtil - 1.3.6.1.4.1.2272.1.85.10.1.1.8] | |
| Extreme - VOSS System Sensor Temperature | extreme.voss.system.sensor.temperature | VOSS System Sensor Temperature | Celsius | It monitors the Extreme VOSS(VSP Operating System Software) system sensor temperature value.[RAPID-CITY.mib::rcVossSystemTemperatureTemperature - 1.3.6.1.4.1.2272.1.101.1.1.2.1.3] |
| extreme.voss.system.temperature.status | VOSS System Temperature Status | It monitors the Extreme VOSS system temperature status. Possible values are 1 - normal,2 - highWarning,3 - highCritial.[RAPID-CITY.mib::rcVossSystemTemperatureStatus - 1.3.6.1.4.1.2272.1.101.1.1.2.1.6]. |
Extreme VSP 8400 Series
Description
Template to monitor Extreme VSP 8400 Series Switches . It monitors Power Supply Status,RSMLT Operational Status,RSMLT Peer Operational Status,2k Card Operational Status,VOSS System Sensor Temperature,VOSS System Temperature Status,CPU Utilization,Memory Utilization,CP System CPU Temperature,CP System MAC Temperature,CP System PHY1 Temperature,CP System PHY2 Temperature,CP System MAC2 Temperature.
Prerequisites
Device should have support for RAPID-CITY.mib
Supported Metric
| Monitor Name | Metric Name | Metric Display Name | Unit | Description |
|---|---|---|---|---|
| Extreme - 2k Card Operational Status | extreme.2k.card.operational.status | 2k Card Operational Status | It monitors the Extreme 2k card operational status. Possible values are 1 - up,2 - down,3 - testing,4 - unknown,5 - dormant,6 - upMaster,7 - upDormant,8 - upWarmstandby.[RAPID-CITY.mib::rc2kCardFrontOperStatus - 1.3.6.1.4.1.2272.1.100.6.1.5] | |
| Extreme - Power Supply Status | extreme.chassis.power.supply.status | Power Supply Status | It monitors the Extreme power supply status. Possible values are 1 - unknown(status can not be determined),2 - up(present and supplying power),3 - down(present,but failure indicated) [RAPID-CITY.mib::rcChasPowerSupplyOperStatus - 1.3.6.1.4.1.2272.1.4.8.1.1.2] | |
| Extreme - Single CP System | extreme.cp.system.cpu.temperature | CP System CPU Temperature | Celsius | It monitors the temperature in celsius of the air near CPU area.[RAPID-CITY.mib::rcSingleCpSystemCpuTemperature - 1.3.6.1.4.1.2272.1.212.1] |
| extreme.cp.system.mac.temperature | CP System MAC Temperature | Celsius | It monitors the temperature in celsius of the air near MAC area.[RAPID-CITY.mib::rcSingleCpSystemMacTemperature - 1.3.6.1.4.1.2272.1.212.2] | |
| extreme.cp.system.phy1.temperature | CP System PHY1 Temperature | Celsius | It monitors the temperature in celsius of the air near PHY1 area.[RAPID-CITY.mib::rcSingleCpSystemPhy1Temperature - 1.3.6.1.4.1.2272.1.212.3] | |
| extreme.cp.system.phy2.temperature | CP System PHY2 Temperature | Celsius | It monitors the temperature in celsius of the air near PHY2 area.[RAPID-CITY.mib::rcSingleCpSystemPhy2Temperature - 1.3.6.1.4.1.2272.1.212.4] | |
| extreme.cp.system.mac2.temperature | CP System MAC2 Temperature | Celsius | It monitors the temperature in celsius of the air near MAC2 area.[RAPID-CITY.mib::rcSingleCpSystemMac2Temperature - 1.3.6.1.4.1.2272.1.212.5] | |
| Extreme - Slot Performance | extreme.cpu.utilization | CPU Utilization | % | It monitors the Extreme CPU utilization in percentage [RAPID-CITY.mib::rcKhiSlotCpuCurrentUtil - 1.3.6.1.4.1.2272.1.85.10.1.1.2] |
| extreme.memory.utilization | Memory Utilization | % | It monitors the extreme memory utilization in percentage.[RAPID-CITY.mib::rcKhiSlotMemUtil - 1.3.6.1.4.1.2272.1.85.10.1.1.8] | |
| Extreme - VOSS System Sensor Temperature | extreme.voss.system.sensor.temperature | VOSS System Sensor Temperature | Celsius | It monitors the Extreme VOSS(VSP Operating System Software) system sensor temperature value.[RAPID-CITY.mib::rcVossSystemTemperatureTemperature - 1.3.6.1.4.1.2272.1.101.1.1.2.1.3] |
| extreme.voss.system.temperature.status | VOSS System Temperature Status | It monitors the Extreme VOSS system temperature status. Possible values are 1 - normal,2 - highWarning,3 - highCritial.[RAPID-CITY.mib::rcVossSystemTemperatureStatus - 1.3.6.1.4.1.2272.1.101.1.1.2.1.6]. | ||
| Extreme - RSMLT Operational Status | extreme.rsmlt.operational.status | RSMLT Operational Status | It monitors the Extreme RSMLT operational status. Possible values are 1 - up,2 - down [RAPID-CITY.mib::rcIpRsmltOperOperStatus - 1.3.6.1.4.1.2272.1.8.26.2.1.8]. | |
| Extreme - RSMLT Peer Operational Status | extreme.rsmlt.peer.operational.status | RSMLT Peer Operational Status | It monitors the Extreme RSMLT peer operational status. Possible values are 1 - up,2 - down [RAPID-CITY.mib::rcIpRsmltPeerOperStatus - 1.3.6.1.4.1.2272.1.8.26.3.1.8]. |
Extreme VSP 8600 Series
Description
Template to monitor Extreme VSP 8600 Series Switches . It monitors Power Supply Status,RSMLT Operational Status,RSMLT Peer Operational Status,2k Card Operational Status,VOSS System Sensor Temperature,VOSS System Temperature Status,CPU Utilization,Memory Utilization,CP System CPU Temperature,CP System MAC Temperature,CP System PHY1 Temperature,CP System PHY2 Temperature,CP System MAC2 Temperature.
Prerequisites
Device should have support for RAPID-CITY.mib
Supported Metric
| Monitor Name | Metric Name | Metric Display Name | Unit | Description |
|---|---|---|---|---|
| Extreme - 2k Card Operational Status | extreme.2k.card.operational.status | 2k Card Operational Status | It monitors the Extreme 2k card operational status. Possible values are 1 - up,2 - down,3 - testing,4 - unknown,5 - dormant,6 - upMaster,7 - upDormant,8 - upWarmstandby.[RAPID-CITY.mib::rc2kCardFrontOperStatus - 1.3.6.1.4.1.2272.1.100.6.1.5] | |
| Extreme - Power Supply Status | extreme.chassis.power.supply.status | Power Supply Status | It monitors the Extreme power supply status. Possible values are 1 - unknown(status can not be determined),2 - up(present and supplying power),3 - down(present,but failure indicated) [RAPID-CITY.mib::rcChasPowerSupplyOperStatus - 1.3.6.1.4.1.2272.1.4.8.1.1.2] | |
| Extreme - Single CP System | extreme.cp.system.cpu.temperature | CP System CPU Temperature | Celsius | It monitors the temperature in celsius of the air near CPU area.[RAPID-CITY.mib::rcSingleCpSystemCpuTemperature - 1.3.6.1.4.1.2272.1.212.1] |
| extreme.cp.system.mac.temperature | CP System MAC Temperature | Celsius | It monitors the temperature in celsius of the air near MAC area.[RAPID-CITY.mib::rcSingleCpSystemMacTemperature - 1.3.6.1.4.1.2272.1.212.2] | |
| extreme.cp.system.phy1.temperature | CP System PHY1 Temperature | Celsius | It monitors the temperature in celsius of the air near PHY1 area.[RAPID-CITY.mib::rcSingleCpSystemPhy1Temperature - 1.3.6.1.4.1.2272.1.212.3] | |
| extreme.cp.system.phy2.temperature | CP System PHY2 Temperature | Celsius | It monitors the temperature in celsius of the air near PHY2 area.[RAPID-CITY.mib::rcSingleCpSystemPhy2Temperature - 1.3.6.1.4.1.2272.1.212.4] | |
| extreme.cp.system.mac2.temperature | CP System MAC2 Temperature | Celsius | It monitors the temperature in celsius of the air near MAC2 area.[RAPID-CITY.mib::rcSingleCpSystemMac2Temperature - 1.3.6.1.4.1.2272.1.212.5] | |
| Extreme - Slot Performance | extreme.cpu.utilization | CPU Utilization | % | It monitors the Extreme CPU utilization in percentage [RAPID-CITY.mib::rcKhiSlotCpuCurrentUtil - 1.3.6.1.4.1.2272.1.85.10.1.1.2] |
| extreme.memory.utilization | Memory Utilization | % | It monitors the extreme memory utilization in percentage.[RAPID-CITY.mib::rcKhiSlotMemUtil - 1.3.6.1.4.1.2272.1.85.10.1.1.8] | |
| Extreme - VOSS System Sensor Temperature | extreme.voss.system.sensor.temperature | VOSS System Sensor Temperature | Celsius | It monitors the Extreme VOSS(VSP Operating System Software) system sensor temperature value.[RAPID-CITY.mib::rcVossSystemTemperatureTemperature - 1.3.6.1.4.1.2272.1.101.1.1.2.1.3] |
| extreme.voss.system.temperature.status | VOSS System Temperature Status | It monitors the Extreme VOSS system temperature status. Possible values are 1 - normal,2 - highWarning,3 - highCritial.[RAPID-CITY.mib::rcVossSystemTemperatureStatus - 1.3.6.1.4.1.2272.1.101.1.1.2.1.6]. | ||
| Extreme - RSMLT Operational Status | extreme.rsmlt.operational.status | RSMLT Operational Status | It monitors the Extreme RSMLT operational status. Possible values are 1 - up,2 - down [RAPID-CITY.mib::rcIpRsmltOperOperStatus - 1.3.6.1.4.1.2272.1.8.26.2.1.8]. | |
| Extreme - RSMLT Peer Operational Status | extreme.rsmlt.peer.operational.status | RSMLT Peer Operational Status | It monitors the Extreme RSMLT peer operational status. Possible values are 1 - up,2 - down [RAPID-CITY.mib::rcIpRsmltPeerOperStatus - 1.3.6.1.4.1.2272.1.8.26.3.1.8]. |
Extreme WiNG - Access Point
Description
Template to monitor Extreme WiNG access point performance and statistics like Global Client Count,Global Client Count,CPU Load (%),Online Radios Count,Device Online Status,Radio Traffic and RF Statistics on AP,Radio Traffic and RF Statistics on RF Domain,AP Fault Detection,AP Radio,RF Domain Radio,RF Domain - WLAN. Validated on AP7632. sysObjectID : 1.3.6.1.4.1.388.50.1.1.54.
Prerequisites
The device should have support for WING-MIB.
Supported Metric
| Monitor Name | Metric Name | Metric Display Name | Unit | Description |
|---|---|---|---|---|
| Extreme WiNG - AP Fault Detection | extreme.wing.ap.fault.detection | AP Fault Detection | It monitors whether any fault has been detected on the AP.Possible value are true(1),false(2).[WING-MIB::wingStatsDevWlApInfoFaultDetected:1.3.6.1.4.1.388.50.1.4.2.25.1.1.1.2]. | |
| Extreme WiNG - AP Radio | extreme.wing.ap.radio.state | AP Radio State | It monitors the radio state.Possible values are On(1),Off(2).[WING-MIB::wingStatsDevWlRadioState:1.3.6.1.4.1.388.50.1.4.2.25.9.1.1.9]. | |
| extreme.wing.ap.radio.power | AP Radio Power | dBm | It monitors the current power the radio is operating at.[WING-MIB::wingStatsDevWlRadioCurPower:1.3.6.1.4.1.388.50.1.4.2.25.9.1.1.12]. | |
| extreme.wing.ap.radio.client.count | AP Radio Client Count | count | It monitors the number of clients associated to the radio.[WING-MIB::wingStatsDevWlRadioNumClient:1.3.6.1.4.1.388.50.1.4.2.25.9.1.1.15]. | |
| Extreme WiNG - Device Online Status | extreme.wing.device.online.status | Device Online Status | It monitors the device online status.[WING-MIB::wingStatsDevOnline:1.3.6.1.4.1.388.50.1.4.2.1.1.7]. | |
| Extreme WiNG - Global Statistics | extreme.wing.global.client.count | Global Client Count | count | It monitors the global client count.[WING-MIB::wingStatsNocGlobalClientCount:1.3.6.1.4.1.388.50.1.4.1.15.1]. |
| extreme.wing.offline.device.count | Offline Device Count | count | It monitors the offline device count.[WING-MIB::wingStatsNocDevOffLineInfoCount:1.3.6.1.4.1.388.50.1.4.1.14.2]. | |
| extreme.wing.cpu.load | CPU Load (%) | % | It monitors the CPU load in percentage.[WING-MIB::wingStatsDevSysInfoOnCurrentDeviceLoadLimitS0:1.3.6.1.4.1.388.50.1.4.2.2.2.1]. | |
| Extreme WiNG - Radio Traffic and RF Statistics - AP | extreme.wing.ap.radio.quality.index | AP Radio Quality Index | It monitors the quality of the medium in percentage.Possible values are 0-20: very poor quality,20-40: poor quality,40-60: average quality,60-100: good quality.[WING-MIB::wingStatsDevWlRadioStatQIndex:1.3.6.1.4.1.388.50.1.4.2.25.10.1.1.21]. | |
| extreme.wing.ap.radio.bytes.tx.rate | AP Radio Bytes Tx Rate | vBps | It monitors the number of data bytes transmitted from radio to clients.[WING-MIB::wingStatsDevWlRadioStatTxBytes:1.3.6.1.4.1.388.50.1.4.2.25.10.1.1.6]. | |
| extreme.wing.ap.radio.bytes.rx.rate | AP Radio Bytes Rx Rate | Bps | It monitors the number of data bytes received from clients to radio.[WING-MIB::wingStatsDevWlRadioStatRxBytes:1.3.6.1.4.1.388.50.1.4.2.25.10.1.1.7]. | |
| extreme.wing.ap.radio.tx.dropped.rate | AP Radio Tx Dropped Rate | Bps | It monitors the number of packets of data dropped on transmission.[WING-MIB::wingStatsDevWlRadioStatTxDropped:1.3.6.1.4.1.388.50.1.4.2.25.10.1.1.10]. | |
| extreme.wing.ap.radio.rx.error.rate | AP Radio Rx Error Rate | Bps | It monitors the number of packets of data received with errors.[WING-MIB::wingStatsDevWlRadioStatRxErrors:1.3.6.1.4.1.388.50.1.4.2.25.10.1.1.11]. | |
| extreme.wing.ap.radio.noise | AP Radio Noise | dBm | It monitors the noise level in units of dbm.[WING-MIB::wingStatsDevWlRadioStatNoise:1.3.6.1.4.1.388.50.1.4.2.25.10.1.1.16]. | |
| extreme.wing.ap.radio.snr | AP Radio SNR | dB | It monitors the signal to noise ratio in units of db.[WING-MIB::wingStatsDevWlRadioStatSnr:1.3.6.1.4.1.388.50.1.4.2.25.10.1.1.17]. | |
| extreme.wing.ap.radio.total.clients | AP Radio Total Clients | count | It monitors the total number of clients.[WING-MIB::wingStatsDevWlRadioStatNumClients:1.3.6.1.4.1.388.50.1.4.2.25.10.1.1.22]. | |
| extreme.wing.ap.radio.signal.strength | AP Radio Signal Strength | dBm | It monitors the signal strength in units of dbm.[WING-MIB::wingStatsDevWlRadioStatSignal:1.3.6.1.4.1.388.50.1.4.2.25.10.1.1.15]. | |
| Extreme WiNG - Radio Traffic and RF Statistics - RF Domain | extreme.wing.rfd.radio.quality.index | RF Domain Radio Quality Index | It monitors the quality of the medium in percentage. Possible values are 0-20: very poor quality,20-40: poor quality,40-60: average quality,60-100: good quality.[WING-MIB::wingStatsRfdWlRadioStatQIndex:1.3.6.1.4.1.388.50.1.4.3.2.9.1.1.21]. | |
| extreme.wing.rfd.radio.noise | RF Domain Radio Noise | dBm | It monitors the noise level in units of dbm.[WING-MIB::wingStatsRfdWlRadioStatNoise:1.3.6.1.4.1.388.50.1.4.3.2.9.1.1.16]. | |
| extreme.wing.rfd.radio.bytes.tx.rate | RF Domain Radio Bytes Tx Rate | Bps | It monitors the number of data bytes transmitted from radio to clients.[WING-MIB::wingStatsRfdWlRadioStatTxBytes:1.3.6.1.4.1.388.50.1.4.3.2.9.1.1.6]. | |
| extreme.wing.rfd.radio.bytes.rx.rate | RF Domain Radio Bytes Rx Rate | Bps | It monitors the number of data bytes received from clients to radio.[WING-MIB::wingStatsRfdWlRadioStatRxBytes:1.3.6.1.4.1.388.50.1.4.3.2.9.1.1.7]. | |
| extreme.wing.rfd.radio.tx.dropped.rate | RF Domain Radio Tx Dropped Rate | Bps | It monitors the number of packets of data dropped on transmission.[WING-MIB::wingStatsRfdWlRadioStatTxDropped:1.3.6.1.4.1.388.50.1.4.3.2.9.1.1.10]. | |
| extreme.wing.rfd.radio.rx.error.rate | RF Domain Radio Rx Error Rate | Bps | It monitors the number of packets of data received with errors.[WING-MIB::wingStatsRfdWlRadioStatRxErrors:1.3.6.1.4.1.388.50.1.4.3.2.9.1.1.11]. | |
| extreme.wing.rfd.radio.snr | RF Domain Radio SNR | dB | It monitors the signal to noise ratio in units of db.[WING-MIB::wingStatsRfdWlRadioStatSnr:1.3.6.1.4.1.388.50.1.4.3.2.9.1.1.17]. | |
| extreme.wing.rfd.radio.total.clients | RF Domain Radio Total Clients | count | It monitors the total number of clients.[WING-MIB::wingStatsRfdWlRadioStatNumClients:1.3.6.1.4.1.388.50.1.4.3.2.9.1.1.22]. | |
| extreme.wing.rfd.radio.signal.strength | RF Domain Radio Signal Strength | dBm | It monitors the signal strength in units of dbm.[WING-MIB::wingStatsRfdWlRadioStatSignal:1.3.6.1.4.1.388.50.1.4.3.2.9.1.1.15]. | |
| Extreme WiNG - RF Domain - WLAN | extreme.wing.rfd.wlan.tx.bytes.rate | RF Domain WLAN Bytes Tx Rate | Bps | It monitors the tx data frames per ssid.[WING-MIB::wingStatsRfdWlWlanTxBytes:1.3.6.1.4.1.388.50.1.4.3.2.12.1.2]. |
| extreme.wing.rfd.wlan.rx.bytes.rate | RF Domain WLAN Bytes Rx Rate | Bps | It monitors the rx data frames per ssid.[WING-MIB::wingStatsRfdWlWlanRxBytes;1.3.6.1.4.1.388.50.1.4.3.2.12.1.5]. | |
| extreme.wing.rfd.wlan.tx.dropped.rate | RF Domain WLAN Tx Dropped Rate | Bps | It monitors the dropped tx packets.[WING-MIB::wingStatsRfdWlWlanTxDropped:1.3.6.1.4.1.388.50.1.4.3.2.12.1.8]. | |
| extreme.wing.rfd.wlan.rx.error.rate | RF Domain WLAN Rx Error Rate | Bps | It monitors the received error packets.[WING-MIB::wingStatsRfdWlWlanRxErrors:1.3.6.1.4.1.388.50.1.4.3.2.12.1.9]. | |
| Extreme WiNG - RF Domain Radio | extreme.wing.rfd.radio.state | RF Domain Radio State | It monitors the radio state.Possible values are On(1),Off(2).[WING-MIB::wingStatsRfdWlRadioState:1.3.6.1.4.1.388.50.1.4.3.2.8.1.1.9]. | |
| extreme.wing.rfd.radio.power | RF Domain Radio Power | dBm | It monitors the current power the radio is operating at.[WING-MIB::wingStatsRfdWlRadioCurPower:1.3.6.1.4.1.388.50.1.4.3.2.8.1.1.12]. | |
| extreme.wing.rfd.radio.client.count | RF Domain Radio Client Count | count | It monitors the number of clients associated to the radio.[WING-MIB::wingStatsRfdWlRadioNumClient:1.3.6.1.4.1.388.50.1.4.3.2.8.1.1.15]. |
Extreme WiNG - WLAN Controller
Description
Template to monitor Extreme WiNG access point performance and statistics like Global Client Count,Global Client Count,CPU Load (%),Adopted Devices Online Status,Device Online Status,Radio Traffic and RF Statistics on AP,Radio Traffic and RF Statistics on RF Domain,AP Fault Detection,AP Radio,RF Domain Radio,RF Domain - WLAN. Validated on NX7500. sysObjectID : 1.3.6.1.4.1.388.50.1.1.38
Prerequisites
The device should have support for WING-MIB.
Supported Metric
| Monitor Name | Metric Name | Metric Display Name | Unit | Description |
|---|---|---|---|---|
| Extreme WiNG - Adopted Devices Online Status | extreme.wing.adopted.devices.online.status | Adopted Devices Online Status | It monitors the adopted devices online status.[WING-MIB::wingStatsDevAdoptDevOnline:1.3.6.1.4.1.388.50.1.4.2.8.2.1.7]. | |
| Extreme WiNG - AP Fault Detection | extreme.wing.ap.fault.detection | AP Fault Detection | It monitors whether any fault has been detected on the AP.Possible value are true(1),false(2).[WING-MIB::wingStatsDevWlApInfoFaultDetected:1.3.6.1.4.1.388.50.1.4.2.25.1.1.1.2]. | |
| Extreme WiNG - AP Radio | extreme.wing.ap.radio.state | AP Radio State | It monitors the radio state.Possible values are On(1),Off(2).[WING-MIB::wingStatsDevWlRadioState:1.3.6.1.4.1.388.50.1.4.2.25.9.1.1.9]. | |
| extreme.wing.ap.radio.power | AP Radio Power | dBm | It monitors the current power the radio is operating at.[WING-MIB::wingStatsDevWlRadioCurPower:1.3.6.1.4.1.388.50.1.4.2.25.9.1.1.12]. | |
| extreme.wing.ap.radio.client.count | AP Radio Client Count | count | It monitors the number of clients associated to the radio.[WING-MIB::wingStatsDevWlRadioNumClient:1.3.6.1.4.1.388.50.1.4.2.25.9.1.1.15]. | |
| Extreme WiNG - Device Online Status | extreme.wing.device.online.status | Device Online Status | It monitors the device online status.[WING-MIB::wingStatsDevOnline:1.3.6.1.4.1.388.50.1.4.2.1.1.7]. | |
| Extreme WiNG - Global Statistics | extreme.wing.global.client.count | Global Client Count | count | It monitors the global client count.[WING-MIB::wingStatsNocGlobalClientCount:1.3.6.1.4.1.388.50.1.4.1.15.1]. |
| extreme.wing.offline.device.count | Offline Device Count | count | It monitors the offline device count.[WING-MIB::wingStatsNocDevOffLineInfoCount:1.3.6.1.4.1.388.50.1.4.1.14.2]. | |
| extreme.wing.cpu.load | CPU Load (%) | % | It monitors the CPU load in percentage.[WING-MIB::wingStatsDevSysInfoOnCurrentDeviceLoadLimitS0:1.3.6.1.4.1.388.50.1.4.2.2.2.1]. | |
| Extreme WiNG - Radio Traffic and RF Statistics - AP | extreme.wing.ap.radio.quality.index | AP Radio Quality Index | It monitors the quality of the medium in percentage.Possible values are 0-20: very poor quality,20-40: poor quality,40-60: average quality,60-100: good quality.[WING-MIB::wingStatsDevWlRadioStatQIndex:1.3.6.1.4.1.388.50.1.4.2.25.10.1.1.21]. | |
| extreme.wing.ap.radio.bytes.tx.rate | AP Radio Bytes Tx Rate | vBps | It monitors the number of data bytes transmitted from radio to clients.[WING-MIB::wingStatsDevWlRadioStatTxBytes:1.3.6.1.4.1.388.50.1.4.2.25.10.1.1.6]. | |
| extreme.wing.ap.radio.bytes.rx.rate | AP Radio Bytes Rx Rate | Bps | It monitors the number of data bytes received from clients to radio.[WING-MIB::wingStatsDevWlRadioStatRxBytes:1.3.6.1.4.1.388.50.1.4.2.25.10.1.1.7]. | |
| extreme.wing.ap.radio.tx.dropped.rate | AP Radio Tx Dropped Rate | Bps | It monitors the number of packets of data dropped on transmission.[WING-MIB::wingStatsDevWlRadioStatTxDropped:1.3.6.1.4.1.388.50.1.4.2.25.10.1.1.10]. | |
| extreme.wing.ap.radio.rx.error.rate | AP Radio Rx Error Rate | Bps | It monitors the number of packets of data received with errors.[WING-MIB::wingStatsDevWlRadioStatRxErrors:1.3.6.1.4.1.388.50.1.4.2.25.10.1.1.11]. | |
| extreme.wing.ap.radio.noise | AP Radio Noise | dBm | It monitors the noise level in units of dbm.[WING-MIB::wingStatsDevWlRadioStatNoise:1.3.6.1.4.1.388.50.1.4.2.25.10.1.1.16]. | |
| extreme.wing.ap.radio.snr | AP Radio SNR | dB | It monitors the signal to noise ratio in units of db.[WING-MIB::wingStatsDevWlRadioStatSnr:1.3.6.1.4.1.388.50.1.4.2.25.10.1.1.17]. | |
| extreme.wing.ap.radio.total.clients | AP Radio Total Clients | count | It monitors the total number of clients.[WING-MIB::wingStatsDevWlRadioStatNumClients:1.3.6.1.4.1.388.50.1.4.2.25.10.1.1.22]. | |
| extreme.wing.ap.radio.signal.strength | AP Radio Signal Strength | dBm | It monitors the signal strength in units of dbm.[WING-MIB::wingStatsDevWlRadioStatSignal:1.3.6.1.4.1.388.50.1.4.2.25.10.1.1.15]. | |
| Extreme WiNG - Radio Traffic and RF Statistics - RF Domain | extreme.wing.rfd.radio.quality.index | RF Domain Radio Quality Index | It monitors the quality of the medium in percentage. Possible values are 0-20: very poor quality,20-40: poor quality,40-60: average quality,60-100: good quality.[WING-MIB::wingStatsRfdWlRadioStatQIndex:1.3.6.1.4.1.388.50.1.4.3.2.9.1.1.21]. | |
| extreme.wing.rfd.radio.noise | RF Domain Radio Noise | dBm | It monitors the noise level in units of dbm.[WING-MIB::wingStatsRfdWlRadioStatNoise:1.3.6.1.4.1.388.50.1.4.3.2.9.1.1.16]. | |
| extreme.wing.rfd.radio.bytes.tx.rate | RF Domain Radio Bytes Tx Rate | Bps | It monitors the number of data bytes transmitted from radio to clients.[WING-MIB::wingStatsRfdWlRadioStatTxBytes:1.3.6.1.4.1.388.50.1.4.3.2.9.1.1.6]. | |
| extreme.wing.rfd.radio.bytes.rx.rate | RF Domain Radio Bytes Rx Rate | Bps | It monitors the number of data bytes received from clients to radio.[WING-MIB::wingStatsRfdWlRadioStatRxBytes:1.3.6.1.4.1.388.50.1.4.3.2.9.1.1.7]. | |
| extreme.wing.rfd.radio.tx.dropped.rate | RF Domain Radio Tx Dropped Rate | Bps | It monitors the number of packets of data dropped on transmission.[WING-MIB::wingStatsRfdWlRadioStatTxDropped:1.3.6.1.4.1.388.50.1.4.3.2.9.1.1.10]. | |
| extreme.wing.rfd.radio.rx.error.rate | RF Domain Radio Rx Error Rate | Bps | It monitors the number of packets of data received with errors.[WING-MIB::wingStatsRfdWlRadioStatRxErrors:1.3.6.1.4.1.388.50.1.4.3.2.9.1.1.11]. | |
| extreme.wing.rfd.radio.snr | RF Domain Radio SNR | dB | It monitors the signal to noise ratio in units of db.[WING-MIB::wingStatsRfdWlRadioStatSnr:1.3.6.1.4.1.388.50.1.4.3.2.9.1.1.17]. | |
| extreme.wing.rfd.radio.total.clients | RF Domain Radio Total Clients | count | It monitors the total number of clients.[WING-MIB::wingStatsRfdWlRadioStatNumClients:1.3.6.1.4.1.388.50.1.4.3.2.9.1.1.22]. | |
| extreme.wing.rfd.radio.signal.strength | RF Domain Radio Signal Strength | dBm | It monitors the signal strength in units of dbm.[WING-MIB::wingStatsRfdWlRadioStatSignal:1.3.6.1.4.1.388.50.1.4.3.2.9.1.1.15]. | |
| Extreme WiNG - RF Domain - WLAN | extreme.wing.rfd.wlan.tx.bytes.rate | RF Domain WLAN Bytes Tx Rate | Bps | It monitors the tx data frames per ssid.[WING-MIB::wingStatsRfdWlWlanTxBytes:1.3.6.1.4.1.388.50.1.4.3.2.12.1.2]. |
| extreme.wing.rfd.wlan.rx.bytes.rate | RF Domain WLAN Bytes Rx Rate | Bps | It monitors the rx data frames per ssid.[WING-MIB::wingStatsRfdWlWlanRxBytes;1.3.6.1.4.1.388.50.1.4.3.2.12.1.5]. | |
| extreme.wing.rfd.wlan.tx.dropped.rate | RF Domain WLAN Tx Dropped Rate | Bps | It monitors the dropped tx packets.[WING-MIB::wingStatsRfdWlWlanTxDropped:1.3.6.1.4.1.388.50.1.4.3.2.12.1.8]. | |
| extreme.wing.rfd.wlan.rx.error.rate | RF Domain WLAN Rx Error Rate | Bps | It monitors the received error packets.[WING-MIB::wingStatsRfdWlWlanRxErrors:1.3.6.1.4.1.388.50.1.4.3.2.12.1.9]. | |
| Extreme WiNG - RF Domain Radio | extreme.wing.rfd.radio.state | RF Domain Radio State | It monitors the radio state.Possible values are On(1),Off(2).[WING-MIB::wingStatsRfdWlRadioState:1.3.6.1.4.1.388.50.1.4.3.2.8.1.1.9]. | |
| extreme.wing.rfd.radio.power | RF Domain Radio Power | dBm | It monitors the current power the radio is operating at.[WING-MIB::wingStatsRfdWlRadioCurPower:1.3.6.1.4.1.388.50.1.4.3.2.8.1.1.12]. | |
| extreme.wing.rfd.radio.client.count | RF Domain Radio Client Count | count | It monitors the number of clients associated to the radio.[WING-MIB::wingStatsRfdWlRadioNumClient:1.3.6.1.4.1.388.50.1.4.3.2.8.1.1.15]. |
ExtremeNetworks WLAN Controller - G2
Description
Applicable on the extreme wireless controller devices. Monitors the access point state,wireless controller temporary license days remaining and link failures in paired status. Can be applied on Extreme Networks Wireless Controller - V2110,System Version 09.01.02.0017. SNMP Obj Id=1.3.6.1.4.1.4329.15.1.1.13.
Prerequisites
No prerequisite
Supported Metric
| Monitor Name | Metric Name | Metric Display Name | Unit | Description |
|---|---|---|---|---|
| Extreme Wireless AP State | extreme.wireless.apstate | Extreme Wireless AP State | Monitors the the current state of the access point. Active means that access point has registered with this controller at some point of time and still has active connection with this controller. This variable has meaning in the context of the controller that query is done. Inactive mean access point has lost the connection with this controller,Possible status values are 1-Active,2- Inactive.[OIDs: 1.3.6.1.4.1.4329.15.3.5.1.2.1.2,1.3.6.1.4.1.4329.15.3.5.1.2.1.22] | |
| Extreme Wireless Controller License Days Remaining | extreme.wirelesscontroller.temp.licensedaysremaining | Extreme Wireless Controller License Days Remaining | Days | Monitors the number of days is left for the temporary license to expire.[OIDs: 1.3.6.1.4.1.4329.15.3.2.10.1.1.0,1.3.6.1.4.1.4329.15.3.2.10.1.2.0,1.3.6.1.4.1.4329.15.3.2.10.1.3.0] |
| Extreme Wireless Controller Link Failures Detect | extreme.wirelesscontroller.detect.linkfailures | Extreme Wireless Controller Link Failures Detect | s | Monitors the link failures details of availability pairing. Time to detect link failure between two controllers in availability pairing,the value can be set to values between 2-30 seconds. Based on the availability status only we are monitoring the link failure,it will be monitored only when it is in paired status.[OIDs: 1.3.6.1.4.1.4329.15.3.2.8.1.0,1.3.6.1.4.1.4329.15.3.2.8.5.0] |
ExtremeXOS Switch Monitors
Description
Monitors the system CPU utilization,system memory utilization,system uptime,power supply,power alarm status,fan operational status and the current temperature of the ExtremeXOS switch. Validated on ExtremeXOS X440 switch (SysObjID: enterprises.1916.2.175,enterprises.1916.2.177)
Prerequisites
No prerequisite
Supported Metric
| Monitor Name | Metric Name | Metric Display Name | Unit | Description |
|---|---|---|---|---|
| Extreme XOS Current Temperature and Power Alarm Status | extreme.current.temperature | Extreme Current Temperature | F | This monitor provides the current temperature in degrees celcius measured inside device enclosure.[OID: 1.3.6.1.4.1.1916.1.1.1.8.0] |
| extreme.power.alarm.status | Extreme Power Alarm Status | This monitor provides the alarm state of the power supply to a device. Alarm state indicates either fan failure or overtemperature condition. The possible status values are 1- True and 2- false.[OID: 1.3.6.1.4.1.1916.1.1.1.22.0] | ||
| Extreme XOS Fan Operational Status | extreme.fan.operational.status | Extreme Fan Operational Status | This monitor provides the operational status of a cooling fan. The possible status values are : 1- True and 2- False,which are boolean.[OID: 1.3.6.1.4.1.1916.1.1.1.9.1.2] | |
| Extreme XOS Power Supply Status | extreme.power.supply.status | Extreme Power Supply Status | This monitor provides the status of the power supply. Possible status values are 1 - Not Present,2- Present and OK,3- Present and NOT OK.[OID: 1.3.6.1.4.1.1916.1.1.1.27.1.2] | |
| Extreme XOS System CPU Utilization | extreme.system.cpu.utilization.5min | CPU Utilization 5min | % | Monitors the CPU utilization by system resources. This is the CPU utilization of the system resources in the last 5 minutes.[OIDs: extremeCpuMonitorSystemUtilization5mins - 1.3.6.1.4.1.1916.1.32.1.4.1.9] |
| Extreme XOS System Memory Utilization | extreme.system.memory.utilization | System Memory Utilization | % | Monitors the total amount of memory used by system services in %.[OIDs: 1.3.6.1.4.1.1916.1.32.2.2.1.2,1.3.6.1.4.1.1916.1.32.2.2.1.4] |
| extreme.system.memory.free | System Memory Free | KB | Total amount of free memory in Kbytes in the system.[OIDs: 1.3.6.1.4.1.1916.1.32.2.2.1.3] | |
| System Uptime | system.uptime | System Uptime | s | The time since the SNMP agent in the system was last re-initialized.[OID : 1.3.6.1.2.1.1.3.0] |
ExtremeXOS Switch Port Monitors
Description
It monitors the ExtemeXOS switch’s port statistics like average bandwidth utilization in the transmit(Tx) and receive(Rx) direction and monitors the number of packets dropped due to congestion on this port. Validated on ExtremeXOS X440 switch (SysObjID: enterprises.1916.2.175,enterprises.1916.2.177) Note: While assigning this template user should select ports manually which need to be monitored.
Prerequisites
No prerequisite
Supported Metric
| Monitor Name | Metric Name | Metric Display Name | Unit | Description |
|---|---|---|---|---|
| Extreme XOS Port Monitoring | extreme.average.port.tx.utilization | Extreme Average Port Transmit Utilization | % | This monitor provides the reported average bandwidth in the transmit direction. When displayed,it shows as an Integer value i.e 99.99% is displayed as 9999.[OID: 1.3.6.1.4.1.1916.1.4.5.1.1] |
| extreme.average.port.rx.utilization | Extreme Average Port Receive Utilization | % | This monitor provides the reported average bandwidth in the receive direction. When displayed,it shows as an Integer value i.e 99.99% is displayed as 9999.[OID: 1.3.6.1.4.1.1916.1.4.5.1.2] | |
| extreme.congestion.drop.packets | Extreme Congestion Drop Packets | This monitor provides the number of packets dropped due to congestion on this port.[OID: 1.3.6.1.4.1.1916.1.4.14.1.1] |
Fiberstore Switch Performance
Description
Template to monitor the Fiberstore Switch performance statistics like Memory utilization and CPU utilization.[FIBERSTORE-MIB :: memTotalFree : 1.3.6.1.4.1.52642.1.1.1.11.0,memTotalUsed : 1.3.6.1.4.1.52642.1.1.1.12.0,fiveMinutes : 1.3.6.1.4.1.52642.1.1.9.3.0]
Prerequisites
Device must have support for FIBERSTORE-MIB
Supported Metric
| Monitor Name | Metric Name | Metric Display Name | Unit | Description |
|---|---|---|---|---|
| Fiberstore Switch - Performance | fiberstore_switch_MemoryUtilization | Fiberstore Switch Memory Utilization | % | Monitors the Fiberstore Switch Memory Utilization.[FIBERSTORE-MIB :: memTotalFree : 1.3.6.1.4.1.52642.1.1.1.11.0,memTotalUsed : 1.3.6.1.4.1.52642.1.1.1.12.0] |
| fiberstore_switch_CpuFiveMinutes | Fiberstore Switch CPU Utilization FiveMinutes | % | Monitors the CPU usage within five minutes.[FIBERSTORE-MIB :: fiveMinutes : 1.3.6.1.4.1.52642.1.1.9.3.0] |
Fiberstore Switch Hardware
Description
Template to monitor the Fiberstore Switch hardware statistics like Fan status,fan speed,Power status,Slot Status and Transeiver current Status.[FIBERSTORE-MIB :: devMFanStatus : 1.3.6.1.4.1.52642.1.37.1.1.1.1.4,devMFanSpeed : 1.3.6.1.4.1.52642.1.37.1.1.1.1.5,devMPowerStatus : 1.3.6.1.4.1.52642.1.37.1.2.1.2,lswSlotStatus : 1.3.6.1.4.1.52642.1.37.1.5.1.5,transceiveStatus : 1.3.6.1.4.1.52642.1.37.1.10.1.1.11]
Prerequisites
Device must have support for FIBERSTORE-MIB
Supported Metric
| Monitor Name | Metric Name | Metric Display Name | Unit | Description |
|---|---|---|---|---|
| Fiberstore Switch - Power | fiberstore_switch_PowerStatus | Fiberstore Switch Power Status | Monitors the Fiberstore Switch Power Status.[FIBERSTORE-MIB :: devMPowerStatus : 1.3.6.1.4.1.52642.1.37.1.2.1.2] Possible values are : 1 : present,2 : absent,3 : unsupport. | |
| fiberstore_switch_SlotStatus | Fiberstore Switch Slot Status | Monitors the Fiberstore Switch Slot Status. Include absent,creating,initing,syncing,fail,ready,uninit,conflict.[FIBERSTORE-MIB :: lswSlotStatus : 1.3.6.1.4.1.52642.1.37.1.5.1.5] | ||
| fiberstore_switch_TransceiverStatus | Fiberstore Switch Transceiver Status | Monitors the FiberStore Switch Transeiver current Status.[FIBERSTORE-MIB :: transceiveStatus : 1.3.6.1.4.1.52642.1.37.1.10.1.1.11] | ||
| fiberstore_switch_FanStatus | Fiberstore Switch Fan Status | Monitors the Fiberstore Switch Fan Status.[FIBERSTORE-MIB :: devMFanStatus : 1.3.6.1.4.1.52642.1.37.1.1.1.1.4] Possible values are : 1 : active,2 : deactive,3 : notInstall,4 : unsupport. | ||
| fiberstore_switch_FanSpeed | Fiberstore Switch Fan Speed | % | Monitors the Fiberstore Switch Fan Speed.[FIBERSTORE-MIB :: devMFanSpeed : 1.3.6.1.4.1.52642.1.37.1.1.1.1.5] |
Fiberstore Switch Vlan
Description
Template to monitors the Fiberstore Switch Vlan status,row status,if config,packets in and out,bytes in and out and status en.[FIBERSTORE-MIB :: vlanStatus : 1.3.6.1.4.1.52642.1.11.1.1.1.3,vlanRowStatus : 1.3.6.1.4.1.52642.1.11.1.1.1.4,vlanIfConfig : 1.3.6.1.4.1.52642.1.11.1.1.1.5,vlanStatsPktIn : 1.3.6.1.4.1.52642.1.11.1.1.1.7,vlanStatsPktOut : 1.3.6.1.4.1.52642.1.11.1.1.1.8,vlanStatsByteIn : 1.3.6.1.4.1.52642.1.11.1.1.1.9,vlanStatsByteOut : 1.3.6.1.4.1.52642.1.11.1.1.1.10,vlanStatsEn : 1.3.6.1.4.1.52642.1.11.1.1.1.11]
Prerequisites
Device must have support for FIBERSTORE-MIB
Supported Metric
| Monitor Name | Metric Name | Metric Display Name | Unit | Description |
|---|---|---|---|---|
| Fiberstore Switch - Vlan | fiberstore_switch_VlanStatus | Fiberstore Switch Vlan Status | Monitors the VLAN Status[FIBERSTORE-MIB :: vlanStatus : 1.3.6.1.4.1.52642.1.11.1.1.1.3] Possible values are : 1 : inactive,2 : active. | |
| fiberstore_switch_VlanStatsPktIn | Fiberstore Switch Vlan Packets In | packets/sec | Monitors the Ingress packtes number of Vlan.[FIBERSTORE-MIB :: vlanStatsPktIn : 1.3.6.1.4.1.52642.1.11.1.1.1.7] | |
| fiberstore_switch_VlanStatsPktOut | Fiberstore Switch Vlan Packets Out | packets/sec | Monitors the Egress packtes number of Vlan.[FIBERSTORE-MIB :: vlanStatsPktOut : 1.3.6.1.4.1.52642.1.11.1.1.1.8] | |
| fiberstore_switch_VlanStatsByteIn | Fiberstore Switch Vlan Bytes In | Bps | Monitors the Ingress bytes number of Vlan.[FIBERSTORE-MIB :: vlanStatsByteIn : 1.3.6.1.4.1.52642.1.11.1.1.1.9] | |
| fiberstore_switch_VlanStatsByteOut | Fiberstore Switch Vlan Bytes Out | Bps | Monitors the Egress bytes number of Vlan.[FIBERSTORE-MIB :: vlanStatsByteOut : 1.3.6.1.4.1.52642.1.11.1.1.1.10] |
Fiber Channel Connection Unit Status - G2
Description
Applicable on Fiber channel SAN switches like HP Storage Works 2000 Modular Smart Array or Brocade or Qlogic SAN devices. Monitors the Status of connection unit,sensors and ports.
Prerequisites
No prerequisite
Supported Metric
| Monitor Name | Metric Name | Metric Display Name | Unit | Description |
|---|---|---|---|---|
| Fiber Channel Connection Unit Port | fiberchannel.connection.unit.portstatus | Connection Unit Port Status | Monitors the overall protocol status for the port. Possible values are 1- unknown,2- unused,3- ready,4- warning,5- failure,6- notparticipating,7- initializing,8- bypass,9- ols.[OIDs: 1.3.6.1.3.94.1.10.1.2,1.3.6.1.3.94.1.10.1.15,1.3.6.1.3.94.1.10.1.6,1.3.6.1.3.94.1.10.1.7] | |
| fiberchannel.connection.unit.porthwstate | Connection Unit Port Hardware State | Monitors the hardware detected state of the port. Possible values are 1- unknown,2- failed,3- bypassed,4- active,5- loopback,6- txfault,7- noMedia,8- linkDown.[OIDs: 1.3.6.1.3.94.1.10.1.2,1.3.6.1.3.94.1.10.1.15,1.3.6.1.3.94.1.10.1.7,1.3.6.1.3.94.1.10.1.23] | ||
| Fiber Channel Connection Unit Sensor Status | fiberchannel.connection.unit.sensorstatus | Connection Unit Sensor Status | Monitors the status indicated by the sensor. Possible values are 1- unknown,2- other,3- ok,4- warning,5- failed.[OIDs: 1.3.6.1.3.94.1.8.1.4,1.3.6.1.3.94.1.8.1.1,1.3.6.1.3.94.1.8.1.3,1.3.6.1.3.94.1.8.1.6] | |
| Fiber Channel Connection Unit Status | fiberchannel.connection.unit.status | Connection Unit Status | Monitors the Overall status of the connectivity unit. The goal of this object is to be the single poll point to check the status of the connunit. Possible values are 1- unknown,2- unused,3- ok,4- warning,5- failed.[OIDs: 1.3.6.1.3.94.1.6.1.20,1.3.6.1.3.94.1.6.1.6] |
Fiber Channel Fabric Element Status - G2
Applicable on all Fiber channel devices that support the FIBER-CHANNEL-FE-MIB. Monitors the status of the fiber channel modules,port statistics like traffic rate on the port fiber elements,port status etc.,
Prerequisites
No prerequisite
Supported Metric
| Monitor Name | Metric Name | Metric Display Name | Unit | Description |
|---|---|---|---|---|
| Fiber channel FE Module Status | fiberchannel.module.status | Fiber Channel Module Status | Monitors the operational status of the fiber channel fabric element module. Possible values are 1- online: the module is functioning properly,2- offline: the module is not available,3- testing: the module is under testing and 4- faulty: the module is defective in some way.[OIDs: 1.3.6.1.2.1.75.1.1.4.1.2,1.3.6.1.2.1.75.1.1.4.1.4] | |
| Fiber Channel FE Port Stats | fiberchannel.port.status | Fiber Channel Port Operational Status | Monitors the operational status of fiber channel port.[OIDs: 1.3.6.1.2.1.75.1.1.5.1.2,1.3.6.1.2.1.75.1.2.2.1.1,1.3.6.1.2.1.75.1.2.2.1.2] | |
| fiberchannel.port.linkfailures | Fiber Channel Port Link Failures | psec | Monitors the number of link failures detected by this FxPort.[OID: 1.3.6.1.2.1.75.1.3.1.1.1] | |
| fiberchannel.port.synclosses | Fiber Channel Port Sync Losses | psec | Monitors the number of loss of synchronization detected by the FxPort.[OID: 1.3.6.1.2.1.75.1.3.1.1.2] | |
| fiberchannel.port.siglosses | Fiber Channel Port Signal Losses | psec | Monitors the number of loss of signal detected by the FxPort.[OID: 1.3.6.1.2.1.75.1.3.1.1.3] | |
| fiberchannel.port.invalidcrc | Fiber Channel Port Invalid CRCs | psec | Monitors the number of invalid CRC detected by this FxPort.[OID: 1.3.6.1.2.1.75.1.3.1.1.6] | |
| fiberchannel.port.invalidtxwords | Fiber Channel Port Invalid Tx Words | psec | Monitors the number of invalid transmission word detected by the FxPort.[OID: 1.3.6.1.2.1.75.1.3.1.1.5] | |
| fiberchannel.port.offlineseq.in | Fiber Channel Port Received Offline Sequences | psec | Monitors the number of Offline Sequence received by this FxPort.[OID: 1.3.6.1.2.1.75.1.3.1.1.11] | |
| fiberchannel.port.offlineseq.out | Fiber Channel Port Issued Offline Sequences | psec | Monitors the number of Offline Sequence issued by this FxPort.[OID: 1.3.6.1.2.1.75.1.3.1.1.12] | |
| fiberchannel.port.c3frames.in | Fiber Channel Port Class 3 Frames In | psec | Monitors the number of Class 3 frames received by this FxPort from its attached NxPort.[OID: 1.3.6.1.2.1.75.1.4.3.1.1] | |
| fiberchannel.port.c3frames.out | Fiber Channel Port Class 3 Frames Out | psec | Monitors the number of Class 3 frames delivered through this FxPort to its attached NxPort.[OID: 1.3.6.1.2.1.75.1.4.3.1.2] | |
| fiberchannel.port.c3frame.discards | Fiber Channel Port Class 3 Frame Discards | psec | Monitors number of Class 3 frames discarded by this FxPort.[OID: 1.3.6.1.2.1.75.1.4.3.1.5] | |
| fiberchannel.port.available.buffers | Fiber Channel Port Available Buffers | Monitors the number of buffers currently available for receiving frames from the attached port in the buffer-to-buffer flow control.[OID: 1.3.6.1.2.1.75.1.2.1.1.2] | ||
| Fiber Channel Max FE Modules | fiberchannel.fabric.modules.max | Fiber Channel Fabric Modules Max | Monitors the maximum number of modules in the Fabric Element,regardless of their current state.[OIDs: 1.3.6.1.2.1.75.1.1.1.0,1.3.6.1.2.1.75.1.1.2.0,1.3.6.1.2.1.75.1.1.3.0] |
Fortinet Fortigate DHCP Lease
Description
It monitor lease usage of the DHCP server.Validated on FGT_100F Firewall, SysObjOID : 1.3.6.1.4.1.12356.101.1.1000[FORTINET-FORTIGATE-MIB :: fgDhcpLeaseUsage : 1.3.6.1.4.1.12356.101.23.2.1.1.2]
Prerequisites
Device should support FORTINET-FORTIGATE-MIB
Supported Metrics
| Monitor Name | Metric Name | Metric Display Name | Unit | Description |
|---|---|---|---|---|
| Fortinet Fortigate DHCP Lease | fortinet_fortigate_dhcp_Lease | Fortinet Fortigate DHCP Lease | % | It monitor lease usage of the DHCP server [FORTINET-FORTIGATE-MIB :: fgDhcpLeaseUsage : 1.3.6.1.4.1.12356.101.23.2.1.1.2]. |
Fluentd
Note
This template will be deprecated soon.Description
Template to monitor the Fluentd attributes like Retry Count,Buffer Queue Length,Total Buffer Queued Size. Validated on Fluentd v4.6.5
Prerequisites
No prerequisite
Supported Metric
| Monitor Name | Metric Name | Metric Display Name | Unit | Description |
|---|---|---|---|---|
| Fluentd | fluentd.buffer_total_queued_size | Fluentd Total Buffer Queued Size | Bytes | The size of the buffer queue for this plugin. |
| fluentd.retry_count | Fluentd Retry count | NULL | The number of retries for this plugin. | |
| fluentd.buffer_queue_length | Fluentd Buffer Queue Length | NULL | The length of the buffer queue for this plugin. |
Fortinet Fortiadc
Description
Template to monitor Instantaneous System Memory Usage,Instantaneous System Log Disk Usage,Instantaneous System Load,CPU 5min Avg Usage,CPU Temperature,Device Temperature,Device Fan Speed,Device Fan Status,Disk State,Milli Voltage,Power Supply Voltage,GLB(Global Load Balancer) Server Status,Clientside Throughput,Clientside SSL Throughput,Concurrent Client SSL Sessions,SLB Hit Certificate Percentage,SLB Cache Hit Bytes.
Prerequisites
The device should have support for FORTINET-FORTIADC-MIB
Supported Metric
| Monitor Name | Metric Name | Metric Display Name | Unit | Description |
|---|---|---|---|---|
| Fortinet Fortiadc - Client-side Statistics | fortinet.fortiadc.clientside.throughput | Client-side Throughput | It monitors the client-side throughput ingress and egress.[FORTINET-FORTIADC-MIB::fadcClientSideThroughput:1.3.6.1.4.1.12356.112.8.5.5]. | |
| fortinet.fortiadc.clientside.ssl.throughput | Client-side SSL Throughput | It monitors the client-side SSL-only (encrypted) throughput.[FORTINET-FORTIADC-MIB::fadcClientSideSSLThroughput:1.3.6.1.4.1.12356.112.8.5.6]. | ||
| fortinet.fortiadc.concurrent.client.ssl.sessions | Concurrent Client SSL Sessions | It monitors the concurrent client-side SSL sessions[FORTINET-FORTIADC-MIB::fadcConcurrentClientSSLSessions:1.3.6.1.4.1.12356.112.8.5.8]. | ||
| Fortinet Fortiadc - CPU Temperature | fortinet.fortiadc.cpu.temperature | CPU Temperature | Celsius | It monitors the air temperature of the host CPU.[FORTINET-FORTIADC-MIB::fadcCPUTemp:1.3.6.1.4.1.12356.112.6.1.1.1.3]. |
| Fortinet Fortiadc - CPU Usage | fortinet.fortiadc.cpu.5min.avg.usage | CPU 5min Avg Usage | % | It monitors the average of cpu usage in 5 min[FORTINET-FORTIADC-MIB::fadcCpu5minAvgUsage:1.3.6.1.4.1.12356.112.1.40.1.5]. |
| Fortinet Fortiadc - Device Temperature | fortinet.fortiadc.device.temperature | Device Temperature | Celsius | It monitors the air temperature of the device.[FORTINET-FORTIADC-MIB::fadcDeviceTempValue:1.3.6.1.4.1.12356.112.6.4.1.1.1.3]. |
| Fortinet Fortiadc - Disk Status | fortinet.fortiadc.disk.state | Disk State | It monitors the state of disk.[FORTINET-FORTIADC-MIB::fadcDiskState:1.3.6.1.4.1.12356.112.6.5.5] | |
| Fortinet Fortiadc - Fan | fortinet.fortiadc.device.fan.speed | Device Fan Speed | rpm | It monitors the device fan speed.[FORTINET-FORTIADC-MIB::fadcDeviceFanSpeed:1.3.6.1.4.1.12356.112.6.4.2.1.1.3]. |
| fortinet.fortiadc.device.fan.status | Device Fan Status | It monitors the device fan tray status.[FORTINET-FORTIADC-MIB::fadcDeviceFanStatus:1.3.6.1.4.1.12356.112.6.4.2.1.1.4]. | ||
| Fortinet Fortiadc - GLB Server Status | fortinet.fortiadc.glb.server.status | GLB(Global Load Balancer) Server Status | It monitors the status of specified GLB server.[FORTINET-FORTIADC-MIB::fadcGLBServerStatus:1.3.6.1.4.1.12356.112.8.4.2.1.1.3]. | |
| Fortinet Fortiadc - SLB SSL Cache Util | fortinet.fortiadc.slb.hit.cert.percent | SLB Hit Certificate Percentage | % | It monitors the SLB(Server Load Balacing) certificate cache hit percentage of specified virtual server.[FORTINET-FORTIADC-MIB::fadcSLBHitCertPercentage:1.3.6.1.4.1.12356.112.8.5.20.1.1.11] |
| fortinet.fortiadc.slb.cache.hit.bytes | SLB Cache Hit Bytes | Bytes | It monitors the SLB(Server Load Balacing) cache hit bytes of specified virtual server.[FORTINET-FORTIADC-MIB::fadcSLBCacheHitBytes:1.3.6.1.4.1.12356.112.8.5.20.1.1.6] | |
| Fortinet Fortiadc - System Performance | fortinet.fortiadc.sys.mem.usage | Instantaneous System Memory Usage | % | It monitors the instantaneous memory utilization.[FORTINET-FORTIADC-MIB::fadcSysMemUsage:1.3.6.1.4.1.12356.112.1.5]. |
| fortinet.fortiadc.sys.log.disk.usage | Instantaneous System Log Disk Usage | % | It monitors the instantaneous log disk usage.[FORTINET-FORTIADC-MIB::fadcSysLogDiskUsage:1.3.6.1.4.1.12356.112.1.6] | |
| fortinet.fortiadc.sys.load | Instantaneous System Load | It monitors the instantaneous system load.[FORTINET-FORTIADC-MIB::fadcSysLoad:1.3.6.1.4.1.12356.112.1.30] | ||
| Fortinet Fortiadc - Voltage | fortinet.fortiadc.voltage | Milli Voltage | mV | It monitors the milli-voltage value.[FORTINET-FORTIADC-MIB::fadcVoltage:1.3.6.1.4.1.12356.112.6.6] |
| fortinet.fortiadc.powersupply.voltage | Power Supply Voltage | v | It monitors the system power supply voltage value.[FORTINET-FORTIADC-MIB::fadcPowerSupplyVoltage:1.3.6.1.4.1.12356.112.6.7] |
Fortinet Fortigate - Hardware Sensor Status
Description
Provides the list of device specific hardware sensors status.
Prerequisites
No prerequisite
Supported Metric
| Monitor Name | Metric Name | Metric Display Name | Unit | Description |
|---|---|---|---|---|
| Fortinet Fortigate Hardware Sensor Status | fortinet_fortigate_FgHwSensorEntAlarmStatus | Fortinet Fortigate Hardware Sensor Alarm Status | Provides the fortinet fortigate hardware sensor alarm status.[FORTINET-FORTIGATE-MIB::fgHwSensorEntAlarmStatus:1.3.6.1.4.1.12356.101.4.3.2.1.4] |
Fortinet Fortigate VPN Tunnel Status
Description
Template to monitor the current status of tunnel (up or down).[FORTINET-FORTIGATE-MIB :: fgVpnTunEntStatus : 1.3.6.1.4.1.12356.101.12.2.2.1.20,fgVpnTunEntPhase2Name : 1.3.6.1.4.1.12356.101.12.2.2.1.3]
Prerequisites
No prerequisite
Supported Metric
| Monitor Name | Metric Name | Metric Display Name | Unit | Description |
|---|---|---|---|---|
| Fortinet Fortigate VPN Tunnel Status | fortigate_vpn_TunnelStatus | Fortigate VPN Tunnel Status | Monitors the current status of tunnel (up or down).[FORTINET-FORTIGATE-MIB :: fgVpnTunEntStatus : 1.3.6.1.4.1.12356.101.12.2.2.1.20].Possible values are down(1),up(2). |
Fortinet FortiSwitch - Performance
Description
Template to monitor the Fortinet Fortiswitch for CPU,Memory and Disk utilization as a part of performance metrics.
Prerequisites
No prerequisite
Supported Metric
| Monitor Name | Metric Name | Metric Display Name | Unit | Description |
|---|---|---|---|---|
| Fortinet FortiSwitch Performance | fortinet_FortiSwitch_FsSysCpuUtilization | Fortinet FortiSwitch System CPU Utilization | % | Monitors the fortinet fortiswitch system CPU utilization.[FORTINET-FORTISWITCH-MIB::fsSysCpuUsage:1.3.6.1.4.1.12356.106.4.1.2.0] |
| fortinet_FortiSwitch_FsSysMemUtilization | Fortinet FortiSwitch System Memory Utilization | % | Monitors the fortinet fortiswitch system memory utilization.[FORTINET-FORTISWITCH-MIB::fsSysMemUsage:1.3.6.1.4.1.12356.106.4.1.3.0,fsSysMemCapacity:1.3.6.1.4.1.12356.106.4.1.4.0] | |
| fortinet_FortiSwitch_FsSysDiskUtilization | Fortinet FortiSwitch System Disk Utilization | % | Monitors the fortinet fortiswitch system disk utilization.[FORTINET-FORTISWITCH-MIB::fsSysDiskUsage:1.3.6.1.4.1.12356.106.4.1.5.0,fsSysDiskCapacity:1.3.6.1.4.1.12356.106.4.1.6.0] |
Fortinet FortiWeb - Performance
Description
Template to monitor the Fortinet FortiWeb firewall for CPU,Memory and Disk utilization as a part of performance metrics
Prerequisites
No prerequisite
Supported Metric
| Monitor Name | Metric Name | Metric Display Name | Unit | Description |
|---|---|---|---|---|
| Fortinet FortiWeb Performance | fortinet_fortiweb_fwSysCpuUtilization | Fortinet FortiWeb System CPU Utilization | % | Monitors the fortinet fortiweb system CPU utilization.[FORTINET-FORTIWEB-MIB::fwSysCpuUsage:1.3.6.1.4.1.12356.107.2.1.5.0] |
| fortinet_Fortiweb_fwSysDiskUtilization | Fortinet FortiWeb System Disk Utilization | % | Monitors the fortinet fortiweb system disk utilization.[FORTINET-FORTIWEB-MIB::fwSysDiskUsage:1.3.6.1.4.1.12356.107.2.1.9.0,fwSysDiskCapacity:1.3.6.1.4.1.12356.107.2.1.10.0] | |
| fortinet_fortiweb_fwSysMemUtilization | Fortinet FortiWeb System Memory Utilization | % | Monitors the fortinet fortiweb system memory utilization.[FORTINET-FORTIWEB-MIB::fwSysMemUsage:1.3.6.1.4.1.12356.107.2.1.7.0,fwSysMemCapacity:1.3.6.1.4.1.12356.107.2.1.8.0] |
Fortinet-Fortigate-FortiAnalyzer and FortiManager Performance
Description
Template for Fortinet Fortigate firewall based - specific applications - such as FM (fortiManager) and FA (FortiAnalyzer)
Prerequisites
No prerequisite
Supported Metric
| Monitor Name | Metric Name | Metric Display Name | Unit | Description |
|---|---|---|---|---|
| Fortinet FortiManager Performance Monitors | fortimanager.system.cpu.utilization | Fortinet FortiManager CPU Utilization | % | This monitor provides the current CPU utilization in percentage. Alert is generated when the utlization exceeds the given threshold.[OID : 1.3.6.1.4.1.12356.103.2.1.1] |
| fortimanager.system.disk.utilization | Fortinet FortiManager Disk Utilization | % | This monitor provides the current disk utilization from the total hard disk capacity in percentage. Alert is generated when the utlization exceeds the threshold percentage.[OID : 1.3.6.1.4.1.12356.103.2.1.4,1.3.6.1.4.1.12356.103.2.1.5] | |
| fortimanager.system.memory.utilization | Fortinet FortiManager Memory Utilization | % | This monitor provides the current memory utilization from the total physical and swap memory installed in percentage. Alert is generated when the utiliation exceeds the threshold percentage.[OID : 1.3.6.1.4.1.12356.103.2.1.2,1.3.6.1.4.1.12356.103.2.1.3] |
Fortinet-Fortigate-FW-HA Cluster Performance
Description
Template to monitor Fortinet Fortigate Firewall High Availability cluster unit performance metrics like CPU usage,Memory usage,Network bandwidth utilization,Session count and cluster sync status. This template is created on FORTINET-FORTIGATE-MIB OIDs and validated on FGT_301E [SysObjId: 1.3.6.1.4.1.12356.101.1.3008]
Prerequisites
Device should respond for FORTINET-FORTIGATE-MIB::fgHaStatsTable OID
Supported Metric
| Monitor Name | Metric Name | Metric Display Name | Unit | Description |
|---|---|---|---|---|
| Fortinet Fortigate High Availability Cluster Performance - Ext | fortinet.fortigate.ha.stats.cpu.util | Fortigate HA CPU Utlization | % | Provides the Fortinet Fortigate HA stats CPU utilization percentage of the specified cluster member [OID: 1.3.6.1.4.1.12356.101.13.2.1.1.3] |
| fortinet.fortigate.ha.stats.memory.util | Fortigate HA Memory Utlization | % | Provides the Fortinet Fortigate memory utilization percentage of the specified cluster member [OID: 1.3.6.1.4.1.12356.101.13.2.1.1.4] | |
| fortinet.fortigate.ha.stats.network.util | Fortigate HA Network Utlization | Kbps | Provides the Fortinet Fortigate network bandwidth usage of specified cluster member (in kbps) [FORTINET-FORTIGATE-MIB::fgHaStatsNetUsage - 1.3.6.1.4.1.12356.101.13.2.1.1.5] | |
| fortinet.fortigate.ha.stat.session.count | Fortigate HA Session Count | It represents the current session count of specified cluster member.[FORTINET-FORTIGATE-MIB::fgHaStatsSesCount - 1.3.6.1.4.1.12356.101.13.2.1.1.6] | ||
| fortinet.fortigate.ha.stat.sync.status | Fortigate HA Cluster Sync Status | Represents the current ha cluster sync status. Possible status values are 0 - unsynchronized and 1- synchronized.[FORTINET-FORTIGATE-MIB::fgHaStatsSyncStatus - 1.3.6.1.4.1.12356.101.13.2.1.1.12] |
Fortinet-Fortigate-FW-Statistics
Description
Template to monitor Fortinet Fortigate Firewall Anti-virus statistics,IPS/IDS statistics and Web-filter statistics for a particular virtual domain. This template is created on FORTINET-FORTIGATE-MIB OIDs and validated on FGT_301E [SysObjId: 1.3.6.1.4.1.12356.101.1.3008]
Prerequisites
Device should respond for FORTINET-FORTIGATE-MIB OIDs.
Supported Metric
| Monitor Name | Metric Name | Metric Display Name | Unit | Description |
|---|---|---|---|---|
| Fortinet Fortigate Intrusion - With Component VD Name | fortinet.fortigate.intrusion.detected | Fortinet Fortigate Intrusion Detected | Provides the Fortinet Fortigate number of intrusions detected since start-up in this virtual domain [OID: 1.3.6.1.4.1.12356.101.9.2.1.1.1,1.3.6.1.4.1.12356.101.9.2.1.1.2] | |
| fortinet.fortigate.intrusions.blocked | Fortinet Fortigate Intrusions Blocked | Number of intrusions blocked since start-up in this virtual domain.[OID : 1.3.6.1.4.1.12356.101.9.2.1.1.2] | ||
| Fortinet Fortigate Virus - With Component VD Name | fortinet.fortigate.virus.detected | Fortinet Fortigate Virus Detected | Provides the Fortinet Fortigate number of virus transmissions detected in the virtual domain since start-up.[OID : 1.3.6.1.4.1.12356.101.8.2.1.1.1] | |
| fortinet.fortigate.virus.blocked | Fortinet Fortigate Virus Blocked | Provides the Fortinet Fortigate umber of virus transmissions blocked in the virtual domain since start-up [OID: 1.3.6.1.4.1.12356.101.8.2.1.1.2]. | ||
| Fortinet Fortigate Webfilter Stats - With Component VD Name | fortinet.webfilter.http.sessions.blocked | Fortinet Webfilter HTTP Sessions Blocked | Provides the Fortinet Fortigate number of HTTP sessions blocked by Web-filter since start-up.[OID : 1.3.6.1.4.1.12356.101.10.1.2.1.1.1] | |
| fortinet.webfilter.https.sessions.blocked | Fortinet Webfilter HTTPS Sessions Blocked | Provides the Fortinet Fortigate number of HTTPS sessions blocked by Web-filter since start-up.[OID : 1.3.6.1.4.1.12356.101.10.1.2.1.1.2] | ||
| fortinet.webfilter.http.urls.blocked | Fortinet Webfilter HTTP URLs Blocked | Provides the Fortinet Fortigate number of HTTP URLS blocked by Web-filter since start-up.[OID : 1.3.6.1.4.1.12356.101.10.1.2.1.1.3] | ||
| fortinet.webfilter.https.urls.blocked | Fortinet Webfilter HTTPS URLs Blocked | Provides the Fortinet Fortigate number of HTTPS URLS blocked by Web-filter since start-up .[OID : 1.3.6.1.4.1.12356.101.10.1.2.1.1.4] |
Fortinet-Fortigate-FW-System Performance
Description
Template to monitor Fortinet Fortigate Firewall System performance parameters like CPU utilization,Memory utilization,Disk utilization,Active Sessions and Low Memory Utilization. This template is created on FORTINET-FORTIGATE-MIB OIDs and validated on FGT_301E [SysObjId: 1.3.6.1.4.1.12356.101.1.3008]
Prerequisites
Device should respond for FORTINET-FORTIGATE-MIB OIDs.
Supported Metric
| Monitor Name | Metric Name | Metric Display Name | Unit | Description |
|---|---|---|---|---|
| Fortinet Fortigate Performance Monitors - Ext | fortinet.fortigate.cpu.utilization | Fortigate CPU Utilization | % | Provides the Fortinet Fortigate CPU Utilization percentage [OID: 1.3.6.1.4.1.12356.101.4.1.3.0] |
| fortinet.fortigate.memory.utilization | Fortigate Memory Utilization | % | Provides the Fortinet Fortigate current memory utilization (percentage) and total physical memory (RAM) installed (KB) [OID: 1.3.6.1.4.1.12356.101.4.1.4.0,1.3.6.1.4.1.12356.101.4.1.5.0] | |
| fortinet.fortigate.disk.utilization | Fortigate Disk Utilization | % | Provides the Fortinet Fortigate total hard disk capacity (MB),if disk is present and current hard disk usage (MB) and disk utilization percentage [OID: 1.3.6.1.4.1.12356.101.4.1.7.0,1.3.6.1.4.1.12356.101.4.1.6.0] | |
| fortinet.fortigate.sessions.count | Active Sessions | It represents the number of active sessions on the device.[FORTINET-FORTIGATE-MIB::fgSysSesCount.0 - 1.3.6.1.4.1.12356.101.4.1.8.0] | ||
| fortinet.fortigate.low.memory.utilization | Low Memory Utilization | % | It represents current lowmem utilization (percentage). Lowmem is memory available for the kernel's own data structures and kernel specific tables. The system can get into a bad state if it runs out of lowmem.[FORTINET-FORTIGATE-MIB::fgSysLowMemUsage.0 - 1.3.6.1.4.1.12356.101.4.1.9.0,fgSysLowMemCapacity.0 - 1.3.6.1.4.1.12356.101.4.1.10.0] |
Fortinet Fortigate License Expiry Monitor - Ext
Description
Monitors the Fortinet Fortigate Contract License Expiry Time and Version License Expiry Time in Days.[ FORTINET-FORTIGATE-MIB :: fgLicContractExpiry : 1.3.6.1.4.1.12356.101.4.6.3.1.2.1.2, fgLicVersionExpiry : 1.3.6.1.4.1.12356.101.4.6.3.2.2.1.2 ]
Note: “For these metrics, we are receiving the expiry time in both ‘Date Format’ and ‘n/a’ string formats directly from the End Device. To monitor the Contract License Expiry Time and Version License Expiry Time in days, we are disregarding the metrics that contain ‘n/a’ values and returning the remaining metric values in days”. Validated on Fortinet Firewall FortiGate-60E v6.4.10,build2000,220824 (GA.M) [ SysObjectOID :: 1.3.6.1.4.1.12356.101.1.641 ]
Prerequisites
Device must have support for FORTINET-FORTIGATE-MIB
Supported Metric
| Monitor Name | Metric Name | Metric Display Name | Unit | Description |
|---|---|---|---|---|
| Fortinet Fortigate License Expiry Monitor - Ext | fortinet_fortigate_ContractLicenseExpiry | Fortinet Fortigate Contract License Expiry | Days | Monitors the Fortinet Fortigate Contract License Expiry Time in Days.[ FORTINET-FORTIGATE-MIB :: fgLicContractExpiry : 1.3.6.1.4.1.12356.101.4.6.3.1.2.1.2 ] Note: "For this metric, we are receiving the expiry time in both 'Date Format' and 'n/a' string formats directly from the End Device. To monitor the Contract License Expiry Time in days, we are disregarding the metrics that contain 'n/a' values and returning the remaining metric values in days." |
| fortinet_fortigate_VersionLicenceExpiry | Fortinet Fortigate Version License Expiry | Days | Monitors the Fortinet Fortigate Version License Expiry Time in Days. [ FORTINET-FORTIGATE-MIB :: fgLicVersionExpiry : 1.3.6.1.4.1.12356.101.4.6.3.2.2.1.2] Note: "For this metric, we are receiving the expiry time in both 'Date Format' and 'n/a' string formats directly from the End Device. To monitor the Version License Expiry Time in days, we are disregarding the metrics that contain 'n/a' values and returning the remaining metric values in days." |
FTP Template
Description
FTP Template
Prerequisites
No prerequisite
Supported Metric
| Monitor Name | Metric Name | Metric Display Name | Unit | Description |
|---|---|---|---|---|
| FTP Monitor | ftp.transmit.time | FTP Transmit Time | s | FTP Transmit Time |
| ftp.receive.time | FTP Receive Time | s | FTP Receive Time | |
| ftp.transmit.speed | FTP Transmit Speed | Bps | FTP Transmit Speed | |
| ftp.receive.speed | FTP Receive Speed | Bps | FTP Receive Speed | |
| ftp.response.time | FTP Response Time | s | Response Time | |
| ftp.service.status | FTP Service Status | NULL | Service Status UP 0 Down 1 |
FTP Template Monitor
Description
FTP Template Monitor
Prerequisites
No prerequisite
Supported Metric
| Monitor Name | Metric Name | Metric Display Name | Unit | Description |
|---|---|---|---|---|
| FTP Monitor | ftp.transmit.time | FTP Transmit Time | s | FTP Transmit Time |
| ftp.receive.time | FTP Receive Time | s | FTP Receive Time | |
| ftp.transmit.speed | FTP Transmit Speed | Bps | FTP Transmit Speed | |
| ftp.receive.speed | FTP Receive Speed | Bps | FTP Receive Speed | |
| ftp.response.time | FTP Response Time | s | Response Time | |
| ftp.service.status | FTP Service Status | NULL | Service Status UP 0 Down 1 |
Fujitsu Raid Server Statistics
Description
Template to monitor the fujitsu raid server statistics like fujitsu raid logical drive status,fujitsu raid physical device status,fujitsu raid controller status,fujitsu raid server overall status.[FSC-RAID-MIB]
Prerequisites
No prerequisite
Supported Metric
| Monitor Name | Metric Name | Metric Display Name | Unit | Description |
|---|---|---|---|---|
| Fujitsu Raid Controller Status | fujitsu_raid_svrCtrlStatus | Fujitsu Raid Server Controller Status | Monitors the fujitsu raid server controller status.[FSC-RAID-MIB::svrCtrlStatus:1.3.6.1.4.1.231.2.49.1.4.2.1.15].Possible values are ok(1),prefailure(2),failure(3) | |
| fujitsu_raid_svrCtrlBBUStatus | Fujitsu Raid Server Controller Battery Backup Unit Status | Monitors the fujitsu raid server controller battery backup unit status.[FSC-RAID-MIB::svrCtrlBBUStatus:1.3.6.1.4.1.231.2.49.1.4.2.1.14].Possible values are notAvailable(1),onLine(2),onBattery(3)onBatteryLow(4),charging(5),discharging(6),failed(7). | ||
| fujitsu_raid_svrCtrlBBUStatusEx | Fujitsu Raid Server Controller Battery Backup Unit Status EX | Monitors the fujitsu raid server controller battery backup unit status EX.[FSC-RAID-MIB::svrCtrlBBUStatusEx:1.3.6.1.4.1.231.2.49.1.4.2.1.24].Possible values are unknown(1),notInstalled(2),normal(3),charging(4),discharging(5),warning(6),failed(7). | ||
| Fujitsu Raid Logical Drive Status | fujitsu_raid_svrLogicalDriveStatusEx | Fujitsu Raid Server Logical Drive Status Ex | Monitors the Fujitsu Raid Server Logical Drive Status Ex[FSC-RAID-MIB::svrLogicalDriveStatusEx:1.3.6.1.4.1.231.2.49.1.6.2.1.19]. Possible values are unknown(1),operational(2),partiallyDegraded(3),degraded(4),failed(5),rebuilding(6),checking(7),mdcing(8),initializing(9),backgroundInitializing(10),migrating(11),copying(12),offline(13),spareInUse(14),erasing(15). | |
| fujitsu_raid_svrLogicalDriveStatus | Fujitsu Raid Server Logical Drive Status | Monitors the fujitsu raid Server logical drive status.[FSC-RAID-MIB::svrLogicalDriveStatus:1.3.6.1.4.1.231.2.49.1.6.2.1.10].Possible values are unknown(1),online(2),degraded(3),offline(4),rebuilding(5),verifying(6),initializing(7),morphing(8),partialDegraded(9) | ||
| fujitsu_raid_svrLogicalDriveInitStatus | Fujitsu Raid Server Logical Drive Initialization Status | Monitors the fujitsu raid server logical drive initialization status.[FSC-RAID-MIB::svrLogicalDriveInitStatus:1.3.6.1.4.1.231.2.49.1.6.2.1.18]. Possible values are unknown(1),initialized(2),notInitialized(3). | ||
| fujitsu_raid_svrLogicalDriveTotalSize | Fujitsu Raid Server Logical Drive Total Size | GB | Monitors the fujitsu raid server logical drive total size.[FSC-RAID-MIB::svrLogicalDriveTotalSize:1.3.6.1.4.1.231.2.49.1.6.2.1.4] | |
| Fujitsu Raid Physical Device Status | fujitsu_raid_svrPhysicalDeviceErrors | Fujitsu Raid Server Physical Device Errors | count | Monitors the fujitsu raid server physical device errors.[FSC-RAID-MIB::svrPhysicalDeviceErrors:1.3.6.1.4.1.231.2.49.1.5.2.1.12] |
| fujitsu_raid_SvrPhysicalDeviceStatus | Fujitsu Raid Server Physical Device Status | Monitors the fujitsu raid server physical device status.[FSC-RAID-MIB::svrPhysicalDeviceStatus:1.3.6.1.4.1.231.2.49.1.5.2.1.15]. Possible values are unknown(1),noDisk(2),online(3),ready(4),failed(5),rebuilding(6),hotspareGlobal(7),hotspareDedicated(8),offline(9),unconfiguredFailed(10),formatting(11),dead(12). | ||
| fujitsu_raid_svrPhysicalDevicePowerStatus | Fujitsu Raid Server Physical Device Power Status | Monitors the fujitsu raid server physical device power status.[FSC-RAID-MIB::svrPhysicalDevicePowerStatus:1.3.6.1.4.1.231.2.49.1.5.2.1.25]. Possible values are active(1),stopped(2),transition(3). | ||
| fujitsu_raid_SvrPhysicalDeviceSmartStatus | Fujitsu Raid Server Physical Device Smart Status | Monitors the fujitsu raid server physical device status.[FSC-RAID-MIB::svrPhysicalDeviceSmartStatus:1.3.6.1.4.1.231.2.49.1.5.2.1.14].Possible values are ok(1),failurePredicted(2),smartNotAvailable(3),smartMonitoringDisabled(4) | ||
| fujitsu_raid_svrPhysicalDeviceCapacity | Fujitsu Raid Server Physical Device Capacity | GB | Monitors the Fujitsu raid server physical device capacity.[FSC-RAID-MIB::svrPhysicalDeviceCapacity:1.3.6.1.4.1.231.2.49.1.5.2.1.7]. | |
| fujitsu_raid_svrPhysicalDeviceStatusEx | Fujitsu Raid Server Physical Device Status Ex | Monitors the fujitsu raid server physical device status Ex.[FSC-RAID-MIB::svrPhysicalDeviceStatusEx:1.3.6.1.4.1.231.2.49.1.5.2.1.20].Possible values are unknown(1),noDisk(2),available(3),operational(4),failed(5),rebuilding(6),globalHotSpare(7),dedicatedHotSpare(8),offline(9),unconfiguredFailed(10),failedMissing(11),copyBack(12),redundantCopy(13),waiting(14),preparing(15),migrating(16),jbod(17),shielded(18),clearing(19),erasing(20). | ||
| Fujitsu Raid Server Status | fujitsu_raid_svrStatusPhysicalDevices | Fujitsu Raid Server Status Physical Devices | Monitors the Fujitsu raid server status physical devices.[FSC-RAID-MIB::svrStatusPhysicalDevices:1.3.6.1.4.1.231.2.49.1.3.2.0].Possible values are ok(1),prefailure(2),failure(3). | |
| fujitsu_raid_svrStatusLogicalDrives | Fujitsu Raid Server Status Logical Drives | Monitors the fujitsu raid server status logical drives.[FSC-RAID-MIB::svrStatusLogicalDrives:1.3.6.1.4.1.231.2.49.1.3.1].Possible values are ok(1),prefailure(2),failure(3). | ||
| fujitsu_raid_svrStatusOverall | Fujitsu Raid Server Status Overall | Monitors the fujitsu raid server status overall.[FSC-RAID-MIB::svrStatusOverall:1.3.6.1.4.1.231.2.49.1.3.4].Possible values are ok(1),prefailure(2),failure(3). | ||
| fujitsu_raid_svrStatusControllers | Fujitsu Raid Server Status Controllers | Monitors the fujitsu raid server status controllers.[FSC-RAID-MIB::svrStatusControllers:1.3.6.1.4.1.231.2.49.1.3.3.0].Possible values are ok(1),prefailure(2),failure(3). |
Fujitsu Storage Disk Array E150
Description
Template to monitor Fujitsu Storage Disk Array parameters like BCU Status,BTU parameters like Status,Charge,BUD Status,Channel Adapter Status,Controller Enclosure Inlet Thermal Sensor Status,Controller Enclosure PSU Status,Controller Enclosure Status,Controller Enclosure Thermal Sensor Status,Controller Module CPU Status,Controller Module Fan Status,Controller Module Memory Status,Controller Module NAS Performance parameters like CPU Busy,Free Memory,disk parameters like Status,Component Status,Drive Enclosure Inlet Thermal Sensor Status,Drive Enclosure Status,Drive Enclosure Thermal Sensor Status,Enclosure Power,FEM Status,IOM Status,LAN Port parameters like MNT Port State,RMT Port State,FST Port State,Machine Temperature,Mgt Open Volume Status,Mgt Raid Group Status,Overall System Status,PFM Status,PSU Status,SCU parameters like Status,Voltage. This template is applicable on DX60 S3,DX100 S3,DX200,DX500 S3,DX600 S3,DX8100 S3,AF250,AF650.
Prerequisites
No prerequisite
Supported Metric
| Monitor Name | Metric Name | Metric Display Name | Unit | Description |
|---|---|---|---|---|
| Fujitsu Disk Array - BCU Status | fujitsu_diskarray_BCUStatus | Fujitsu Disk Array BCU Status | It monitors the state of this BTU/BBU. But,it doesn't become warning or alarm when maintaining it. Possible values are normal(1),alarm(2),warning(3),invalid(4),maintenance(5),undefined(6).[FJDARY-E150::fjdaryBcuStatus:1.3.6.1.4.1.211.1.21.1.150.2.7.2.1.3]. | |
| Fujitsu Disk Array - BTU | fujitsu_diskarray_BTUCharge | Fujitsu Disk Array BTU Charge | % | It monitors the charge rate of BTU/BBU.[FJDARY-E150::fjdaryBtuCharge:1.3.6.1.4.1.211.1.21.1.150.2.8.2.1.5]. |
| fujitsu_diskarray_BTUStatus | Fujitsu Disk Array BTU Status | It monitors the state of this BTU/BBU. But,it doesn't become warning or alarm when maintaining it. Possible values are normal(1),alarm(2),warning(3),invalid(4),maintenance(5),undefined(6).[FJDARY-E150::fjdaryBtuStatus:1.3.6.1.4.1.211.1.21.1.150.2.8.2.1.3]. | ||
| Fujitsu Disk Array - BUD Status | fujitsu_diskarray_BUDStatus | Fujitsu Disk Array BUD Status | It monitors the state of this BUD. But,it doesn't become warning or alarm when maintaining it. Possible values are normal(1),alarm(2),warning(3),invalid(4),maintenance(5),undefined(6).[FJDARY-E150::fjdaryBudStatus:1.3.6.1.4.1.211.1.21.1.150.2.5.2.1.3]. | |
| Fujitsu Disk Array - Channel Adapter Status | fujitsu_diskarray_ChannelAdapterStatus | Fujitsu Disk Array Channel Adapter Status | It monitors the state of this CA. But,it doesn't become warning or alarm when maintaining it. Possible values are normal(1),alarm(2),warning(3),invalid(4),maintenance(5),undefined(6).[FJDARY-E150::fjdaryCaStatus:1.3.6.1.4.1.211.1.21.1.150.2.3.2.1.3]. | |
| Fujitsu Disk Array - Controller Enclosure Inlet Thermal Sensor Status | fujitsu_diskarray_controllerenclosure_InletThermalSensorStatus | Fujitsu Disk Array Controller Enclosure Inlet Thermal Sensor Status | It monitors the state of this CE inlet thermal sensor. But,it doesn't become warning or alarm when maintaining it. Possible values are normal(1),alarm(2),warning(3),invalid(4),maintenance(5),undefined(6).[FJDARY-E150::fjdaryCeinletthmlStatus:1.3.6.1.4.1.211.1.21.1.150.2.11.2.1.3]. | |
| Fujitsu Disk Array - Controller Enclosure PSU Status | fujitsu_diskarray_controllerenclosure_PSUStatus | Fujitsu Disk Array Controller Enclosure PSU Status | It monitors the state of this CPSU. But,it doesn't become warning or alarm when maintaining it. Possible values are normal(1),alarm(2),warning(3),invalid(4),maintenance(5),undefined(6).[FJDARY-E150::fjdaryCpsuStatus:1.3.6.1.4.1.211.1.21.1.150.2.13.2.1.3]. | |
| Fujitsu Disk Array - Controller Enclosure Status | fujitsu_diskarray_controllerenclosure_Status | Fujitsu Disk Array Controller Enclosure Status | It monitors the state of this CE. But,it doesn't become warning or alarm when maintaining it. Possible values are normal(1),alarm(2),warning(3),invalid(4),maintenance(5),undefined(6)[FJDARY-E150::fjdaryCeStatus:1.3.6.1.4.1.211.1.21.1.150.2.10.2.1.3]. | |
| Fujitsu Disk Array - Controller Enclosure Thermal Sensor Status | fujitsu_diskarray_controllerenclosure_ThermalSensorStatus | Fujitsu Disk Array Controller Enclosure Thermal Sensor Status | It monitors the state of this CE thermal sensor. But,it doesn't become warning or alarm when maintaining it. Possible values are normal(1),alarm(2),warning(3),invalid(4),maintenance(5),undefined(6).[FJDARY-E150::fjdaryCethmlStatus:1.3.6.1.4.1.211.1.21.1.150.2.12.2.1.3]. | |
| Fujitsu Disk Array - Controller Module CPU Status | fujitsu_diskarray_controllermodule_CPUStatus | Fujitsu Disk Array Controller Module CPU Status | It monitors the state of this CM CPU. But,it doesn't become warning or alarm when maintaining it. Possible values are normal(1),alarm(2),warning(3),invalid(4),maintenance(5),undefined(6).[FJDARY-E150::fjdaryCmcpuStatus:1.3.6.1.4.1.211.1.21.1.150.2.2.2.1.3]. | |
| Fujitsu Disk Array - Controller Module Fan Status | fujitsu_diskarray_controllermodule_FanStatus | Fujitsu Disk Array Controller Module Fan Status | It monitors the state of this CM fan. But,it doesn't become warning or alarm when maintaining it. Possible values are normal(1),alarm(2),warning(3),invalid(4),maintenance(5),undefined(6).[FJDARY-E150::fjdaryCmfanStatus:1.3.6.1.4.1.211.1.21.1.150.2.6.2.1.3]. | |
| Fujitsu Disk Array - Controller Module Memory Status | fujitsu_diskarray_controllermodule_MemoryStatus | Fujitsu Disk Array Controller Module Memory Status | It monitors the state of this CM memory. But,it doesn't become warning or alarm when maintaining it. Possible values are normal(1),alarm(2),warning(3),invalid(4),maintenance(5),undefined(6).[FJDARY-E150::fjdaryCmmemoryStatus:1.3.6.1.4.1.211.1.21.1.150.2.4.2.1.3]. | |
| Fujitsu Disk Array - Controller Module NAS Performance | fujitsu_diskarray_controllermodule_nas_CPUBusy | Fujitsu Disk Array Controller Module NAS CPU Busy | % | It monitors the average of CPU busy rate for NAS.[FJDARY-E150::fjdaryPfCmNasCPUBusy:1.3.6.1.4.1.211.1.21.1.150.5.16.2.1.12]. |
| fujitsu_diskarray_controllermodule_nas_FreeMemory | Fujitsu Disk Array Controller Module NAS Free Memory | MB | It monitors the unused amount of the memory.[FJDARY-E150::fjdaryPfCmNasFreeMemory:1.3.6.1.4.1.211.1.21.1.150.5.16.2.1.13]. | |
| Fujitsu Disk Array - Disk | fujitsu_diskarray_DiskComponentStatus | Fujitsu Disk Array Disk Component Status | It monitors the the state of this disk. But,it doesn't become warning or alarm when maintaining it. Possible values are normal(1),alarm(2),warning(3),invalid(4),maintenance(5),undefined(6).[FJDARY-E150::fjdaryDiskCompStatus:1.3.6.1.4.1.211.1.21.1.150.2.19.2.1.5]. | |
| fujitsu_diskarray_DiskStatus | Fujitsu Disk Array Disk Status | It monitors the state of this Disk. But,it doesn't become warning or alarm when maintaining it. Possible values are available(1),broken(2),notavailable(3),notsupported(4),present(5),readying(6),recovering(7),partbroken(64),spare(65),formatting(66),unformatted(67),notexist(68),copying(69).[FJDARY-E150::fjdaryDiskStatus:1.3.6.1.4.1.211.1.21.1.150.2.19.2.1.3]. | ||
| Fujitsu Disk Array - Drive Enclosure Inlet Thermal Sensor Status | fujitsu_diskarray_driveenclosure_InletThermalSensorStatus | Fujitsu Disk Array Drive Enclosure Inlet Thermal Sensor Status | It monitors the state of this DE inlet thermal sensor. But,it doesn't become warning or alarm when maintaining it. Possible values are normal(1),alarm(2),warning(3),invalid(4),maintenance(5),undefined(6).[FJDARY-E150::fjdaryDeinletthmlStatus:1.3.6.1.4.1.211.1.21.1.150.2.17.2.1.3]. | |
| Fujitsu Disk Array - Drive Enclosure Status | fujitsu_diskarray_driveenclosure_Status | Fujitsu Disk Array Drive Enclosure Status | It monitors the state of this DE. But,it doesn't become warning or alarm when maintaining it. Possible values are normal(1),alarm(2),warning(3),invalid(4),maintenance(5),undefined(6).[FJDARY-E150::fjdaryDeStatus:1.3.6.1.4.1.211.1.21.1.150.2.14.2.1.3]. | |
| Fujitsu Disk Array - Drive Enclosure Thermal Sensor Status | fujitsu_diskarray_driveenclosure_ThermalSensorStatus | Fujitsu Disk Array Drive Enclosure Thermal Sensor Status | It monitors the state of this DE thermal sensor. But,it doesn't become warning or alarm when maintaining it. Possible values are normal(1),alarm(2),warning(3),invalid(4),maintenance(5),undefined(6).[FJDARY-E150::fjdaryDethmlStatus:1.3.6.1.4.1.211.1.21.1.150.2.18.2.1.3]. | |
| Fujitsu Disk Array - Enclosure Power | fujitsu_diskarray_EnclosurePower | Fujitsu Disk Array Enclosure Power | W | It monitors the average power consumption shown during one hour in the past.[FJDARY-E150::fjdaryEncPowerInfo0:1.3.6.1.4.1.211.1.21.1.150.13.2.2.1.7]. |
| Fujitsu Disk Array - FEM Status | fujitsu_diskarray_FEMStatus | Fujitsu Disk Array FEM Status | It monitors the state of this FEM. But,it doesn't become warning or alarm when maintaining it. Possible values are normal(1),alarm(2),warning(3),invalid(4),maintenance(5),undefined(6).[FJDARY-E150::fjdaryFemStatus:1.3.6.1.4.1.211.1.21.1.150.2.21.2.1.3]. | |
| Fujitsu Disk Array - IOM Status | fujitsu_diskarray_IOMStatus | Fujitsu Disk Array IOM Status | It monitors the state of this IOM. But,it doesn't become warning or alarm when maintaining it. Possible values are normal(1),alarm(2),warning(3),invalid(4),maintenance(5),undefined(6).[FJDARY-E150::fjdaryIomStatus:1.3.6.1.4.1.211.1.21.1.150.2.15.2.1.3]. | |
| Fujitsu Disk Array - LAN Port | fujitsu_diskarray_lanport_FSTPortState | Fujitsu Disk Array LAN Port FST Port State | It monitors the FST port state. Possible values are linkup(1),undefined(4),linkdown(6),unknown(7).[FJDARY-E150::fjdaryLanportStatus2:1.3.6.1.4.1.211.1.21.1.150.2.20.2.1.4]. | |
| fujitsu_diskarray_lanport_MNTPortState | Fujitsu Disk Array LAN Port MNT Port State | It monitors the MNT port state. Possible values are linkup(1),undefined(4),linkdown(6),unknown(7).[FJDARY-E150::fjdaryLanportStatus0:1.3.6.1.4.1.211.1.21.1.150.2.20.2.1.2]. | ||
| fujitsu_diskarray_lanport_RMTPortState | Fujitsu Disk Array LAN Port RMT Port State | It monitors the RMT port state. Possible values are linkup(1),undefined(4),linkdown(6),unknown(7).[FJDARY-E150::fjdaryLanportStatus1:1.3.6.1.4.1.211.1.21.1.150.2.20.2.1.3]. | ||
| Fujitsu Disk Array - Machine Temperature | fujitsu_diskarray_MachineTemperature | Fujitsu Disk Array Machine Temperature | Celsius | It monitors the maximum temperature shown during one hour in the past.[FJDARY-E150::fjdaryMachineTempInfo0:1.3.6.1.4.1.211.1.21.1.150.13.3.2.1.5]. |
| Fujitsu Disk Array - Mgt Open Volume Status | fujitsu_diskarray_MgtOpenVolumeStatus | Fujitsu Disk Array Mgt Open Volume Status | It monitors the status of open volume. Possible values are unknown(1),ok(2),degraded(3),error(6),dormant(15).[FJDARY-E150::fjdaryMgtOpVolumeStatus:1.3.6.1.4.1.211.1.21.1.150.14.2.2.1.2]. | |
| Fujitsu Disk Array - Mgt Raid Group Status | fujitsu_diskarray_MgtRaidGroupStatus | Fujitsu Disk Array Mgt Raid Group Status | It monitors the status of raid group. Possible values are unknown(1),ok(2),degraded(3),error(6),dormant(15).[FJDARY-E150::fjdaryMgtRaidGrpStatus:1.3.6.1.4.1.211.1.21.1.150.14.3.2.1.2]. | |
| Fujitsu Disk Array - Overall System Status | fujitsu_diskarray_OverallSystemStatus | Fujitsu Disk Array Overall System Status | It monitors the overall status of this system. Status becomes warning or failed when there are broken parts in the system. But,it doesn't become warning or failed when maintaining it. Possible values are unknown(1),unused(2),ok(3),warning(4),failed(5).[FJDARY-E150::fjdaryUnitStatus:1.3.6.1.4.1.211.1.21.1.150.6.0] | |
| Fujitsu Disk Array - PFM Status | fujitsu_diskarray_PFMStatus | Fujitsu Disk Array PFM Status | It monitors the state of this PFM. But,it doesn't become warning or alarm when maintaining it. Possible values are normal(1),alarm(2),warning(3),invalid(4),maintenance(5),undefined(6).[FJDARY-E150::fjdaryPfmStatus:1.3.6.1.4.1.211.1.21.1.150.2.22.2.1.3]. | |
| Fujitsu Disk Array - PSU Status | fujitsu_diskarray_PSUStatus | Fujitsu Disk Array PSU Status | It monitors the state of this PSU. But,it doesn't become warning or alarm when maintaining it. Possible values are normal(1),alarm(2),warning(3),invalid(4),maintenance(5),undefined(6).[FJDARY-E150::fjdaryPsuStatus:1.3.6.1.4.1.211.1.21.1.150.2.16.2.1.3]. | |
| Fujitsu Disk Array - SCU | fujitsu_diskarray_SCUVoltage | Fujitsu Disk Array SCU Voltage | v | It monitors the voltage of this SCU.[FJDARY-E150::fjdaryScuVoltage:1.3.6.1.4.1.211.1.21.1.150.2.9.2.1.5]. |
| fujitsu_diskarray_SCUStatus | Fujitsu Disk Array SCU Status | It monitors the state of this SCU. But,it doesn't become warning or alarm when maintaining it. Possible values are normal(1),alarm(2),warning(3),invalid(4),maintenance(5),undefined(6).[FJDARY-E150::fjdaryScuStatus:1.3.6.1.4.1.211.1.21.1.150.2.9.2.1.3]. |
Fujitsu Storage Disk Array E153
Description
Template to monitor Fujitsu Storage Disk Array parameters like BCU Status,BTU parameters like Status,Charge,BUD Status,Channel Adapter Status,Controller Enclosure Inlet Thermal Sensor Status,Controller Enclosure PSU Status,Controller Enclosure Status,Controller Enclosure Thermal Sensor Status,Controller Module CPU Status,Controller Module Fan Status,Controller Module Memory Status,disk parameters like Status,Component Status,Drive Enclosure Inlet Thermal Sensor Status,Drive Enclosure Status,Drive Enclosure Thermal Sensor Status,Enclosure Power,FEM Status,IOM Status,LAN Port parameters like MNT Port State,RMT Port State,FST Port State,Machine Temperature,Mgt Open Volume Status,Mgt Raid Group Status,Overall System Status,PSU Status,Mgt Disk Status,Mgt Disk Comp Status,Mgt Pf Disk Busy Rate,Pf Disk Busy Rate,Pf CPU Busy Rate.
Prerequisites
No prerequisite
Supported Metric
| Monitor Name | Metric Name | Metric Display Name | Unit | Description |
|---|---|---|---|---|
| Fujitsu Disk Array E153 - Pf Controller Module CPU | fujitsu_diskarray_e153_PfCmBusy | Fujitsu Disk Array Pf CPU Busy Rate | % | It represents the the average of CPU busy rate.[FJDARY-E153 :: fjdaryPfCmBusy : 1.3.6.1.4.1.211.1.21.1.153.5.4.2.1.2] |
| Fujitsu Disk Array E153 - Pf Disk | fujitsu_diskarray_e153_PfDiskBusy | Fujitsu Disk Array Pf Disk Busy Rate | % | it monitors the disk busy rate in percent.[FJDARY-E153 :: fjdaryPfDiskBusy : 1.3.6.1.4.1.211.1.21.1.153.5.3.2.1.3] |
| Fujitsu Disk Array E153 - BTU | fujitsu_diskarray_e153_BTUStatus | Fujitsu Disk Array BTU Status | It monitors the state of this BTU/BBU. But,it doesn't become warning or alarm when maintaining it. Possible values are normal(1),alarm(2),warning(3),invalid(4),maintenance(5),undefined(6).[FJDARY-E153 :: fjdaryBtuStatus : 1.3.6.1.4.1.211.1.21.1.153.2.8.2.1.3] | |
| fujitsu_diskarray_e153_BTUCharge | Fujitsu Disk Array BTU Charge | % | It monitors the charge rate of BTU/BBU.[FJDARY-E153 :: fjdaryBtuCharge : 1.3.6.1.4.1.211.1.21.1.153.2.8.2.1.5] | |
| Fujitsu Disk Array E153 - BUD Status | fujitsu_diskarray_e153_BUDStatus | Fujitsu Disk Array BUD Status | It monitors the state of this BUD. But,it doesn't become warning or alarm when maintaining it. Possible values are normal(1),alarm(2),warning(3),invalid(4),maintenance(5),undefined(6).[FJDARY-E153 :: fjdaryBudStatus : 1.3.6.1.4.1.211.1.21.1.153.2.5.2.1.3] | |
| Fujitsu Disk Array E153 - Channel Adapter Status | fujitsu_diskarray_e153_ChannelAdapterStatus | Fujitsu Disk Array Channel Adapter Status | It monitors the state of this CA. But,it doesn't become warning or alarm when maintaining it. Possible values are normal(1),alarm(2),warning(3),invalid(4),maintenance(5),undefined(6).[FJDARY-E153 :: fjdaryCaStatus : 1.3.6.1.4.1.211.1.21.1.153.2.3.2.1.3] | |
| Fujitsu Disk Array E153 - Controller Enclosure Inlet Thermal Sensor Status | fujitsu_diskarray_e153_ControllerEnclosureInletThermalSensorStatus | Fujitsu Disk Array Controller Enclosure Inlet Thermal Sensor Status | It monitors the state of this CE inlet thermal sensor. But,it doesn't become warning or alarm when maintaining it. Possible values are normal(1),alarm(2),warning(3),invalid(4),maintenance(5),undefined(6).[FJDARY-E153 :: fjdaryCeinletthmlStatus : 1.3.6.1.4.1.211.1.21.1.153.2.11.2.1.3] | |
| Fujitsu Disk Array E153 - Controller Enclosure PSU Status | fujitsu_diskarray_e153_ControllerEnclosurePSUStatus | Fujitsu Disk Array Controller Enclosure PSU Status | It monitors the state of this CPSU. But,it doesn't become warning or alarm when maintaining it. Possible values are normal(1),alarm(2),warning(3),invalid(4),maintenance(5),undefined(6).[FJDARY-E153 :: fjdaryCpsuStatus : 1.3.6.1.4.1.211.1.21.1.153.2.13.2.1.3] | |
| Fujitsu Disk Array E153 - Controller Enclosure Status | fujitsu_diskarray_e153_ControllerEnclosureStatus | Fujitsu Disk Array Controller Enclosure Status | t monitors the state of this CE. But,it doesn't become warning or alarm when maintaining it. Possible values are normal(1),alarm(2),warning(3),invalid(4),maintenance(5),undefined(6).[FJDARY-E153 :: fjdaryCeStatus : 1.3.6.1.4.1.211.1.21.1.153.2.10.2.1.3] | |
| Fujitsu Disk Array E153 - Controller Enclosure Thermal Sensor Status | fujitsu_diskarray_e153_ControllerEnclosureThermalSensorStatus | Fujitsu Disk Array Controller Enclosure Thermal Sensor Status | It monitors the state of this CE thermal sensor. But,it doesn't become warning or alarm when maintaining it. Possible values are normal(1),alarm(2),warning(3),invalid(4),maintenance(5),undefined(6).[FJDARY-E153 :: fjdaryCethmlStatus : 1.3.6.1.4.1.211.1.21.1.153.2.12.2.1.3] | |
| Fujitsu Disk Array E153 - Controller Module CPU Status | fujitsu_diskarray_e153_ControllerModuleCPUStatus | Fujitsu Disk Array Controller Module CPU Status | It monitors the state of this CM CPU. But,it doesn't become warning or alarm when maintaining it. Possible values are normal(1),alarm(2),warning(3),invalid(4),maintenance(5),undefined(6).[FJDARY-E153 :: fjdaryCmcpuStatus : 1.3.6.1.4.1.211.1.21.1.153.2.2.2.1.3] | |
| Fujitsu Disk Array E153 - Controller Module Memory Status | fujitsu_diskarray_e153_ControllerModuleMemoryStatus | Fujitsu Disk Array Controller Module Memory Status | It monitors the state of this CM memory. But,it doesn't become warning or alarm when maintaining it. Possible values are normal(1),alarm(2),warning(3),invalid(4),maintenance(5),undefined(6).[FJDARY-E153 :: fjdaryCmmemoryStatus : 1.3.6.1.4.1.211.1.21.1.153.2.4.2.1.3] | |
| Fujitsu Disk Array E153 - Controller Module Status | fujitsu_diskarray_e153_ControllerModuleStatus | Fujitsu Disk Array Controller Module Status | It monitors the status of Controller Module. But,it doesn't become warning or alarm when maintaining it. Possible values are normal(1),alarm(2),warning(3),invalid(4),maintenance(5),undefined(6).[FJDARY-E153 :: fjdaryCmStatus : 1.3.6.1.4.1.211.1.21.1.153.2.1.2.1.3] | Fujitsu Disk Array E153 - Disk | fujitsu_diskarray_e153_DiskComponentStatus | Fujitsu Disk Array Disk Component Status | It monitors the the state of this disk. But,it doesn't become warning or alarm when maintaining it. Possible values are normal(1),alarm(2),warning(3),invalid(4),maintenance(5),undefined(6).[FJDARY-E153 :: fjdaryDiskCompStatus : 1.3.6.1.4.1.211.1.21.1.153.2.19.2.1.5] |
| fujitsu_diskarray_e153_DiskStatus | Fujitsu Disk Array Disk Status | It monitors the state of this Disk. But,it doesn't become warning or alarm when maintaining it. Possible values are available(1),broken(2),notavailable(3),notsupported(4),present(5),readying(6),recovering(7),partbroken(64),spare(65),formatting(66),unformatted(67),notexist(68),copying(69).[FJDARY-E153 :: fjdaryDiskStatus : 1.3.6.1.4.1.211.1.21.1.153.2.19.2.1.3] | ||
| Fujitsu Disk Array E153 - Drive Enclosure Inlet Thermal Sensor Status | fujitsu_diskarray_e153_DriveEnclosureInletThermalSensorStatus | Fujitsu Disk Array Drive Enclosure Inlet Thermal Sensor Status | It monitors the state of this DE inlet thermal sensor. But,it doesn't become warning or alarm when maintaining it. Possible values are normal(1),alarm(2),warning(3),invalid(4),maintenance(5),undefined(6).[FJDARY-E153 :: fjdaryDeinletthmlStatus : 1.3.6.1.4.1.211.1.21.1.153.2.17.2.1.3] | |
| Fujitsu Disk Array E153 - Drive Enclosure Status | fujitsu_diskarray_e153_DriveEnclosureStatus | Fujitsu Disk Array Drive Enclosure Status | It monitors the state of this DE. But,it doesn't become warning or alarm when maintaining it. Possible values are normal(1),alarm(2),warning(3),invalid(4),maintenance(5),undefined(6).[FJDARY-E153 :: fjdaryDeStatus : 1.3.6.1.4.1.211.1.21.1.153.2.14.2.1.3] | |
| Fujitsu Disk Array E153 - Drive Enclosure Thermal Sensor Status | fujitsu_diskarray_e153_DriveEnclosureThermalSensorStatus | Fujitsu Disk Array Drive Enclosure Thermal Sensor Status | It monitors the state of this DE thermal sensor. But,it doesn't become warning or alarm when maintaining it. Possible values are normal(1),alarm(2),warning(3),invalid(4),maintenance(5),undefined(6).[FJDARY-E153 :: fjdaryDethmlStatus : 1.3.6.1.4.1.211.1.21.1.153.2.18.2.1.3] | |
| Fujitsu Disk Array E153 - Enclosure Power | fujitsu_diskarray_e153_EnclosurePower | Fujitsu Disk Array Enclosure Power | W | It monitors the average power consumption shown during one hour in the past.[FJDARY-E153 :: fjdaryEncPowerInfo0 : 1.3.6.1.4.1.211.1.21.1.153.13.2.2.1.7] |
| Fujitsu Disk Array E153 - FEM Status | fujitsu_diskarray_e153_FEMStatus | Fujitsu Disk Array FEM Status | It monitors the state of this FEM. But,it doesn't become warning or alarm when maintaining it. Possible values are normal(1),alarm(2),warning(3),invalid(4),maintenance(5),undefined(6).[FJDARY-E153 :: fjdaryFemStatus : 1.3.6.1.4.1.211.1.21.1.153.2.21.2.1.3] | |
| Fujitsu Disk Array E153 - IOM Status | fujitsu_diskarray_e153_IOMStatus | Fujitsu Disk Array IOM Status | It monitors the state of this IOM. But,it doesn't become warning or alarm when maintaining it. Possible values are normal(1),alarm(2),warning(3),invalid(4),maintenance(5),undefined(6).[FJDARY-E153 :: fjdaryIomStatus : 1.3.6.1.4.1.211.1.21.1.153.2.15.2.1.3] | |
| Fujitsu Disk Array E153 - Machine Temperature | fujitsu_diskarray_e153_MachineTemperature | Fujitsu Disk Array Machine Temperature | Celsius | It monitors the maximum temperature shown during one hour in the past.[FJDARY-E153 :: fjdaryMachineTempInfo0 : 1.3.6.1.4.1.211.1.21.1.153.13.3.2.1.5] |
| Fujitsu Disk Array E153 - Mgt Disk Status | fujitsu_diskarray_e153_MgtDiskStatus | Fujitsu Disk Array Mgt Disk Status | It monitors the state of Mgt Disk. But,it doesn't become warning or alarm when maintaining it. Possible values are available(1),broken(2),notavailable(3),notsupported(4),present(5),readying(6),recovering(7),partbroken(64),spare(65),formatting(66),unformatted(67),notexist(68),copying(69).[FJDARY-E153 :: fjdaryMgtDiskStatus : 1.3.6.1.4.1.211.1.21.1.153.14.6.2.1.3] | fujitsu_diskarray_e153_MgtDiskCompStatus | Fujitsu Disk Array Mgt Disk Comp Status | It monitors the the state of this disk. But,it doesn't become warning or alarm when maintaining it. Possible values are normal(1),alarm(2),warning(3),invalid(4),maintenance(5),undefined(6).[FJDARY-E153 :: fjdaryMgtDiskCompStatus : 1.3.6.1.4.1.211.1.21.1.153.14.6.2.1.5] |
| Fujitsu Disk Array E153 - Mgt Open Volume Status | fujitsu_diskarray_e153_MgtOpenVolumeStatus | Fujitsu Disk Array Mgt Open Volume Status | It monitors the status of open volume. Possible values are unknown(1),ok(2),degraded(3),error(6),dormant(15).[FJDARY-E153 :: fjdaryMgtOpVolumeStatus : 1.3.6.1.4.1.211.1.21.1.153.14.2.2.1.2] | |
| Fujitsu Disk Array E153 - Mgt Pf Disk | fujitsu_diskarray_e153_MgtPfDiskBusy | Fujitsu Disk Array Mgt Pf Disk Busy Rate | % | It monitors the mgt pf disk busy rate.[FJDARY-E153 :: fjdaryMgtPfDiskBusy : 1.3.6.1.4.1.211.1.21.1.153.14.11.2.1.3] |
| Fujitsu Disk Array E153 - Mgt Raid Group Status | fujitsu_diskarray_e153_MgtRaidGroupStatus | Fujitsu Disk Array Mgt Raid Group Status | It monitors the status of raid group. Possible values are unknown(1),ok(2),degraded(3),error(6),dormant(15).[FJDARY-E153 :: fjdaryMgtRaidGrpStatus : 1.3.6.1.4.1.211.1.21.1.153.14.3.2.1.2] | |
| Fujitsu Disk Array E153 - Overall System Status | fujitsu_diskarray_e153_OverallSystemStatus | Fujitsu Disk Array Overall System Status | It monitors the overall status of this system. Status becomes warning or failed when there are broken parts in the system. But,it doesn't become warning or failed when maintaining it. Possible values are unknown(1),unused(2),ok(3),warning(4),failed(5).[FJDARY-E153 :: fjdaryUnitStatus : 1.3.6.1.4.1.211.1.21.1.153.6] | |
| Fujitsu Disk Array E153 - PSU Status | fujitsu_diskarray_e153_PSUStatus | Fujitsu Disk Array PSU Status | It monitors the state of this PSU. But,it doesn't become warning or alarm when maintaining it. Possible values are normal(1),alarm(2),warning(3),invalid(4),maintenance(5),undefined(6).[FJDARY-E153 :: fjdaryPsuStatus : 1.3.6.1.4.1.211.1.21.1.153.2.16.2.1.3] | |
| Fujitsu Disk Array E153- LAN Port | fujitsu_diskarray_e153_lanport_MNTPortState | Fujitsu Disk Array LAN Port MNT Port State | It monitors the MNT port state. Possible values are linkup(1),undefined(4),linkdown(6),unknown(7).[FJDARY-E153 :: fjdaryLanportStatus0 : 1.3.6.1.4.1.211.1.21.1.153.2.20.2.1.2] | |
| fujitsu_diskarray_e153_lanport_RMTPortState | Fujitsu Disk Array LAN Port RMT Port State | It monitors the RMT port state. Possible values are linkup(1),undefined(4),linkdown(6),unknown(7).[FJDARY-E153 :: fjdaryLanportStatus1 : 1.3.6.1.4.1.211.1.21.1.153.2.20.2.1.3] | ||
| fujitsu_diskarray_e153_lanport_FSTPortState | Fujitsu Disk Array LAN Port FST Port State | It monitors the FST port state. Possible values are linkup(1),undefined(4),linkdown(6),unknown(7).[FJDARY-E153 :: fjdaryLanportStatus2 : 1.3.6.1.4.1.211.1.21.1.153.2.20.2.1.4] |
G2 - Agentless VyOS NOS 2012g VPN Tunnels Status
Description
Monitors the state of VPN tunnels on VyOS, indicating whether the tunnels are up, down, etc.
Prerequisites
- SSH Credentials need to be assigned on end device.
- This template requires Gateway version 14.0.0 or later.
Supported Metric
| Monitor Name | Metric Name | Metric Display Name | Unit | Description |
|---|---|---|---|---|
| G2 - Agentless VyOS NOS 2012g VPN Tunnels Status | vyos_vpn_tunnel_states | VyOS VPN Tunnel States | - | Monitors the state of VPN tunnels on VyOS, indicating whether the tunnels are up, down, etc. |
G2 - Agentless VyOS 1.3.0 VPN Tunnels Monitor
Description
Monitors the state of VPN tunnels on VyOS,indicating whether the tunnels are up,down,etc.
Prerequisites
- File path /opt/vyatta/etc/functions/script-template must be available in the system.
- SSH Credentials need to be assigned on end device.
- script-template file must be available in system
- Requires gateway version 14.0.0 or later.
Template Tags: Agentless
Template Description:
Monitors the status of VPN tunnels on VyOS,providing insights into whether the tunnels are operational or experiencing issues.
Template Usage Guidelines:
While applying this template on the device, users need to provide specific input parameters in any one of the below 2 formats (Either UpTunnels or AllTunnels, along with path of script-template file). The default value is set to “AllTunnels and /opt/vyatta/etc/functions/script-template”
Format 1: Tunnels To Monitor:AllTunnels,Source Path:/opt/vyatta/etc/functions/script-template
If “AllTunnels” is specified as custom script arguments, the script monitors all configured tunnels.
Format 2: Tunnels To Monitor:UpTunnels,Source Path:/opt/vyatta/etc/functions/script-template
If “UpTunnels” is provided as custom script arguments, the script monitors only operational(up) tunnels.
Supported Metric
| Monitor Name | Metric Name | Metric Display Name | Unit | Description |
|---|---|---|---|---|
| G2 - Agentless VyOS 1.3.0 VPN Tunnels Monitor | vyos_vpn_tunnel_states | VyOS VPN Tunnel States | - | Monitors the state of VPN tunnels on VyOS,indicating whether the tunnels are up,down,etc. |
G2 - EMC Clariion LUN Template
Description
G2 - EMC Clariion LUN Template. This Template is applicable for storage array lun.
Prerequisites
No prerequisite
Supported Metric
| Monitor Name | Metric Name | Metric Display Name | Unit | Description |
|---|---|---|---|---|
| G2 - EMC Clariion LUN Monitor | emc.clariion.lun.totalthroughput | EMC CLARiiON LUN Total Throughput | psec | Average number of requests that is passed through the LUN per second.,Command: /opt/Navisphere/bin/naviseccli -h <ip-address> -User <user-name> -Password <password> -Scope 0 lun -list / getlun -all |
| emc.clariion.lun.readthroughput | EMC CLARiiON LUN Read Throughput | psec | Average number of read requests that is passed through the LUN per second.,Command: /opt/Navisphere/bin/naviseccli -h <ip-address> -User <user-name> -Password <password> -Scope 0 lun -list / getlun -all | |
| emc.clariion.lun.writethroughput | EMC CLARiiON LUN Write Throughput | psec | Average number of write requests that is passed through the LUN per second.,Command: /opt/Navisphere/bin/naviseccli -h <ip-address> -User <user-name> -Password <password> -Scope 0 lun -list / getlun -all | |
| emc.clariion.lun.status | EMC CLARiiON LUN Status | Displays the status of the lun.,Command : /opt/Navisphere/bin/naviseccli -h <ip-address> -User <user-name> -Password <password> -Scope 0 lun -list / getlun -all | ||
| emc.clariion.lun.writebandwidth | EMC CLARiiON LUN Write Bandwidth | MBps | The total write bandwidth for the LUN.,Command: /opt/Navisphere/bin/naviseccli -h <ip-address> -User <user-name> -Password <password> -Scope 0 lun -list / getlun -all | |
| emc.clariion.lun.readbandwidth | EMC CLARiiON LUN Read Bandwidth | MBps | The total read bandwidth for the LUN.,Command : /opt/Navisphere/bin/naviseccli -h <ip-address> -User <user-name> -Password <password> -Scope 0 lun -list / getlun -all | |
| emc.clariion.lun.totalbandwidth | EMC CLARiiON LUN Total Bandwidth | MBps | The total bandwidth for the LUN.,Command : /opt/Navisphere/bin/naviseccli -h <ip-address> -User <user-name> -Password <password> -Scope 0 lun -list / getlun -all | |
| emc.clariion.lun.trespasses-spa | EMC CLARiiON LUN Trespasses SPA | The number of trespasses by SP A for the LUN. | ||
| emc.clariion.lun.trespasses-spb | EMC CLARiiON LUN Trespasses SPB | The number of trespasses by SP B for the LUN.,Command : /opt/Navisphere/bin/naviseccli -h <ip-address> -User <user-name> -Password <password> -Scope 0 lun -list / getlun -all | ||
| emc.clariion.lun.trespasses | EMC CLARiiON LUN Trespasses | The total number of trespasses for the LUN.,Command : /opt/Navisphere/bin/naviseccli -h <ip-address> -User <user-name> -Password <password> -Scope 0 lun -list / getlun -all | ||
| emc.clariion.lun.trespasses-pasthour | EMC CLARiiON LUN Trespasses Past Hour | The number of trespasses for the LUN in the past hour.,Command: /opt/Navisphere/bin/naviseccli -h <ip-address> -User <user-name> -Password <password> -Scope 0 lun -list / getlun -all | ||
| emc.clariion.lun.trespasses-state | EMC CLARiiON LUN Trespasses State | State of the LUN Trespass.,Command : /opt/Navisphere/bin/naviseccli -h <ip-address> -User <user-name> -Password <password> -Scope 0 lun -list / getlun -all | ||
| emc.clariion.lun.totalsofterrors | EMC CLARiiON LUN Total Soft Errors | The Soft errors on the LUN.,Command : /opt/Navisphere/bin/naviseccli -h <ip-address> -User <user-name> -Password <password> -Scope 0 lun -list / getlun -all | ||
| emc.clariion.lun.totalharderrors | EMC CLARiiON LUN Total Hard Errors | The Hard errors on the LUN.,Command : /opt/Navisphere/bin/naviseccli -h <ip-address> -User <user-name> -Password <password> -Scope 0 lun -list / getlun -all | ||
| emc.clariion.lun.servicetime | EMC CLARiiON LUN Service Time | ms | The total time spent to serve the request.,Command: /opt/Navisphere/bin/naviseccli -h <ip-address> -User <user-name> -Password <password> -Scope 0 lun -list / getlun -all | |
| emc.clariion.lun.percentidle | EMC CLARiiON LUN Percent Idle | % | The percent of time that the LUN is idle.,Command : /opt/Navisphere/bin/naviseccli -h <ip-address> -User <user-name> -Password <password> -Scope 0 lun -list / getlun -all | |
| emc.clariion.lun.percentbusy | EMC CLARiiON LUN Percent Busy | % | The percent of time that the LUN is busy.,Command : /opt/Navisphere/bin/naviseccli -h <ip-address> -User <user-name> -Password <password> -Scope 0 lun -list / getlun -all | |
| emc.clariion.lun.capacity | EMC CLARiiON LUN Capacity | GB | The capacity of the LUN in Gigabytes.,Command : /opt/Navisphere/bin/naviseccli -h <ip-address> -User <user-name> -Password <password> -Scope 0 lun -list / getlun -all |
G2 - EMC Clariion Storage Array Cache Template
Description
G2 - EMC Clariion Storage Array Cache Template. This Template is applicable for storage array.
Prerequisites
No prerequisite
Supported Metric
| Monitor Name | Metric Name | Metric Display Name | Unit | Description |
|---|---|---|---|---|
| G2 - EMC Clariion Storage Array Cache Monitor | emc.clariion.cache.percentdirtypages | EMC CLARiiON Cache Percent Dirty Pages | % | Percentage of dirty pages currently in cache.,Command : /opt/Navisphere/bin/naviseccli -h <ip-address> -User <user-name> -Password <password> -Scope 0 getcache |
G2 - EMC Clariion Storage Array Disk Template
Description
G2 - EMC Clariion Storage Array Disk Template. This Template is applicable for storage array.
Prerequisites
No prerequisite
Supported Metric
| Monitor Name | Metric Name | Metric Display Name | Unit | Description |
|---|---|---|---|---|
| G2 - EMC Clariion Storage Array Disk Monitor | emc.clariion.disk.percentbusy | EMC CLARiiON Disk Utilization | % | Indicates percent utilization of the Disk.,Command : /opt/Navisphere/bin/naviseccli -h <ip-address> -User <user-name> -Password <password> -Scope 0 getdisk,Formula : Percent busy = (Busy Ticks / (Busy Ticks + Idle Ticks)) * 100 |
| emc.clariion.disk.readthroughput | EMC CLARiiON Disk Read Throughput | psec | Indicates the number of read requests made per second to this disk.,Command : /opt/Navisphere/bin/naviseccli -h <ip-address> -User <user-name> -Password <password> -Scope 0 getdisk | |
| emc.clariion.disk.writethroughput | EMC CLARiiON Disk Write Throughput | psec | Indicates the number of write requests made per second to this disk.,Command : /opt/Navisphere/bin/naviseccli -h <ip-address> -User <user-name> -Password <password> -Scope 0 getdisk | |
| emc.clariion.disk.readbandwidth | EMC CLARiiON Disk Read Bandwidth | MBps | Mega Bytes of data read per second from the disks on the vnx array.,Command : /opt/Navisphere/bin/naviseccli -h <ip-address> -User <user-name> -Password <password> -Scope 0 getdisk | |
| emc.clariion.disk.writebandwidth | EMC CLARiiON Disk Write Bandwidth | MBps | Mega Bytes of data written per second on the disks on the vnx array.,Command : /opt/Navisphere/bin/naviseccli -h <ip-address> -User <user-name> -Password <password> -Scope 0 getdisk | |
| emc.clariion.disk.readerrors | EMC CLARiiON Disk Read Errors | Indicates the number of hard read errors in this disk.,Command : /opt/Navisphere/bin/naviseccli -h <ip-address> -User <user-name> -Password <password> -Scope 0 getdisk | ||
| emc.clariion.disk.writeerrors | EMC CLARiiON Disk Write Errors | Indicates the number of hard write errors in this disk.,Command: /opt/Navisphere/bin/naviseccli -h <ip-address> -User <user-name> -Password <password> -Scope 0 getdisk | ||
| emc.clariion.disk.state | EMC CLARiiON Disk State | Indicates the state of the disk,Command: /opt/Navisphere/bin/naviseccli -h <ip-address> -User <user-name> -Password <<password> -Scope 0 getdisk |
G2 - EMC Clariion Storage Array Fast Cache Template
Description
G2 - EMC Clariion Storage Array Fast Cache Template. This Template is applicable for storage array.
Prerequisites
No prerequisite
Supported Metric
| Monitor Name | Metric Name | Metric Display Name | Unit | Description |
|---|---|---|---|---|
| G2 - EMC Clariion Storage Array Fast Cache Monitor | emc.clariion.fastcache.state | EMC CLARiiON Fast Cache State | State of the Fast Cache.,Command: /opt/Navisphere/bin/naviseccli -h <ip-address> -User <user-name> -Password <password> -Scope 0 cache -fast -info -status -perfData | |
| emc.clariion.fastcache.percentdirtyspa | EMC CLARiiON Fast Cache Percentage Dirty SPA | % | The Fast Cache Percentage Dirty for Storage Processor A.,Command: /opt/Navisphere/bin/naviseccli -h <ip-address> -User <user-name> -Password <password> -Scope 0 cache -fast -info -status -perfData | |
| emc.clariion.fastcache.percentdirtyspb | EMC CLARiiON Fast Cache Percentage Dirty SPB | % | The Fast Cache Percentage Dirty for Storage Processor B,Command: /opt/Navisphere/bin/naviseccli -h <ip-address> -User <user-name> -Password <password> -Scope 0 cache -fast -info -status -perfData | |
| emc.clariion.fastcache.size | EMC CLARiiON Fast Cache Size | GB | The size of the fast cache.,Command: /opt/Navisphere/bin/naviseccli -h <ip-address> -User <user-name> -Password <password> -Scope 0 cache -fast -info -status -perfData |
G2 - EMC Clariion Storage Array HBA Template
Description
G2 - EMC Clariion Storage Array Host Bus Adapter Template. This Template is applicable for storage array.
Prerequisites
No prerequisite
Supported Metric
| Monitor Name | Metric Name | Metric Display Name | Unit | Description |
|---|---|---|---|---|
| G2 - EMC Clariion Storage Array HBA Monitor | emc.clariion.hba.state | EMC CLARiiON Host Bus Adapter State | Indicates State of the Host bus adapter.,Command : /opt/Navisphere/bin/naviseccli -h <ip-address> -User <user-name> -Password |
G2 - EMC Clariion Storage Array System Template
Description
G2 - EMC Clariion Storage Array System Template. This Template is applicable for storage array.
Prerequisites
No prerequisite
Supported Metric
| Monitor Name | Metric Name | Metric Display Name | Unit | Description |
|---|---|---|---|---|
| G2 - EMC Clariion Storage Array System Monitor | emc.clariion.system.totalrawspace | EMC CLARiiON System Total Raw Space | GB | The total raw storage capacity of the system.,Command : /opt/Navisphere/bin/naviseccli -h <ip-address> -User <user-name> -Password <password> -Scope 0 getdisk.,this metric is calculated from number of Enabled,Unbound,Hot spare ready disks total space |
| emc.clariion.system.configuredstoragecapacity | EMC CLARiiON System Configured Storage Capacity | GB | The total configured disk capacity of the system.,Command : /opt/Navisphere/bin/naviseccli -h <ip-address> -User <user-name> -Password <password> -Scope 0 getdisk. This metric is calculated from number of Enabled disks total space | |
| emc.clariion.system.luncount | EMC CLARiiON System Lun Count | The total number of LUNs. Command : /opt/Navisphere/bin/naviseccli -h <ip-address> -User <user-name> -Password <password> -Scope 0 getlun -name | ||
| emc.clariion.system.diskcount | EMC CLARiiON System Disk Count | The total number of disks.,Command : /opt/Navisphere/bin/naviseccli -h <ip-address> -User <user-name> -Password <password> -Scope 0 getdisk | ||
| emc.clariion.system.configureddiskcount | EMC CLARiiON System Configured Disk Count | The number of configured disks.,Command : /opt/Navisphere/bin/naviseccli -h <ip-address> -User <user-name> -Password <password> -Scope 0 getdisk. This metric is calculated from number of Enabled disks | ||
| emc.clariion.system.unconfigureddiskcount | EMC CLARiiON System UnConfigured Disk Count | The number of unconfigured disks.,Command : /opt/Navisphere/bin/naviseccli -h <ip-address> -User <user-name> -Password <password> -Scope 0 getdisk. This metric is calculated from number of unbound disks | ||
| emc.clariion.system.hotsparediskcount | EMC CLARiiON System Hot Spared Disk Count | The total number of hot spare disks which are ready.,Command : /opt/Navisphere/bin/naviseccli -h <ip-address> -User <user-name> -Password <password> -Scope 0 getdisk. This metric is calculated from number of hot spared disks. |
G2 - EMC Clariion Storage Pool Template
Description
G2 - EMC Clariion Storage Pool Template. This Template is applicable for block and raid pool.
Prerequisites
No prerequisite
Supported Metric
| Monitor Name | Metric Name | Metric Display Name | Unit | Description |
|---|---|---|---|---|
| G2 - EMC Clariion Storage Pool Monitor | emc.clariion.storagepool.availablesize | EMC CLARiiON Storage Pool Available Size | GB | Storage Pool available capacity.,CLARiiON have two type of storage pools. Block pool and Raid pool. If it is block pool then command is /opt/Navisphere/bin/naviseccli -h <ip-address> -User <user-name> -Password <password> -Scope 0 storagepool -list.,If it is raid pool command is /opt/Navisphere/bin/naviseccli -h <ip-address> -User <user-name> -Password <password> -Scope 0 getrg |
| emc.clariion.storagepool.utilization | EMC CLARiiON Storage Pool Utilization | % | Pool Utilization.,CLARiiON have two type of storage pools. Block pool and Raid pool. If it is block pool then command is /opt/Navisphere/bin/naviseccli -h <ip-address> -User <user-name> -Password <password> -Scope 0 storagepool -list.,If it is raid pool command is /opt/Navisphere/bin/naviseccli -h <ip-address> -User <user-name> -Password <password> -Scope 0 getrg | |
| emc.clariion.storagepool.status | EMC CLARiiON Storage Pool Status | Displays the information for the current state of the pool. CLARiiON have two type of storage pools. Block pool and Raid pool. If it is block pool then command is /opt/Navisphere/bin/naviseccli -h <ip-address> -User <user-name> -Password <password> -Scope 0 storagepool -list.,If it is raid pool command is /opt/Navisphere/bin/naviseccli -h <ip-address> -User <user-name> -Password <password> -Scope 0 getrg | ||
| emc.clariion.storagepool.rawcapacity | EMC CLARiiON Storage Pool Raw Capacity | GB | The raw capacity of the Pool. CLARiiON have two type of storage pools. Block pool and Raid pool. If it is block pool then command is /opt/Navisphere/bin/naviseccli -h <ip-address> -User <user-name> -Password <password> -Scope 0 storagepool -list.,If it is raid pool command is /opt/Navisphere/bin/naviseccli -h <ip-address> -User <user-name> -Password <password> -Scope 0 getrg | |
| emc.clariion.storagepool.percentfree | EMC CLARiiON Storage Pool Percent Free | % | The percent of the Pool that is free.,CLARiiON have two type of storage pools. Block pool and Raid pool. If it is block pool then command is /opt/Navisphere/bin/naviseccli -h <ip-address> -User <user-name> -Password <password> -Scope 0 storagepool -list.,If it is raid pool command is /opt/Navisphere/bin/naviseccli -h <ip-address> -User <user-name> -Password <password> -Scope 0 getrg | |
| emc.clariion.storagepool.numberofluns | EMC CLARiiON Storage Pool Number of LUNs | The number of LUNs using the pool.,CLARiiON have two type of storage pools. Block pool and Raid pool. If it is block pool then command is /opt/Navisphere/bin/naviseccli -h <ip-address> -User <user-name> -Password <password> -Scope 0 storagepool -list.,If it is raid pool command is /opt/Navisphere/bin/naviseccli -h lt;ip-address> -User <user-name> -Password <password> -Scope 0 getrg | ||
| emc.clariion.storagepool.logicalcapacity | EMC CLARiiON Storage Pool Logical Capacity | GB | The logical capacity of the pool.,CLARiiON have two type of storage pools. Block pool and Raid pool. If it is block pool then command is /opt/Navisphere/bin/naviseccli -h <ip-address> -User <user-name> -Password <password> -Scope 0 storagepool -list.,If it is raid pool command is /opt/Navisphere/bin/naviseccli -h <ip-address> -User <user-name> -Password <password> -Scope 0 getrg |
G2 - EMC Clariion Storage Processor Template
Description
G2 - EMC Clariion Storage Processor Template. This Template is applicable for block and raid processor.
Prerequisites
No prerequisite
Supported Metric
| Monitor Name | Metric Name | Metric Display Name | Unit | Description |
|---|---|---|---|---|
| G2 - EMC Clariion Storage Processor Monitor | emc.clariion.storageprocessor.prctbusy | EMC CLARiiON Storage Processor Percent Busy | % | Indicates percent utilization of the storage processor.,Command : /opt/Navisphere/bin/naviseccli -h <ip-address> -User <user-name> -Password <password> -Scope 0 getall -sp |
| emc.clariion.storageprocessor.prctidle | EMC CLARiiON Storage Processor Percent Idle | % | Indicates the percentage of time for the storage processor was idle.,Command : /opt/Navisphere/bin/naviseccli -h <ip-address> -User <user-name> -Password <password> -Scope 0 getall -sp | |
| emc.clariion.storageprocessor.totalthroughput | EMC CLARiiON Storage Processor Total Throughput | psec | Average number of requests that is passed through the storage processor per second.,Command : /opt/Navisphere/bin/naviseccli -h <ip-address> -User <user-name> -Password <password> -Scope 0 getall -sp | |
| emc.clariion.storageprocessor.readthroughput | EMC CLARiiON Storage Processor Read Throughput | psec | Average number of read requests that is passed through the storage processor per second.,Command : /opt/Navisphere/bin/naviseccli -h <ip-address> -User <user-name> -Password <password> -Scope 0 getall -sp | |
| emc.clariion.storageprocessor.writethroughput | EMC Clariion Storage Processor Write Throughput | psec | Average number of write requests that is passed through the storage processor per second.,Command : /opt/Navisphere/bin/naviseccli -h <ip-address> -User <user-name> -Password <password> -Scope 0 getall -sp | |
| emc.clariion.storageprocessor.status | EMC CLARiiON Storage Processor Status | Status of the Storage Processor,Command : /opt/Navisphere/bin/naviseccli -h <ip-address> -User <user-name> -Password <password> -Scope 0 getcrus -spa/-spb | ||
| emc.clariion.storageprocessor.readcachestate | EMC CLARiiON Storage Processor Read Cache State | Storage Processor Read Cache state.,Command : /opt/Navisphere/bin/naviseccli -h <ip-address> -User <user-name> -Password <password> -Scope 0 getall -sp | ||
| emc.clariion.storageprocessor.writecachestate | EMC CLARiiON Storage Processor Write Cache State | Storage Processor Write Cache state.,Command : /opt/Navisphere/bin/naviseccli -h <ip-address> -User <user-name> -Password <password> -Scope 0 getall -sp | ||
| emc.clariion.storageprocessor.cablestatus | EMC CLARiiON Storage Processor Cable Status | Storage Processor Cabling status.,Command : /opt/Navisphere/bin/naviseccli -h <ip-address> -User <user-name> -Password <password> -Scope 0 getcrus -cablingspsa/-cablingspsb | ||
| emc.clariion.storageprocessor.cpustatus | EMC CLARiiON Storage Processor CPU Status | Storage Processor CPU status.,Command : /opt/Navisphere/bin/naviseccli -h <ip-address> -User <user-name> -Password <password> -Scope 0 getcrus -cpua/-cpub | ||
| emc.clariion.storageprocessor.fanstatus | EMC CLARiiON Storage Processor Fan Status | Storage Processor Fan status.,Command : /opt/Navisphere/bin/naviseccli -h <ip-address> -User <user-name> -Password <password> -Scope 0 getcrus -fana/-fanb | ||
| emc.clariion.storageprocessor.lccstatus | EMC CLARiiON Storage Processor LCC Status | Storage Processor link control card status.,Command : /opt/Navisphere/bin/naviseccli -h <ip-address> -User <user-name> -Password <password> -Scope 0 getcrus -lcca/-lccb | ||
| emc.clariion.storageprocessor.spsstatus | EMC CLARiiON Storage Processor SPS Status | Storage Processor standby power supply status.,Command : /opt/Navisphere/bin/naviseccli -h <ip-address> -User <user-name> -Password <password> -Scope 0 getcrus -spsa/-spsb | ||
| emc.clariion.storageprocessor.powerstatus | EMC CLARiiON Storage Processor Power Status | Storage Processor power status.,Command : /opt/Navisphere/bin/naviseccli -h <ip-address> -User <user-name> -Password <password> -Scope 0 getcrus -all | ||
| emc.clariion.storageprocessor.fault-led-status | EMC CLARiiON Storage Processor Fault LED Status | Status of fault LED.,Command : /opt/Navisphere/bin/naviseccli -h <ip-address> -User <user-name> -Password <password> -Scope 0 getall -sp | ||
| emc.clariion.storageprocessor.statistics-logging-status | EMC CLARiiON Storage Processor Statistics Logging Status | Status of Statistics Logging. This Serve for performance monitoring.,Command : /opt/Navisphere/bin/naviseccli -h <ip-address> -User <user-name> -Password <password> -Scope 0 getall -sp | ||
| emc.clariion.storageprocessor.responsetime | EMC CLARiiON Storage Processor Response Time | ms | Amount of time it takes for a storage processor to process an input-output request.,Command : /opt/Navisphere/bin/naviseccli -h <ip-address> -User <user-name> -Password <password> -Scope 0 getall -sp,Formula : Response time : 1000 * (Queue length/throughput) | |
| emc.clariion.storageprocessor.totalwrites | EMC CLARiiON Storage Processor Total Writes | Number of write operations performed by the storage processor.,Command : /opt/Navisphere/bin/naviseccli -h <ip-address> -User <user-name> -Password <password> -Scope 0 getall -sp | ||
| emc.clariion.storageprocessor.totalreads | EMC CLARiiON Storage Processor Total Reads | Number of read operations to the storage processor.,Command : /opt/Navisphere/bin/naviseccli -h <ip-address> -User <user-name> -Password <password> -Scope 0 getall -sp | ||
| emc.clariion.storageprocessor.servicetime | EMC CLARiiON Storage Processor Service Time | ms | The total time spent to serve the request. Command : /opt/Navisphere/bin/naviseccli -h <ip-address> -User <user-name> -Password <password> -Scope 0 getall -sp,Formula : Service time = 1000 * (Utilization/throughput) | |
| emc.clariion.storageprocessor.blocksread | EMC CLARiiON Storage Processor Blocks Read Per Second | Number of blocks transferred for read operations.,Command : /opt/Navisphere/bin/naviseccli -h <ip-address> -User <user-name> -Password <password> -Scope 0 getall -sp | ||
| emc.clariion.storageprocessor.blockswritten | EMC CLARiiON Storage Processor Blocks Written Per Second | Number of blocks transferred for write operations.,Command : /opt/Navisphere/bin/naviseccli -h <ip-address> -User <user-name> -Password <password> -Scope 0 getall -sp | ||
| emc.clariion.storageprocessor.averagebusy-queuelength | EMC CLARiiON Storage Processor Average Busy Queuelength | The average number of outstanding requests.,Command : /opt/Navisphere/bin/naviseccli -h <ip-address> -User <user-name> -Password <password> -Scope 0 getall -sp,Formula : Average Busy Queue Length : (Sum Queue Lengths - (Number arrivals With Non Zero Queue / 2)) / (Read Throughput [IO/s] + Write Throughput [IO/s]) |
G2 EMC VMAX Adapter Template
Description
This template is applicable to the storage array processor (adapter).
Prerequisites
The device should be added using integrations. The corresponding resource should exist. The gateway should be up and running. Storage Array should be reachable from Gateway. Storage Array (Device) and its resources should be in a managed state.
Supported Metric
| Monitor Name | Metric Name | Metric Display Name | Unit | Description |
|---|---|---|---|---|
| G2 EMC VMAX Adapter Monitor | vmax.array.adapter.kbytestransferred | Adapter KBytes Transferred | KBps | Adapter KBytes Transferred |
| vmax.array.adapter.readios | Adapter ReadIOs | s | Adapter ReadIOs | |
| vmax.array.adapter.totalios | Adapter TotalIOs | s | Adapter TotalIOs | |
| vmax.array.adapter.writeios | Adapter WriteIOs | s | Adapter WriteIOs |
G2 EMC VMAX Array Template
Description
G2 EMC VMAX Array Template
Prerequisites
No prerequisite
Supported Metric
| Monitor Name | Metric Name | Metric Display Name | Unit | Description |
|---|---|---|---|---|
| G2 EMC VMAX Array Monitor | vmax.array.kbytesread | Array KBytes Read | KBps | Array KBytes Read |
| vmax.array.kbytestransferred | Array KBytes Transferred | KBps | Array KBytes Transferred | |
| vmax.array.kbyteswritten | Array KBytes Written | KBps | Array KBytes Written | |
| vmax.array.readhitios | Array ReadHitIOs | s | Array ReadHitIOs | |
| vmax.array.readios | Array ReadIOs | s | Array ReadIOs | |
| vmax.array.totalios | Array TotalIOs | s | Array TotalIOs | |
| vmax.array.writehitios | Array WriteHitIOs | s | Array WriteHitIOs | |
| vmax.array.writeios | Array WriteIOs | s | Array WriteIOs |
G2 EMC VMAX BE FC Port Template
Description
This template is applicable to the storage array (device).
Prerequisites
The device should be added using integrations. The corresponding resource should exist. The gateway should be up and running. Storage Array should be reachable from Gateway. Storage Array (Device) and its resources should be in a managed state.
Supported Metric
| Monitor Name | Metric Name | Metric Display Name | Unit | Description |
|---|---|---|---|---|
| G2 EMC VMAX BE FC Port Monitor | vmax.array.backendfcport.kbytestransferred | Back End FCPort KBytes Transferred | KBps | Back End FCPort KBytes Transferred |
| vmax.array.backendfcport.totalios | Back End FCPort TotalIOs | s | Back End FCPort TotalIOs |
G2 EMC VMAX Disk Template
Description
G2 EMC VMAX Disk Template
Prerequisites
No prerequisite
Supported Metric
| Monitor Name | Metric Name | Metric Display Name | Unit | Description |
|---|---|---|---|---|
| G2 EMC VMAX Disk Monitor | vmax.array.disk.kbytesread | Disk KBytes Read | KBps | Disk KBytes Read |
| vmax.array.disk.kbytestransferred | Disk KBytes Transferred | KBps | Disk KBytes Transferred | |
| vmax.array.disk.kbyteswritten | Disk KBytes Written | KBps | Disk KBytes Written | |
| vmax.array.disk.status | Disk Status | NULL | Disk Status | |
| vmax.array.disk.utilization | Disk Utilization | % | Disk Utilization | |
| vmax.array.disk.readios | Disk ReadIOs | s | Disk ReadIOs | |
| vmax.array.disk.totalios | Disk TotalIOs | s | Disk TotalIOs | |
| vmax.array.disk.writeios | Disk WriteIOs | s | Disk WriteIOs |
G2 EMC VMAX FE FC Port Template
Description
This template is applicable to the storage array (device).
Prerequisites
The device should be added using integrations. The corresponding resource should exist. The gateway should be up and running. Storage Array should be reachable from Gateway. Storage Array (Device) and its resources should be in a managed state.
Supported Metric
| Monitor Name | Metric Name | Metric Display Name | Unit | Description |
|---|---|---|---|---|
| G2 EMC VMAX FE FC Port Monitor | vmax.array.frontendfcport.kbytestransferred | Front End FCPort KBytes Transferred | KBps | Front End FCPort KBytes Transferred |
| vmax.array.frontendfcport.totalios | Front End FCPort TotalIOs | s | Front End FCPort TotalIOs |
G2 EMC VMAX Storage Pool Template
Description
G2 EMC VMAX Storage Pool Template
Prerequisites
No prerequisite
Supported Metric
| Monitor Name | Metric Name | Metric Display Name | Unit | Description |
|---|---|---|---|---|
| G2 EMC VMAX Storage Pool Monitor | vmax.array.storagepool.status | Storage Pool Status | NULL | Status of the Storage Pool |
| vmax.array.storagepool.utilization | Storage Pool Utilization | % | Utilization for Storage Pool |
G2 EMC VMAX Volume Template
Description
G2 EMC VMAX Volume Monitor
Prerequisites
No prerequisite
Supported Metric
| Monitor Name | Metric Name | Metric Display Name | Unit | Description |
|---|---|---|---|---|
| G2 EMC VMAX Volume Monitor | vmax.array.volume.kbytesread | Volume Kbytes Read | KBps | The cumulative number of kilobytes read. |
| vmax.array.volume.kbytestransferred | Volume Kbytes Transferred | KBps | The cumulative number of kilobytes transferred for read or write. | |
| vmax.array.volume.kbyteswritten | Volume Kbytes Written | KBps | The cumulative number of kilobytes write. | |
| vmax.array.volume.readhitios | Volume ReadHitIOs | s | The cumulative count of all read cache hits (reads from cache),which represents the number of track reads received from components above that have been treated by cache as a total hit on prestage or non-prestage data. | |
| vmax.array.volume.writehitios | Volume WriteHitIOs | s | The cumulative count of write cache hits (writes that went directly to cache without blocking),which represents the number of track writes received from components above,and processed in fast write mode | |
| vmax.array.volume.operationalstatus | Volume Operational Status | NULL | Operational Status of the Volume | |
| vmax.array.volume.healthstate | Volume Health State | NULL | Health State of the Volume | |
| vmax.array.volume.utilization | Volume Utilization Percentage | % | Percentage Utilization of the Volume | |
| vmax.array.volume.readios | Volume ReadIOs | s | The cumulative number of Read I/O operations for the Volume. | |
| vmax.array.volume.writeios | Volume WriteIOs | s | The cumulative number of Write I/O operations for the Volume. | |
| vmax.array.volume.totalios | Volume TotalIOs | s | The cumulative number of I/O operations for the Volume (read and write). |
G2 - EMC VNX LUN Template
Description
G2 - EMC VNX LUN Template. This template is applicable for storage array lun.
Prerequisites
No prerequisite
Supported Metric
| Monitor Name | Metric Name | Metric Display Name | Unit | Description |
|---|---|---|---|---|
| G2 - EMC VNX LUN Monitor | emc.vnx.lun.totalthroughput | EMC VNX LUN Total Throughput | psec | Average number of requests that is passed through the LUN per second.,Command : /opt/Navisphere/bin/naviseccli -h <ip-address> -User <user-name> -Password <password> -Scope 0 lun -list / getlun -all |
| emc.vnx.lun.readthroughput | EMC VNX LUN Read Throughput | psec | Average number of read requests that is passed through the LUN per second.,Command : /opt/Navisphere/bin/naviseccli -h <ip-address> -User <user-name> -Password <password> -Scope 0 lun -list / getlun -all | |
| emc.vnx.lun.writethroughput | EMC VNX LUN Write Throughput | psec | Average number of write requests that is passed through the LUN per second.,Command : /opt/Navisphere/bin/naviseccli -h <ip-address> -User <user-name> -Password <password> -Scope 0 lun -list / getlun -all | |
| emc.vnx.lun.status | EMC VNX LUN Status | Displays the status of the lun.,Command : /opt/Navisphere/bin/naviseccli -h <ip-address> -User <user-name> -Password <password> -Scope 0 lun -list / getlun -all | ||
| emc.vnx.lun.writebandwidth | EMC VNX LUN Write Bandwidth | MBps | The total write bandwidth for the LUN..,Command : /opt/Navisphere/bin/naviseccli -h <ip-address> -User <user-name> -Password <password> -Scope 0 lun -list / getlun -all | |
| emc.vnx.lun.readbandwidth | EMC VNX LUN Read Bandwidth | MBps | The total read bandwidth for the LUN.,Command : /opt/Navisphere/bin/naviseccli -h <ip-address> -User <user-name> -Password <password> -Scope 0 lun -list / getlun -all | |
| emc.vnx.lun.totalbandwidth | EMC VNX LUN Total Bandwidth | MBps | The total bandwidth for the LUN.,Command : /opt/Navisphere/bin/naviseccli -h <ip-address> -User <user-name> -Password <password> -Scope 0 lun -list / getlun -all | |
| emc.vnx.lun.trespasses-spa | EMC VNX LUN SPA Tres Passes | The number of trespasses by SP A for the LUN.,Command : /opt/Navisphere/bin/naviseccli -h <ip-address> -User <user-name> -Password <password> -Scope 0 lun -list / getlun -all | ||
| emc.vnx.lun.trespasses-spb | EMC VNX LUN SPB Tres Passes | The number of trespasses by SP B for the LUN.,Command : /opt/Navisphere/bin/naviseccli -h <ip-address> -User <user-name> -Password <password> -Scope 0 lun -list / getlun -all | ||
| emc.vnx.lun.trespasses | EMC VNX LUN Tres Passes | The total number of trespasses for the LUN.,Command : /opt/Navisphere/bin/naviseccli -h <ip-address> -User <user-name> -Password <password> -Scope 0 lun -list / getlun -all | ||
| emc.vnx.lun.trespasses-pasthour | EMC VNX LUN Tres Passes Past Hour | The number of trespasses for the LUN in the past hour.,Command : /opt/Navisphere/bin/naviseccli -h <ip-address> -User <user-name> -Password <password> -Scope 0 lun -list / getlun -all | ||
| emc.vnx.lun.trespasses-state | EMC VNX LUN Tres Passes State | State of the LUN Trespass.,Command : /opt/Navisphere/bin/naviseccli -h <ip-address> -User <user-name> -Password <password> -Scope 0 lun -list / getlun -all | ||
| emc.vnx.lun.totalsofterrors | EMC VNX LUN Total Soft Errors | The Soft errors on the LUN.,Command : /opt/Navisphere/bin/naviseccli -h <ip-address> -User <user-name> -Password <password> -Scope 0 lun -list / getlun -all | ||
| emc.vnx.lun.totalharderrors | EMC VNX LUN Total Hard Errors | The Hard errors on the LUN.,Command : /opt/Navisphere/bin/naviseccli -h <ip-address> -User <user-name> -Password <password> -Scope 0 lun -list / getlun -all | ||
| emc.vnx.lun.servicetime | EMC VNX LUN Service Time | ms | The total time spent to serve the request. | |
| emc.vnx.lun.percentidle | EMC VNX LUN Percent Idle | % | The percent of time that the LUN is idle. Command : /opt/Navisphere/bin/naviseccli -h <ip-address> -User <user-name> -Password <password> -Scope 0 lun -list / getlun -all | |
| emc.vnx.lun.percentbusy | EMC VNX LUN Percent Busy | % | The percent of time that the LUN is busy.,Command : /opt/Navisphere/bin/naviseccli -h <ip-address> -User <user-name> -Password <password> -Scope 0 lun -list / getlun -all | |
| emc.vnx.lun.capacity | EMC VNX LUN Capacity | GB | The capacity of the LUN in Gigabytes., |
G2 - EMC VNX NAS Storage Array Data Mover
Description
G2 - EMC VNX NAS Storage Array Data Mover. This template is applicable for storage array
Prerequisites
No prerequisite
Supported Metric
| Monitor Name | Metric Name | Metric Display Name | Unit | Description |
|---|---|---|---|---|
| G2 - EMC VNX NAS Storage Array Data Mover Monitor | emc.vnx.mover.cpuutilization | EMC VNX Data Mover CPU Utilization | % | Data Mover CPU Utilization,OpsRamp used XML API to get this metric |
| emc.vnx.mover.memoryutilization | EMC VNX Data Mover Memoty Utilization | % | Data Mover Memory Utilization OpsRamp used XML API to get this metric | |
| emc.vnx.mover.status | EMC VNX Data Mover Status | Status of the Data mover,OpsRamp used XML API to get this metric |
G2 - EMC VNX NAS Storage Array Events
Description
G2 - EMC VNX NAS Storage Array Events. This template is applicable for storage array.
Prerequisites
No prerequisite
Supported Metric
| Monitor Name | Metric Name | Metric Display Name | Unit | Description |
|---|---|---|---|---|
| G2 - EMC VNX NAS Storage Array Events Monitor | emc.vnx.event.0x13608900ca | A Celerra Database error was detected | NULL | An inconsistency in the Celerra database files was detected. Run the $NAS_DB/tools/dbchk tool to identify the exact error |
| emc.vnx.event.0x1460870065 | The Jserver failed to start after three tries. | NULL | The Jserver failed to start after three tries. | |
| emc.vnx.event.0x1660890131 | nasdb backup NAS DB checkpoint done. | NULL | nasdb backup NAS DB checkpoint done. | |
| emc.vnx.event.0x1660890132 | nasdb backup Celerra database backup done. | NULL | nasdb backup Celerra database backup done. |
G2 - EMC VNX NAS Storage Array File System
Description
G2 - EMC VNX NAS Storage Array File System. This template is applicable for storage array.
Prerequisites
No prerequisite
Supported Metric
| Monitor Name | Metric Name | Metric Display Name | Unit | Description |
|---|---|---|---|---|
| G2 - EMC VNX NAS Storage Array File System Monitor | emc.vnx.filesystem.availablesize | EMC VNX File System Available Size | GB | File system available size,OpsRamp used XML API to get this metric. |
| emc.vnx.filesystem.utilization | EMC VNX File System Utilization | % | File system utilization,OpsRamp used XML API to get this metric | |
| emc.vnx.filesystem.availablefiles | EMC VNX File System Available Files | File system available files,OpsRamp used XML API to get this metric |
G2 - EMC VNX NAS Storage Array System
Description
G2 - EMC VNX NAS Storage Array System. This template is applicable for storage array.
Prerequisites
No prerequisite
Supported Metric
| Monitor Name | Metric Name | Metric Display Name | Unit | Description |
|---|---|---|---|---|
| G2 - EMC VNX NAS Storage Array System Monitor | emc.vnx.systempower.status | EMC VNX System Power Status | Power status of the System,OpsRamp used XML API to get this metric | |
| emc.vnx.storagesystem.status | EMC VNX Storage System Status | Status of the Storage System,OpsRamp used XML API to get this metric | ||
| emc.vnx.storagesystempower.status | EMC VNX Storage System Power Status | Power status of the Storage System,OpsRamp used XML API to get this metric |
G2 - EMC VNX NAS Storage Array Virtual Data Mover
Description
G2 - EMC VNX NAS Storage Array Virtual Data Mover
Prerequisites
No prerequisite
Supported Metric
| Monitor Name | Metric Name | Metric Display Name | Unit | Description |
|---|---|---|---|---|
| G2 - EMC VNX NAS Storage Array Virtual Data Mover Monitor | emc.vnx.vdm.status | EMC VNX Virtual Data Mover Status | Status of the Virtual Data mover. OpsRamp used XML API to get this metric. | |
| emc.vnx.vdm.state | EMC VNX Virtual Data Mover State | State of the Virtual Data mover OpsRamp used XML API to get this metric |
G2 - EMC VNX NAS Storage Pool
Description
G2 - EMC VNX NAS Storage Pool. This template is applicable for File Storage Pool.
Prerequisites
No prerequisite
Supported Metric
| Monitor Name | Metric Name | Metric Display Name | Unit | Description |
|---|---|---|---|---|
| G2 - EMC VNX NAS Storage Pool Monitor | emc.vnx.storagepool.availablesize | EMC VNX Storage Pool Available Size | GB | Storage Pool available capacity.,VNX have 3 type of storage pools. File pool,Block pool and Raid pool. If it is file pool OpsRamp used XML api to calculate this metric. If it is block pool then command is /opt/Navisphere/bin/naviseccli -h <ip-address> -User <user-name> -Password <password> -Scope 0 storagepool -list.,If it is raid pool command is /opt/Navisphere/bin/naviseccli -h <ip-address> -User <user-name> -Password <password> -Scope 0 getrg |
| emc.vnx.storagepool.utilization | EMC VNX Storage Pool Utilization | % | Pool utilization.,VNX have 3 type of storage pools. File pool,Block pool and Raid pool. If it is file pool OpsRamp used XML api to calculate this metric. If it is block pool then command is /opt/Navisphere/bin/naviseccli -h <ip-address> -User <user-name> -Password <password> -Scope 0 storagepool -list.,If it is raid pool command is /opt/Navisphere/bin/naviseccli -h <ip-address> -User <user-name> -Password <password> -Scope 0 getrg | |
| emc.vnx.storagepool.status | EMC VNX Storage Pool Status | Displays the information for the current state of the pool.,VNX have 3 type of storage pools. File pool,Block pool and Raid pool. If it is file pool OpsRamp used XML api to calculate this metric. If it is block pool then command is /opt/Navisphere/bin/naviseccli -h <ip-address> -User <user-name> -Password <password> -Scope 0 storagepool -list.,If it is raid pool command is /opt/Navisphere/bin/naviseccli -h <ip-address> -User <user-name> -Password <password> -Scope 0 getrg | ||
| emc.vnx.storagepool.percentfree | EMC VNX Storage Pool Percentage Free | % | The percent of the Pool that is free.,VNX have 3 type of storage pools. File pool,Block pool and Raid pool. If it is file pool OpsRamp used XML api to calculate this metric. If it is block pool then command is /opt/Navisphere/bin/naviseccli -h <ip-address> -User <user-name> -Password <password> -Scope 0 storagepool -list.,If it is raid pool command is /opt/Navisphere/bin/naviseccli -h <ip-address> -User <user-name> -Password <password> -Scope 0 getrg |
G2 - EMC VNX Primary Control Station
Description
G2 - EMC VNX Primary Control Station. This template is applicable for primary control station.
Prerequisites
No prerequisite
Supported Metric
| Monitor Name | Metric Name | Metric Display Name | Unit | Description |
|---|---|---|---|---|
| G2 - EMC VNX Primary Control Station Monitor | emc.vnx.primarycs.status | EMC VNX Primary Control Station Status | Status of the Primary Control station.,OpsRamp used XML API to get this metric. |
G2 - EMC VNX SAN Storage Array Disk
Description
G2 - EMC VNX SAN Storage Array Disk. This template is applicable for storage array.
Prerequisites
No prerequisite
Supported Metric
| Monitor Name | Metric Name | Metric Display Name | Unit | Description |
|---|---|---|---|---|
| G2 - EMC VNX SAN Storage Array Disk Monitor | emc.vnx.disk.percentbusy | EMC VNX Disk Utilization | % | Indicates percent utilization of the Disk,Command : /opt/Navisphere/bin/naviseccli -h <ip-address> -User <user-name> -Password <password> -Scope 0 getdisk,Formula : Percent busy = (Busy Ticks / (Busy Ticks + Idle Ticks)) * 100 |
| emc.vnx.disk.readthroughput | EMC VNX Disk Read Throughput | psec | Indicates the number of read requests made per second to this disk.,Command : /opt/Navisphere/bin/naviseccli -h <ip-address> -User <user-name> -Password <password> -Scope 0 getdisk | |
| emc.vnx.disk.writethroughput | EMC VNX Disk Write Throughput | psec | Indicates the number of write requests made per second to this disk.,Command : /opt/Navisphere/bin/naviseccli -h <ip-address> -User <user-name> -Password <password> -Scope 0 getdisk | |
| emc.vnx.disk.readbandwidth | EMC VNX Disk Read Bandwidth | MBps | Mega Bytes of data read per second from the disks on the vnx array.,Command : /opt/Navisphere/bin/naviseccli -h <ip-address> -User <user-name> -Password <password> -Scope 0 getdisk | |
| emc.vnx.disk.writebandwidth | EMC VNX Disk Write Bandwidth | MBps | Mega Bytes of data written per second on the disks on the vnx array.,Command : /opt/Navisphere/bin/naviseccli -h <ip-address> -User <user-name> -Password <password> -Scope 0 getdisk | |
| emc.vnx.disk.readerrors | EMC VNX Disk Read Errors | Indicates the number of hard read errors in this disk.,Command : /opt/Navisphere/bin/naviseccli -h <ip-address> -User <user-name> -Password <password> -Scope 0 getdisk | ||
| emc.vnx.disk.writeerrors | EMC VNX Disk Write Errors | Indicates the number of hard write errors in this disk.,Command : /opt/Navisphere/bin/naviseccli -h <ip-address> -User <user-name> -Password <password> -Scope 0 getdisk | ||
| emc.vnx.disk.state | EMC VNX Disk State | Indicates the state of the disk,Command : /opt/Navisphere/bin/naviseccli -h <ip-address> -User <user-name> -Password <password> -Scope 0 getdisk | ||
| emc.vnx.system.hotsparediskcount | EMC VNX System Hot Spared Disk Count | The total number of hot spare disks which are ready.,Command : /opt/Navisphere/bin/naviseccli -h <ip-address> -User <user-name> -Password <password> -Scope 0 getdisk This metric is calculated from number of hot spared disks |
G2 - EMC VNX SAN Storage Array Fast Cache
Description
G2 - EMC VNX SAN Storage Array Fast Cache. This template is applicable for storage array
Prerequisites
No prerequisite
Supported Metric
| Monitor Name | Metric Name | Metric Display Name | Unit | Description |
|---|---|---|---|---|
| G2 - EMC VNX SAN Storage Array Fast Cache Monitor | emc.vnx.fastcache.state | EMC VNX Fast Cache State | State of the Fast Cache Command : /opt/Navisphere/bin/naviseccli -h <ip-address> -User <user-name> -Password <password> -Scope 0 cache -fast -info -status -perfData | |
| emc.vnx.fastcache.percentdirtyspa | EMC VNX Fast Cache Percentage Dirty SPA | % | The Fast Cache Percentage Dirty for Storage Processor A,Command : /opt/Navisphere/bin/naviseccli -h <ip-address> -User <user-name> -Password <password> -Scope 0 cache -fast -info -status -perfData | |
| emc.vnx.fastcache.percentdirtyspb | EMC VNX Fast Cache Percentage Dirty SPB | % | The Fast Cache Percentage Dirty for Storage Processor B.,Command : /opt/Navisphere/bin/naviseccli -h <ip-address> -User <user-name> -Password <password> -Scope 0 cache -fast -info -status -perfData | |
| emc.vnx.fastcache.size | EMC VNX Fast Cache Size | GB | The size of the fast cache.,Command : /opt/Navisphere/bin/naviseccli -h <ip-address> -User <user-name> -Password <password> -Scope 0 cache -fast -info -status -perfData |
G2 - EMC VNX SAN Storage Array Faults
Description
G2 - EMC VNX SAN Storage Array Faults
Prerequisites
No prerequisite
Supported Metric
| Monitor Name | Metric Name | Metric Display Name | Unit | Description |
|---|---|---|---|---|
| G2 - EMC VNX SAN Storage Array Faults Monitor | emc.vnx.system.faultscount | EMC VNX System Faults Count | The number of faults in the system.,Command : /opt/Navisphere/bin/naviseccli -h <ip-address> -User <user-name> -Password <password> -Scope 0 faults -list | |
| emc.vnx.system.faults | EMC VNX System Faults | NULL | EMC VNX System Faults |
G2 - EMC VNX SAN Storage Array HBA
Description
G2 - EMC VNX SAN Storage Array HBA. This template is applicable for storage array.
Prerequisites
No prerequisite
Supported Metric
| Monitor Name | Metric Name | Metric Display Name | Unit | Description |
|---|---|---|---|---|
| G2 - EMC VNX SAN Storage Array HBA Monitor | emc.vnx.hba.state | EMC VNX Host Bus Adapter State | Indicates State of the Host bus adapter.,Command : /opt/Navisphere/bin/naviseccli -h <ip-address> -User <user-name> -Password <password> -Scope 0 port -list |
G2 - EMC VNX SAN Storage Array System
Description
G2 - EMC VNX SAN Storage Array System. This template is applicable for storage array.
Prerequisites
No prerequisite
Supported Metric
| Monitor Name | Metric Name | Metric Display Name | Unit | Description |
|---|---|---|---|---|
| G2 - EMC VNX SAN Storage Array System Monitor | emc.vnx.system.totalrawspace | EMC VNX System Total Raw Space | GB | The total raw storage capacity of the system.,Command : /opt/Navisphere/bin/naviseccli -h <ip-address> -User <user-name> -Password <password> -Scope 0 getdisk This metric is calculated from number of Enabled,Unbound,Hot spare ready disks total space |
| emc.vnx.system.configuredstoragecapacity | EMC VNX System Configured Storage Capacity | GB | The total configured disk capacity of the system.,Command : /opt/Navisphere/bin/naviseccli -h <ip-address> -User <user-name> -Password <password> -Scope 0 getdisk This metric is calculated from number of Enabled disks total space | |
| emc.vnx.system.luncount | EMC VNX System Lun Count | The total number of LUNs. Command : /opt/Navisphere/bin/naviseccli -h <ip-address> -User <user-name> -Password <password> -Scope 0 getlun -name | ||
| emc.vnx.system.diskcount | EMC VNX System Disk Count | The total number of disks.,Command : /opt/Navisphere/bin/naviseccli -h <ip-address> -User <user-name> -Password <password> -Scope 0 getdisk | ||
| emc.vnx.system.configureddiskcount | EMC VNX System Configured Disk Count | The number of configured disks.,Command : /opt/Navisphere/bin/naviseccli -h <ip-address> -User <user-name> -Password <password> -Scope 0 getdisk. This metric is calculated from number of Enabled disks | ||
| emc.vnx.system.unconfigureddiskcount | EMC VNX System UnConfigured Disk Count | The number of unconfigured disks.,Command : /opt/Navisphere/bin/naviseccli -h <ip-address> -User <user-name> -Password <password> -Scope 0 getdisk. This metric is calculated from number of unbound disks | ||
| emc.vnx.system.hotsparediskcount | EMC VNX System Hot Spared Disk Count | The total number of hot spare disks which are ready.,Command : /opt/Navisphere/bin/naviseccli -h <ip-address> -User <user-name> -Password <password> -Scope 0 getdisk. This metric is calculated from number of hot spared disks |
G2 - EMC VNX SAN Storage Pool
Description
G2 - EMC VNX SAN Storage Pool. This template is applicable for block and raid pool.
Prerequisites
No prerequisite
Supported Metric
| Monitor Name | Metric Name | Metric Display Name | Unit | Description |
|---|---|---|---|---|
| G2 - EMC VNX SAN Storage Pool Monitor | emc.vnx.storagepool.availablesize | EMC VNX Storage Pool Available Size | GB | Storage Pool available capacity.,VNX have 3 type of storage pools. File pool,Block pool and Raid pool. If it is file pool OpsRamp used XML api to calculate this metric. If it is block pool then command is /opt/Navisphere/bin/naviseccli -h <ip-address> -User <user-name> -Password <password> -Scope 0 storagepool -list.,If it is raid pool command is /opt/Navisphere/bin/naviseccli -h <ip-address> -User <user-name> -Password <password> -Scope 0 getrg |
| emc.vnx.storagepool.utilization | EMC VNX Storage Pool Utilization | % | Pool utilization.,VNX have 3 type of storage pools. File pool,Block pool and Raid pool. If it is file pool OpsRamp used XML api to calculate this metric. If it is block pool then command is /opt/Navisphere/bin/naviseccli -h <ip-address> -User <user-name> -Password <password> -Scope 0 storagepool -list.,If it is raid pool command is /opt/Navisphere/bin/naviseccli -h <ip-address> -User <user-name> -Password <password> -Scope 0 getrg | |
| emc.vnx.storagepool.status | EMC VNX Storage Pool Status | Displays the information for the current state of the pool.,VNX have 3 type of storage pools. File pool,Block pool and Raid pool. If it is file pool OpsRamp used XML api to calculate this metric. If it is block pool then command is /opt/Navisphere/bin/naviseccli -h <ip-address> -User <user-name> -Password <password> -Scope 0 storagepool -list.,If it is raid pool command is /opt/Navisphere/bin/naviseccli -h <ip-address> -User <user-name> -Password <password> -Scope 0 getrg | ||
| emc.vnx.storagepool.rawcapacity | EMC VNX Storage Pool Raw Capacity | GB | The raw capacity of the Pool. VNX have 3 type of storage pools. File pool,Block pool and Raid pool. For file pools unable to get raw capacity. If it is block pool then command is /opt/Navisphere/bin/naviseccli -h <ip-address> -User <user-name> -Password <password> -Scope 0 storagepool -list.,If it is raid pool command is /opt/Navisphere/bin/naviseccli -h <ip-address> -User <user-name> -Password <password> -Scope 0 getrg | |
| emc.vnx.storagepool.percentfree | EMC VNX Storage Pool Percentage Free | % | The percent of the Pool that is free.,VNX have 3 type of storage pools. File pool,Block pool and Raid pool. If it is file pool OpsRamp used XML api to calculate this metric. If it is block pool then command is /opt/Navisphere/bin/naviseccli -h <ip-address> -User <user-name> -Password <password> -Scope 0 storagepool -list.,If it is raid pool command is /opt/Navisphere/bin/naviseccli -h <ip-address> -User <user-name> -Password <password> -Scope 0 getrg | |
| emc.vnx.storagepool.numberofluns | EMC VNX Storage Pool Number of Luns | The number of LUNs using the pool.,VNX have 3 type of storage pools. File pool,Block pool and Raid pool. File pool didn't have luns. If it is block pool then command is /opt/Navisphere/bin/naviseccli -h <ip-address> -User <user-name> -Password <password> -Scope 0 storagepool -list.,If it is raid pool command is /opt/Navisphere/bin/naviseccli -h <ip-address> -User <user-name> -Password <password> -Scope 0 getrg | ||
| emc.vnx.storagepool.logicalcapacity | EMC VNX Storage Pool Logical Capacity | GB | The logical capacity of the pool. VNX have 3 type of storage pools. File pool,Block pool and Raid pool. If it is file pool unable to get logical capacity of the storage pool. If it is block pool then command is /opt/Navisphere/bin/naviseccli -h <ip-address> -User <user-name> -Password <password> -Scope 0 storagepool -list.,If it is raid pool command is /opt/Navisphere/bin/naviseccli -h <ip-address> -User <user-name> -Password <password> -Scope 0 getrg |
G2 - EMC VNX Secondary Control Station Template
Description
G2 - EMC VNX Secondary Control Station Template. This template is applicable for secondary control station.
Prerequisites
No prerequisite
Supported Metric
| Monitor Name | Metric Name | Metric Display Name | Unit | Description |
|---|---|---|---|---|
| G2 - EMC VNX Secondary Control Station Monitor | emc.vnx.secondarycs.status | EMC VNX Secondary Control Station Status | Status of the Secondary Control station.,OpsRamp used XML API to get this metric. |
G2 - EMC VNX Storage Processor Template
Description
G2 - EMC VNX Storage Processor Template. This template is applicable for storage processor
Prerequisites
No prerequisite
Supported Metric
| Monitor Name | Metric Name | Metric Display Name | Unit | Description |
|---|---|---|---|---|
| G2 - EMC VNX Storage Processor Monitor | emc.vnx.storageprocessor.prctbusy | EMC VNX Storage Processor Percent Busy | % | Indicates percent utilization of the storage processor.,Command : /opt/Navisphere/bin/naviseccli -h <ip-address> -User <user-name> -Password <password> -Scope 0 getall -sp |
| emc.vnx.storageprocessor.totalthroughput | EMC VNX Storage Processor Total Throughput | psec | Average number of requests that is passed through the storage processor per second.,Command : /opt/Navisphere/bin/naviseccli -h <ip-address> -User <user-name> -Password <password> -Scope 0 getall -sp | |
| emc.vnx.storageprocessor.readthroughput | EMC VNX Storage Processor Read Throughput | psec | Average number of read requests that is passed through the storage processor per second.,Command : Command : /opt/Navisphere/bin/naviseccli -h <ip-address> -User <user-name> -Password <password> -Scope 0 getall -sp | |
| emc.vnx.storageprocessor.writethroughput | EMC VNX Storage Processor Write Throughput | psec | Average number of write requests that is passed through the storage processor per second.,Command : /opt/Navisphere/bin/naviseccli -h <ip-address> -User <user-name> -Password <password> -Scope 0 getall -sp | |
| emc.vnx.storageprocessor.status | EMC VNX Storage Processor Status | Status of the Storage Processor,Command : /opt/Navisphere/bin/naviseccli -h <ip-address> -User <user-name> -Password <password> -Scope 0 getcrus -spa | ||
| emc.vnx.storageprocessor.readcachestate | EMC VNX Storage Processor Read Cache State | Storage Processor Read Cache state.,Command : /opt/Navisphere/bin/naviseccli -h <ip-address> -User <user-name> -Password <password> -Scope 0 getall -sp | ||
| emc.vnx.storageprocessor.writecachestate | EMC VNX Storage Processor Write Cache State | Storage Processor Write Cache state.,Command : /opt/Navisphere/bin/naviseccli -h <ip-address> -User <user-name> -Password <password> -Scope 0 getall -sp | ||
| emc.vnx.storageprocessor.cablestatus | EMC VNX Storage Processor Cable Status | Storage Processor Cabling status.,Command : /opt/Navisphere/bin/naviseccli -h <ip-address> -User <user-name> -Password <password> -Scope 0 getcrus -cablingspsa/-cablingspsb | ||
| emc.vnx.storageprocessor.cpustatus | EMC VNX Storage Processor CPU Status | Storage Processor CPU status.,Command : /opt/Navisphere/bin/naviseccli -h <ip-address> -User <user-name> -Password <password> -Scope 0 getcrus -cpua/-cpub | ||
| emc.vnx.storageprocessor.fanstatus | EMC VNX Storage Processor Fan Status | Storage Processor Fan status.,Command : /opt/Navisphere/bin/naviseccli -h <ip-address> -User <user-name> -Password <password> -Scope 0 getcrus -fana/-fanb | ||
| emc.vnx.storageprocessor.lccstatus | EMC VNX Storage Processor LCC Status | Storage Processor link control card status.,Command : /opt/Navisphere/bin/naviseccli -h <ip-address> -User <user-name> -Password <password> -Scope 0 getcrus -lcca/-lccb | ||
| emc.vnx.storageprocessor.spsstatus | EMC VNX Storage Processor SPS Status | Storage Processor standby power supply status.,Command : /opt/Navisphere/bin/naviseccli -h <ip-address> -User <user-name> -Password <password> -Scope 0 getcrus -spsa/-spsb | ||
| emc.vnx.storageprocessor.powerstatus | EMC VNX Storage Processor Power Status | Storage Processor power status.,Command : /opt/Navisphere/bin/naviseccli -h <ip-address> -User <user-name> -Password <password> -Scope 0 getcrus -all | ||
| emc.vnx.storageprocessor.fault-led-status | EMC VNX Storage Processor Fault LED Status | Status of fault LED.,Command : /opt/Navisphere/bin/naviseccli -h <ip-address> -User <user-name> -Password <password> -Scope 0 getall -sp | ||
| emc.vnx.storageprocessor.statistics-logging-status | EMC VNX Storage Processor Statistics Logging Status | Status of Statistics Logging. This Serve for performance monitoring.,Command : /opt/Navisphere/bin/naviseccli -h <ip-address> -User <user-name> -Password <password> -Scope 0 getall -sp | ||
| emc.vnx.storageprocessor.responsetime | EMC VNX Storage Processor Response Time | ms | Amount of time it takes for a storage processor to process an input-output request.,Command : /opt/Navisphere/bin/naviseccli -h <ip-address> -User <user-name> -Password <password> -Scope 0 getall -sp Formula : Response time : 1000 * (Queue length/throughput) | |
| emc.vnx.storageprocessor.totalwrites | EMC VNX Storage Processor Total Writes | Number of write operations performed by the storage processor.,Command : /opt/Navisphere/bin/naviseccli -h <ip-address> -User <user-name> -Password <password> -Scope 0 getall -sp | ||
| emc.vnx.storageprocessor.totalreads | EMC VNX Storage Processor Total Reads | Number of read operations to the storage processor.,Command : /opt/Navisphere/bin/naviseccli -h <ip-address> -User <user-name> -Password <password> -Scope 0 getall -sp | ||
| emc.vnx.storageprocessor.blocksread | EMC VNX Storage Processor Blocks Read Per Second | Number of blocks transferred for read operations.,Command : /opt/Navisphere/bin/naviseccli -h <ip-address> -User <user-name> -Password <password> -Scope 0 getall -sp | ||
| emc.vnx.storageprocessor.blockswritten | EMC VNX Storage Processor Blocks Written Per Second | Number of blocks transferred for write operations.,Command : /opt/Navisphere/bin/naviseccli -h <ip-address> -User <user-name> -Password <password> -Scope 0 getall -sp | ||
| emc.vnx.storageprocessor.averagebusy-queuelength | EMC VNX Storage Processor Average Busy Queuelength | The average number of outstanding requests.,Command : /opt/Navisphere/bin/naviseccli -h <ip-address> -User <user-name> -Password <password> -Scope 0 getall -sp Formula : Average Busy Queue Length : (Sum Queue Lengths - (Number arrivals With Non Zero Queue / 2)) / (Read Throughput [IO/s] + Write Throughput [IO/s]) | ||
| emc.vnx.storageprocessor.servicetime | EMC VNX Storage Processor Service Time | ms | The total time spent to serve the request.Command : /opt/Navisphere/bin/naviseccli -h <ip-address> -User <user-name> -Password <password> -Scope 0 getall -sp Formula : Service time = 1000 * (Utilization/throughput) | |
| emc.vnx.storageprocessor.prctidle | EMC VNX Storage Processor Percent Idle | % | Indicates the percentage of time for the storage processor was idle.,Command : /opt/Navisphere/bin/naviseccli -h <ip-address> -User <user-name> -Password <password> -Scope 0 getall -sp |
G2 - EMC VNX Volume Template
Description
G2 - EMC VNX Volume Template. This template is applicable for storage array volume.
Prerequisites
No prerequisite
Supported Metric
| Monitor Name | Metric Name | Metric Display Name | Unit | Description |
|---|---|---|---|---|
| G2 - EMC VNX Volume Monitor | emc.vnx.volume.availablesize | EMC VNX Volume Available Size | GB | Volume available capacity.,OpsRamp used XML API to get this metric. |
| emc.vnx.volume.utilization | EMC VNX Volume Utilization | % | Indicates volume utilization.,OpsRamp used XML API to get this metric. | |
| emc.vnx.volume.status | EMC VNX Volume Status | Displays the information for the current state of the volume.,OpsRamp used XML API to get this metric. |
G2 - EMC VNXe Status Template
Description
This template monitors status of components and applicable for storage array.
Prerequisites
No prerequisite
Supported Metric
| Monitor Name | Metric Name | Metric Display Name | Unit | Description |
|---|---|---|---|---|
| G2 - EMC VNXe Status Monitor | emc.vnxe.battery.status | EMC VNXe Battery Status | NULL | EMC VNXe Battery Status. Command is : /opt/emc/uemcli-1.5.4.1.0027/bin/uemcli.sh -d <ip-address> -port 443 -u <scope/username> -p <password> -sslPolicy accept -t 240 -noheader /env/bat show -output csv |
| emc.vnxe.cache.status | EMC VNXe Cache Status | NULL | Status of the Cache. Command is : /opt/emc/uemcli-1.5.4.1.0027/bin/uemcli.sh -d <ip-address> -port 443 -u <scope/username> -p <password> -sslPolicy accept -t 240 -noheader /env/ccard show -output csv | |
| emc.vnxe.dae.status | EMC VNXe DAE Status | NULL | Status of the Disk Array Enclosure (DAE). Command is : /opt/emc/uemcli-1.5.4.1.0027/bin/uemcli.sh -d <ip-address> -port 443 -u <scope/username> -p <password> -sslPolicy accept -t 240 -noheader /env/dae show -output csv | |
| emc.vnxe.dpe.status | EMC VNXe DPE Status | NULL | Status of the Disk Processor Enclosure (DPE). Command is : /opt/emc/uemcli-1.5.4.1.0027/bin/uemcli.sh -d <ip-address> -port 443 -u <scope/username> -p <password> -sslPolicy accept -t 240 -noheader /env/dpe show -output csv | |
| emc.vnxe.ethernet.status | EMC VNXe Ethernet Status | NULL | Status of the Ethernet Port. Command is : /opt/emc/uemcli-1.5.4.1.0027/bin/uemcli.sh -d <ip-address> -port 443 -u <scope/username> -p <password> -sslPolicy accept -t 240 -noheader /net/port/eth show -output csv | |
| emc.vnxe.fan.status | EMC VNXe Fan Status | NULL | Status of the Fan. Command is : /opt/emc/uemcli-1.5.4.1.0027/bin/uemcli.sh -d <ip-address> -port 443 -u <scope/username> -p <password> -sslPolicy accept -t 240 -noheader /env/fan show -output csv | |
| emc.vnxe.fcport.status | EMC VNXe FC Port Status | NULL | Status of the FC Port. Command is : /opt/emc/uemcli-1.5.4.1.0027/bin/uemcli.sh -d <ip-address> -port 443 -u <scope/username> -p <password> -sslPolicy accept -t 240 -noheader /net/port/fc show -output csv | |
| emc.vnxe.host.status | EMC VNXe Host Status | NULL | Status of the Host. Command is : /opt/emc/uemcli-1.5.4.1.0027/bin/uemcli.sh -d <ip-address> -port 443 -u <scope/username> -p <password> -sslPolicy accept -t 240 -noheader /remote/host show -output csv | |
| emc.vnxe.io.status | EMC VNXe IO Status | NULL | Status of the IO Module. Command is : /opt/emc/uemcli-1.5.4.1.0027/bin/uemcli.sh -d <ip-address> -port 443 -u <scope/username> -p <password> -sslPolicy accept -t 240 -noheader /env/iomodule show -output csv | |
| emc.vnxe.iscsinode.status | EMC VNXe iSCSI Node Status | NULL | Status of the iSCSI Node. Command is : /opt/emc/uemcli-1.5.4.1.0027/bin/uemcli.sh -d <ip-address> -port 443 -u <scope/username> -p <password> -sslPolicy accept -t 240 -noheader /net/iscsi/node show -output csv | |
| emc.vnxe.lcc.status | EMC VNXe LCC Status | NULL | Status of the Manage link control card (LCC). Command is : /opt/emc/uemcli-1.5.4.1.0027/bin/uemcli.sh -d <ip-address> -port 443 -u <scope/username> -p <password> -sslPolicy accept -t 240 -noheader /env/lcc show -output csv | |
| emc.vnxe.license.status | EMC VNXe License Status | NULL | Status of the License. Command is : /opt/emc/uemcli-1.5.4.1.0027/bin/uemcli.sh -d <ip-address> -port 443 -u <scope/username> -p <password> -sslPolicy accept -t 240 -noheader /sys/lic show -output csv | |
| emc.vnxe.mm.status | EMC VNXe Memory Module Status | NULL | Status of the Memory Module (MM). Command is : /opt/emc/uemcli-1.5.4.1.0027/bin/uemcli.sh -d <ip-address> -port 443 -u <scope/username> -p <password> -sslPolicy accept -t 240 -noheader /env/mm show -output csv | |
| emc.vnxe.powersupply.status | EMC VNXe Power Supply Status | NULL | Status of the Power Supply. Command is : /opt/emc/uemcli-1.5.4.1.0027/bin/uemcli.sh -d <ip-address> -port 443 -u <scope/username> -p <password> -sslPolicy accept -t 240 -noheader /env/ps show -output csv | |
| emc.vnxe.ssd.status | EMC VNXe SSD Status | NULL | Status of the Solid State Drive (SSD). Command is : /opt/emc/uemcli-1.5.4.1.0027/bin/uemcli.sh -d <ip-address> -port 443 -u <scope/username> -p <password> -sslPolicy accept -t 240 -noheader /env/ssd show -output csv | |
| emc.vnxe.system.status | EMC VNXe System Status | NULL | Status of the System. Command is : /opt/emc/uemcli-1.5.4.1.0027/bin/uemcli.sh -d <ip-address> -port 443 -u <scope/username> -p <password> -sslPolicy accept -t 240 -noheader /sys/general show -output csv | |
| emc.vnxe.vmfsdatastore.status | EMC VNXe VMFS Data Store Status | NULL | Status of the VMFS Data Store. Command is : /opt/emc/uemcli-1.5.4.1.0027/bin/uemcli.sh -d <ip-address> -port 443 -u <scope/username> -p <password> -sslPolicy accept -t 240 -noheader /stor/prov/vmware/vmfs show -output csv | |
| emc.vnxe.snapshot.state | EMC VNXe Snapshot Status | NULL | Status of the Snapshot. Command is : /opt/emc/uemcli-1.5.4.1.0027/bin/uemcli.sh -d <ip-address> -port 443 -u <scope/username> -p <password> -sslPolicy accept -t 240 -noheader /prot/snap show -output csv | |
| emc.vnxe.replicationsession.status | EMC VNXe Replication Session Status | s | Status of the Replication Session. Command is : /opt/emc/uemcli-1.5.4.1.0027/bin/uemcli.sh -d <ip-address> -port 443 -u <scope/username> -p <password> -sslPolicy accept -t 240 -noheader /prot/rep/session show -output csv |
G2 - EMC VNXe Storage Array CIFS Template
Description
This template is applicable for storage array.
Prerequisites
No prerequisite
Supported Metric
| Monitor Name | Metric Name | Metric Display Name | Unit | Description |
|---|---|---|---|---|
| G2 - EMC VNXe Storage Array CIFS Monitor | emc.vnxe.cifs.readavgsize | EMC VNXe CIFS Read Average Size | KB | Average CIFS read size. Command is : /opt/emc/uemcli-1.5.4.1.0027/bin/uemcli.sh -d <ip-address> -port 443 -u <scope/username> -p <password> -sslPolicy accept -t 240 -noheader /metrics/value/rt -path sp.*.cifs.global.basic show -interval 10 -count 1 -expand -output csv |
| emc.vnxe.cifs.readbytes | EMC VNXe CIFS Read Bytes | KBps | Number of CIFS bytes read. Command is : /opt/emc/uemcli-1.5.4.1.0027/bin/uemcli.sh -d <ip-address> -port 443 -u <scope/username> -p <password> -sslPolicy accept -t 240 -noheader /metrics/value/rt -path sp.*.cifs.global.basic show -interval 10 -count 1 -expand -output csv | |
| emc.vnxe.cifs.reads | EMC VNXe CIFS Reads | psec | Number of CIFS read operations. Command is : /opt/emc/uemcli-1.5.4.1.0027/bin/uemcli.sh -d <ip-address> -port 443 -u <scope/username> -p <password> -sslPolicy accept -t 240 -noheader /metrics/value/rt -path sp.*.cifs.global.basic show -interval 10 -count 1 -expand -output csv | |
| emc.vnxe.cifs.totalops | EMC VNXe CIFS Total Operations | psec | Total number of CIFS operations. Command is : /opt/emc/uemcli-1.5.4.1.0027/bin/uemcli.sh -d <ip-address> -port 443 -u <scope/username> -p <password> -sslPolicy accept -t 240 -noheader /metrics/value/rt -path sp.*.cifs.global.basic show -interval 10 -count 1 -expand -output csv | |
| emc.vnxe.cifs.writeavgsize | EMC VNXe CIFS Write Average Size | KB | Average CIFS write size. Command is : /opt/emc/uemcli-1.5.4.1.0027/bin/uemcli.sh -d <ip-address> -port 443 -u <scope/username> -p <password> -sslPolicy accept -t 240 -noheader /metrics/value/rt -path sp.*.cifs.global.basic show -interval 10 -count 1 -expand -output csv | |
| emc.vnxe.cifs.writebytes | EMC VNXe CIFS Write Bytes | KBps | Number of CIFS bytes write. Command is : /opt/emc/uemcli-1.5.4.1.0027/bin/uemcli.sh -d <ip-address> -port 443 -u <scope/username> -p <password> -sslPolicy accept -t 240 -noheader /metrics/value/rt -path sp.*.cifs.global.basic show -interval 10 -count 1 -expand -output csv | |
| emc.vnxe.cifs.writes | EMC VNXe CIFS Writes | psec | Number of CIFS write operations. Command is : /opt/emc/uemcli-1.5.4.1.0027/bin/uemcli.sh -d <ip-address> -port 443 -u <scope/username> -p <password> -sslPolicy accept -t 240 -noheader /metrics/value/rt -path sp.*.cifs.global.basic show -interval 10 -count 1 -expand -output csv |
G2 - EMC VNXe Storage Array CPU Template
Description
This template is applicable for storage array.
Prerequisites
No prerequisite
Supported Metric
| Monitor Name | Metric Name | Metric Display Name | Unit | Description |
|---|---|---|---|---|
| G2 - EMC VNXe Storage Array CPU Monitor | emc.vnxe.cpu.summaryutilization | EMC VNXe CPU Summary Utilization | % | CPU Summary Utilization. Command is : /opt/emc/uemcli-1.5.4.1.0027/bin/uemcli.sh -d <ip-address> -port 443 -u <scope/username> -p <password> -sslPolicy accept -t 240 -noheader /metrics/value/rt -path sp.*.cpu show -interval 10 -count 1 -expand -output csv |
| emc.vnxe.cpu.uptime | EMC VNXe CPU Uptime | s | Time since boot up in seconds. Command is : /opt/emc/uemcli-1.5.4.1.0027/bin/uemcli.sh -d <ip-address> -port 443 -u <scope/username> -p <password> -sslPolicy accept -t 240 -noheader /metrics/value/rt -path sp.*.cpu show -interval 10 -count 1 -expand -output csv |
G2 - EMC VNXe Storage Array Disk Template
Description
This template is applicable for storage array.
Prerequisites
No prerequisite
Supported Metric
| Monitor Name | Metric Name | Metric Display Name | Unit | Description |
|---|---|---|---|---|
| G2 - EMC VNXe Storage Array Disk Monitor | emc.vnxe.disk.averagequeuelength | EMC VNXe Disk Average Queue Length | NULL | Average Queue Length for the disk. Command is : /opt/emc/uemcli-1.5.4.1.0027/bin/uemcli.sh -d <ip-address> -port 443 -u <scope/username> -p <password> -sslPolicy accept -t 240 -noheader /metrics/value/rt -path sp.*.physical.disk show -interval 10 -count 1 -expand -output csv |
| emc.vnxe.disk.readbytes | EMC VNXe Disk Read Bytes | KBps | Number of bytes read from this disk. Command is : /opt/emc/uemcli-1.5.4.1.0027/bin/uemcli.sh -d <ip-address> -port 443 -u <scope/username> -p <password> -sslPolicy accept -t 240 -noheader /metrics/value/rt -path sp.*.physical.disk show -interval 10 -count 1 -expand -output csv | |
| emc.vnxe.disk.reads | EMC VNXe Disk Reads | psec | Reads from this disk. Command is : /opt/emc/uemcli-1.5.4.1.0027/bin/uemcli.sh -d <ip-address> -port 443 -u <scope/username> -p <password> -sslPolicy accept -t 240 -noheader /metrics/value/rt -path sp.*.physical.disk show -interval 10 -count 1 -expand -output csv | |
| emc.vnxe.disk.responsetime | EMC VNXe Disk Response time | microsec | Average response time for this disk,measured in microseconds. This measures the average time it takes for a disk request to complete. Command is : /opt/emc/uemcli-1.5.4.1.0027/bin/uemcli.sh -d <ip-address> -port 443 -u <scope/username> -p <password> -sslPolicy accept -t 240 -noheader /metrics/value/rt -path sp.*.physical.disk show -interval 10 -count 1 -expand -output csv | |
| emc.vnxe.disk.servicetime | EMC VNXe Disk Service time | microsec | Average service time for this disk,measured in microseconds. This measures the average time the disk spends on each individual request. Command is : /opt/emc/uemcli-1.5.4.1.0027/bin/uemcli.sh -d <ip-address> -port 443 -u <scope/username> -p <password> -sslPolicy accept -t 240 -noheader /metrics/value/rt -path sp.*.physical.disk show -interval 10 -count 1 -expand -output csv | |
| emc.vnxe.disk.status | EMC VNXe Disk Status | NULL | Status of the Disk. Command is : /opt/emc/uemcli-1.5.4.1.0027/bin/uemcli.sh -d <ip-address> -port 443 -u <scope/username> -p <password> -sslPolicy accept -t 240 -noheader /env/disk show -output csv | |
| emc.vnxe.disk.totalcalls | EMC VNXe Disk Total Calls | psec | Total Reads and Writes for this disk. Command is : /opt/emc/uemcli-1.5.4.1.0027/bin/uemcli.sh -d <ip-address> -port 443 -u <scope/username> -p <password> -sslPolicy accept -t 240 -noheader /metrics/value/rt -path sp.*.physical.disk show -interval 10 -count 1 -expand -output csv | |
| emc.vnxe.disk.utilization | EMC VNXe Disk Utilization | % | Utilization % for this disk. Command is : /opt/emc/uemcli-1.5.4.1.0027/bin/uemcli.sh -d <ip-address> -port 443 -u <scope/username> -p <password> -sslPolicy accept -t 240 -noheader /metrics/value/rt -path sp.*.physical.disk show -interval 10 -count 1 -expand -output csv | |
| emc.vnxe.disk.writebytes | EMC VNXe Disk Write Bytes | KBps | Number of bytes written to this disk. Command is : /opt/emc/uemcli-1.5.4.1.0027/bin/uemcli.sh -d <ip-address> -port 443 -u <scope/username> -p <password> -sslPolicy accept -t 240 -noheader /metrics/value/rt -path sp.*.physical.disk show -interval 10 -count 1 -expand -output csv | |
| emc.vnxe.disk.writes | EMC VNXe Disk Writes | psec | Writes to this disk. Command is : /opt/emc/uemcli-1.5.4.1.0027/bin/uemcli.sh -d <ip-address> -port 443 -u <scope/username> -p <password> -sslPolicy accept -t 240 -noheader /metrics/value/rt -path sp.*.physical.disk show -interval 10 -count 1 -expand -output csv |
G2 - EMC VNXe Storage Array Network Template
Description
This template is applicable for storage array.
Prerequisites
No prerequisite
Supported Metric
| Monitor Name | Metric Name | Metric Display Name | Unit | Description |
|---|---|---|---|---|
| G2 - EMC VNXe Storage Array Network Monitor | emc.vnxe.network.bytesin | EMC VNXe Network Bytes in | KBps | Number of octets read from network device. Command is : /opt/emc/uemcli-1.5.4.1.0027/bin/uemcli.sh -d <ip-address> -port 443 -u <scope/username> -p <password> -sslPolicy accept -t 240 -noheader /metrics/value/rt -path sp.*.net.device show -interval 10 -count 1 -expand -output csv |
| emc.vnxe.network.bytesout | EMC VNXe Network Bytes out | KBps | Number of octets written to network device. Command is : /opt/emc/uemcli-1.5.4.1.0027/bin/uemcli.sh -d <ip-address> -port 443 -u <scope/username> -p <password> -sslPolicy accept -t 240 -noheader /metrics/value/rt -path sp.*.net.device show -interval 10 -count 1 -expand -output csv | |
| emc.vnxe.network.pktsin | EMC VNXe Network Packets in | psec | Number of packets read from network device. Command is : /opt/emc/uemcli-1.5.4.1.0027/bin/uemcli.sh -d <ip-address> -port 443 -u <scope/username> -p <password> -sslPolicy accept -t 240 -noheader /metrics/value/rt -path sp.*.net.device show -interval 10 -count 1 -expand -output csv | |
| emc.vnxe.network.pktsout | EMC VNXe Network Packets out | psec | Number of packets written to network device. Command is : /opt/emc/uemcli-1.5.4.1.0027/bin/uemcli.sh -d <ip-address> -port 443 -u <scope/username> -p <password> -sslPolicy accept -t 240 -noheader /metrics/value/rt -path sp.*.net.device show -interval 10 -count 1 -expand -output csv |
G2 - EMC VNXe Storage Array NFS Datastore Template
Description
This template is applicable for storage array.
Prerequisites
No prerequisite
Supported Metric
| Monitor Name | Metric Name | Metric Display Name | Unit | Description |
|---|---|---|---|---|
| G2 - EMC VNXe Storage Array NFS Datastore Monitor | emc.vnxe.nfsdatastore.availablesize | EMC VNXe NFS Data Store Available Size | GB | NFS Data Store Available Size. Command is : /opt/emc/uemcli-1.5.4.1.0027/bin/uemcli.sh -d <ip-address> -port 443 -u <scope/username> -p <password> -sslPolicy accept -t 240 -noheader /stor/prov/vmware/nfs show -output csv |
| emc.vnxe.nfsdatastore.status | EMC VNXe NFS Data Store Status | NULL | Status of the NFS Data store. Command is : /opt/emc/uemcli-1.5.4.1.0027/bin/uemcli.sh -d <ip-address> -port 443 -u <scope/username> -p <password> -sslPolicy accept -t 240 -noheader /stor/prov/vmware/nfs show -output csv | |
| emc.vnxe.nfsdatastore.utilization | EMC VNXe NFS Data Store Utilization | % | NFS Data Store Utilization. Command is : /opt/emc/uemcli-1.5.4.1.0027/bin/uemcli.sh -d <ip-address> -port 443 -u <scope/username> -p <password> -sslPolicy accept -t 240 -noheader /stor/prov/vmware/nfs show -output csv |
G2 - EMC VNXe Storage Array NFS Template
Description
This template is applicable for storage array.
Prerequisites
No prerequisite
Supported Metric
| Monitor Name | Metric Name | Metric Display Name | Unit | Description |
|---|---|---|---|---|
| G2 - EMC VNXe Storage Array NFS Monitor | emc.vnxe.nfs.readavgsize | EMC VNXe NFS Read Average Size | KB | Average NFS read size. Command is : /opt/emc/uemcli-1.5.4.1.0027/bin/uemcli.sh -d <ip-address> -port 443 -u <scope/username> -p <password> -sslPolicy accept -t 240 -noheader /metrics/value/rt -path sp.*.nfs.basic show -interval 10 -count 1 -expand -output csv |
| emc.vnxe.nfs.readbytes | EMC VNXe NFS Read Bytes | KBps | Number of NFS bytes read. Command is : /opt/emc/uemcli-1.5.4.1.0027/bin/uemcli.sh -d <ip-address> -port 443 -u <scope/username> -p <password> -sslPolicy accept -t 240 -noheader /metrics/value/rt -path sp.*.nfs.basic show -interval 10 -count 1 -expand -output csv | |
| emc.vnxe.nfs.reads | EMC VNXe NFS Reads | psec | Number of NFS read operations. Command is : /opt/emc/uemcli-1.5.4.1.0027/bin/uemcli.sh -d <ip-address> -port 443 -u <scope/username> -p <password> -sslPolicy accept -t 240 -noheader /metrics/value/rt -path sp.*.nfs.basic show -interval 10 -count 1 -expand -output csv | |
| emc.vnxe.nfs.writeavgsize | EMC VNXe NFS Write Average Size | KB | Average NFS write size. Command is : /opt/emc/uemcli-1.5.4.1.0027/bin/uemcli.sh -d <ip-address> -port 443 -u <scope/username> -p <password> -sslPolicy accept -t 240 -noheader /metrics/value/rt -path sp.*.nfs.basic show -interval 10 -count 1 -expand -output csv | |
| emc.vnxe.nfs.writebytes | EMC VNXe NFS Write Bytes | KBps | Number of NFS bytes write. Command is : /opt/emc/uemcli-1.5.4.1.0027/bin/uemcli.sh -d <ip-address> -port 443 -u <scope/username> -p <password> -sslPolicy accept -t 240 -noheader /metrics/value/rt -path sp.*.nfs.basic show -interval 10 -count 1 -expand -output csv | |
| emc.vnxe.nfs.writes | EMC VNXe NFS Writes | psec | Number of NFS write operations. Command is : /opt/emc/uemcli-1.5.4.1.0027/bin/uemcli.sh -d <ip-address> -port 443 -u <scope/username> -p <password> -sslPolicy accept -t 240 -noheader /metrics/value/rt -path sp.*.nfs.basic show -interval 10 -count 1 -expand -output csv |
G2 - EMC VNXe Storage Pool Template
Description
This template is applicable for storage pool or aggregate.
Prerequisites
No prerequisite
Supported Metric
| Monitor Name | Metric Name | Metric Display Name | Unit | Description |
|---|---|---|---|---|
| G2 - EMC VNXe Storage Pool Monitor | emc.vnxe.storagepool.availablesize | EMC VNXe Storage Pool Available Size | GB | Storage pool available size. Command is : /opt/emc/uemcli-1.5.4.1.0027/bin/uemcli.sh -d <ip-address> -port 443 -u <scope/username> -p <password> -sslPolicy accept -t 240 -noheader /stor/config/pool show -output csv |
| emc.vnxe.storagepool.status | EMC VNXe Storage Pool Status | NULL | EMC VNXe Storage Pool Status. Command is : /opt/emc/uemcli-1.5.4.1.0027/bin/uemcli.sh -d <ip-address> -port 443 -u <scope/username> -p <password> -sslPolicy accept -t 240 -noheader /stor/config/pool show -output csv | |
| emc.vnxe.storagepool.utilization | EMC VNXe Storage Pool Utilization | % | Storage pool Utilization. Command is : /opt/emc/uemcli-1.5.4.1.0027/bin/uemcli.sh -d <ip-address> -port 443 -u <scope/username> -p <password> -sslPolicy accept -t 240 -noheader /stor/config/pool show -output csv |
G2 - EMC VNXe Storage Processor Template
Description
This template is applicable for storage processor.
Prerequisites
No prerequisite
Supported Metric
| Monitor Name | Metric Name | Metric Display Name | Unit | Description |
|---|---|---|---|---|
| G2 - EMC VNXe Storage Processor Monitor | emc.vnxe.storageprocessor.readblocks | EMC VNXe Storage Processor Read Blocks | psec | Blocks read from this SP. Command is : /opt/emc/uemcli-1.5.4.1.0027/bin/uemcli.sh -d <ip-address> -port 443 -u <scope/username> -p <password> -sslPolicy accept -t 240 -noheader /metrics/value/rt -path sp.*.storage.summary show -interval 10 -count 1 -expand -output csv |
| emc.vnxe.storageprocessor.readbytes | EMC VNXe Storage Processor Read Bytes | KBps | Number of bytes read from this SP. Command is : /opt/emc/uemcli-1.5.4.1.0027/bin/uemcli.sh -d <ip-address> -port 443 -u <scope/username> -p <password> -sslPolicy accept -t 240 -noheader /metrics/value/rt -path sp.*.storage.summary show -interval 10 -count 1 -expand -output csv | |
| emc.vnxe.storageprocessor.reads | EMC VNXe Storage Processor Reads | psec | Reads from this SP. Command is : /opt/emc/uemcli-1.5.4.1.0027/bin/uemcli.sh -d <ip-address> -port 443 -u <scope/username> -p <password> -sslPolicy accept -t 240 -noheader /metrics/value/rt -path sp.*.storage.summary show -interval 10 -count 1 -expand -output csv | |
| emc.vnxe.storageprocessor.status | EMC VNXe Storage Processor Status | NULL | Status of the Storage Processor. Command is : /opt/emc/uemcli-1.5.4.1.0027/bin/uemcli.sh -d <ip-address> -port 443 -u <scope/username> -p <password> -sslPolicy accept -t 240 -noheader /env/sp show -output csv | |
| emc.vnxe.storageprocessor.totalbytes | EMC VNXe Storage Processor Total Bytes | KBps | Total number of read and write bytes on this sp. Command is : /opt/emc/uemcli-1.5.4.1.0027/bin/uemcli.sh -d <ip-address> -port 443 -u <scope/username> -p <password> -sslPolicy accept -t 240 -noheader /metrics/value/rt -path sp.*.storage.summary show -interval 10 -count 1 -expand -output csv | |
| emc.vnxe.storageprocessor.totalcalls | EMC VNXe Storage Processor Total Calls | psec | Total number of read and write requests on this SP. Command is : /opt/emc/uemcli-1.5.4.1.0027/bin/uemcli.sh -d <ip-address> -port 443 -u <scope/username> -p <password> -sslPolicy accept -t 240 -noheader /metrics/value/rt -path sp.*.storage.summary show -interval 10 -count 1 -expand -output csv | |
| emc.vnxe.storageprocessor.writeblocks | EMC VNXe Storage Processor Write Blocks | psec | Blocks write to this SP. Command is : /opt/emc/uemcli-1.5.4.1.0027/bin/uemcli.sh -d <ip-address> -port 443 -u <scope/username> -p <password> -sslPolicy accept -t 240 -noheader /metrics/value/rt -path sp.*.storage.summary show -interval 10 -count 1 -expand -output csv | |
| emc.vnxe.storageprocessor.writebytes | EMC VNXe Storage Processor Write Bytes | KBps | Number of bytes write to this SP. Command is : /opt/emc/uemcli-1.5.4.1.0027/bin/uemcli.sh -d <ip-address> -port 443 -u <scope/username> -p <password> -sslPolicy accept -t 240 -noheader /metrics/value/rt -path sp.*.storage.summary show -interval 10 -count 1 -expand -output csv | |
| emc.vnxe.storageprocessor.writes | EMC VNXe Storage Processor Writes | psec | Writes to this SP. Command is : /opt/emc/uemcli-1.5.4.1.0027/bin/uemcli.sh -d <ip-address> -port 443 -u <scope/username> -p <password> -sslPolicy accept -t 240 -noheader /metrics/value/rt -path sp.*.storage.summary show -interval 10 -count 1 -expand -output csv |
G2 - Agentless Linux Services Status - v2
Description
Monitors the status of the overall state the service is in. It can be active, reloading, inactive, failed, activating, or deactivating.
Prerequisites
- This template only works on systems having
Systemdas the default init system. - Requires Gateway version 14.0.0. or later.
Template Usage Guidelines
While applying this template on the device, provide specific input parameters in the below 2 formats only.
Format 1: all (case-insensitive)
If “all” is specified as custom script arguments, the script monitors all available services along with alert tokens that provide additional information, including the total count of services and the count of services in each available state.
Format 2: tuned, opsramp.*, systemd (provide service names without .service extension)
Users can specify comma-separated service names or service regex patterns for a more focused monitoring approach. The script filters and retrieves status information about the mentioned services only.
Note: We strongly recommend specifying only particular service names in input parameters, as monitoring all services may significantly increase the system load, especially in environments with a large number of services.
- V2 template is redesigned for better reliability and maintainability with improved performance.
Supported Metric
| Monitor Name | Metric Name | Metric Display Name | Unit | Description |
|---|---|---|---|---|
| G2 - Agentless Linux Services Status - v2 | system_linux_services_status | System Linux Services Status | null | Monitors the status of the overall state the service is in. It can be active, reloading, inactive, failed, activating, or deactivating. |
G2 - Agentless Linux Services Status
Description
Monitors the status of the overall state the service is in. It can be active, reloading, inactive, failed, activating, or deactivating.
Prerequisites
- SSH credentials need to be assigned on end device.
- This template requires Gateway version 14.0.0 or later.
- This template only works on systems having
Systemdas the default init system.
Template Tags: Agentless
Template Usage Guidelines
When applying this template to a device, you have to provide specific input parameters in one of the following two formats:
Format 1 all (case-insensitive)
- If all is specified as the custom script argument, the script monitors all available services.
- It also includes alert tokens that provide additional information, such as:
- The total count of services.
- The count of services in each available state.
Format 2 tuned, opsramp.*, systemd (provide service names without the .service extension)
- Specify comma-separated service names or service regex patterns for focused monitoring.
- The script filters and retrieves status information about only the mentioned services.
Note:
- It is recommended that you specify particular service names in the input parameters.
- Monitoring all services (
all) can significantly increase the system load, especially in environments with a large number of services.
Supported Metric
| Monitor Name | Metric Name | Metric Display Name | Unit | Description |
|---|---|---|---|---|
| G2 - Agentless Linux Services Status | system_linux_services_status | System Linux Services Status | null | Monitors the status of the overall state the service is in. It can be active, reloading, inactive, failed, activating, or deactivating. |
G2 - Linux Agentless Process Statistics - v2
Description
Monitors the process statistics like instance count, Threads count, open fds count, cpu usage % and memory usage % , for Linux OS through Linux gateway. Script expects user to provide input parameters in any one of the below formats only:
- Format 1: Uses
:::to delimit mode and processes - Format 2: Uses
@@@to delimit multiple processes - Format 3: Uses
;;;to delimit processes and their friendly names
Notes:
- In formats 1 and 2 (with “includeArgs” and “excludeArgs” as modes), a friendly name is mandatory.
- If the friendly name is given, then for any process name or process regex that matches multiple process names in the system, the script will provide collective data for all of them, using the friendly name provided by the user as the component name.
- Regex patterns are not supported in Format 3.
Format 1: Script matches the given process name or process regex only with process names in the system.
Valid example: excludeArgs:::opsramp.*;;;opsramp@@@systemd.*;;;systemd
Invalid example: excludeArgs:::opsramp.*;;;opsramp@@@systemd.*
Format 2: Script matches the given process name or process regex with all process names and their arguments in the system.
Valid example: includeArgs:::opsramp.*;;;opsramp@@@systemd.*;;;systemd
Invalid example: includeArgs:::opsramp.*@@@systemd.*
Format 3: Script collects monitoring data only if the given exact process name is found in the system.
Valid example: exactProcessName:::opsramp-agent@@@scriptagent.bin
Invalid example: exactProcessName:::opsramp.*
- V2 template is redesigned for better reliability and maintainability with improved performance.
Prerequisites
End device SSH credentials must be added on the end device itself.
Supported Metric
| Monitor Name | Metric Name | Metric Display Name | Unit | Description |
|---|---|---|---|---|
| G2 - Linux Agentless Process Statistics Monitor - v2 | process_instances_count | Process Instances Count | count | Monitors instance count of each process of Linux Device. |
| process_threads_count | Process Threads Count | count | Monitors thread count of each process of Linux Device. | |
| process_openfds_count | Process Openfds Count | count | Monitors open file descriptors count of each process of Linux Device. | |
| process_memory_utilization_in_percentage | Process Memory Utilization Percentage | % | Monitors memory usage of each process of Linux Device. | |
| prcoess_cpu_utilization_in_percentage | Prcoess CPU Utilization Percentage | % | Monitors CPU usage of each process of Linux Device. |
G2 - Linux Agentless Process Statistics
Description
Monitors the process statistics like instance count,Threads count,open fds count,cpu usage % and memory usage %,for Linux OS through Linux gateway.
Template Usage Guidelines:
Template expects user to provide input parameters in any one of the below three formats only:
Format 1: The format uses ::: to delimit mode and processes.
Format 2: The format uses @@@ to delimit multiple processes.
Format 3: The format uses ;;; to delimit processes and their friendly names.
Notes:
- In the first two formats (with “includeArgs” and “excludeArgs” as modes),a friendly name is mandatory.
- In formats 1 and 2,if the provided process name or process regex matches multiple process names in the system,the template will provide collective data for all of them,using the friendly name provided by the user as the component name.
- In Format 3 (with the mode set to ‘exactProcessName’),regex patterns and friendly names are not supported. This format only works for exact process names present in the system.
Format 1: Template will match the given process name or process regex only with the process names in the system.
Valid Case Example:
excludeArgs:::opsramp.*;;;opsramp@@@systemd.*;;;systemd
Invalid Case Example:
excludeArgs:::opsramp.*;;;opsramp@@@systemd.*
Format 2: Template will match the given process name or process regex with all the process names and its arguments in the system.
Valid Case Example:
includeArgs:::opsramp.*;;;opsramp@@@systemd.*;;;systemd
Invalid Case Example:
includeArgs:::opsramp.*@@@systemd.*
Format 3: Template will collect monitoring data,only if the given exact process name is found in the system.
Valid Case Example:
exactProcessName:::opsramp-agent@@@scriptagent.bin
Invalid Case Example:
exactProcessName:::opsramp.*
Prerequisites
End device SSH credentials need to be added on End device itself.
Supported Metric
| Monitor Name | Metric Name | Metric Display Name | Unit | Description |
|---|---|---|---|---|
| G2 - Linux Agentless Process Statistics Monitor | process_instances_count | Process Instances Count | Count | Monitors Instance count of each process of Linux Device. |
| process_threads_count | Process Threads Count | Count | Monitors thread count of each process of Linux Device | |
| process_openfds_count | Process Openfds Count | Count | Monitors open file descriptors count of each process of Linux Device. | |
| process_memory_utilization_in_percentage | Process Memory Utilization Percentage | Percentage | Monitors Memory Usage of each process of Linux Device. | |
| prcoess_cpu_utilization_in_percentage | Prcoess CPU Utilization Percentage | Percentage | Monitors Cpu Usage of each process of Linux Device. |
G2 - Linux - PostgresDB Aliveness Check Status
This template will be deprecated soon.
Description
To monitor the aliveness of the postgres database
Prerequisites
- Gateway 7.0.0 and above.
- SSH credentials assigned on target machine and must have permission to access the provided .env file.
- Create a Postgres environment file and provide the file path as input parameter while applying the template.
- You need to provide env path for single instance -
<env path> & for multiple instances - <env path>,<env path2>,<env path3> - Along with setting up postgres environment this env file should contain other parameters like PGDATABASE,PGARCHIVEDIR,PGDATADIR,PGWALDIR,PGPORT,SERVICENAME."
Supported Metric
| Monitor Name | Metric Name | Metric Display Name | Unit | Description |
|---|---|---|---|---|
| G2 - Linux - PostgresDB Aliveness Check Status Monitor | postgres_check_dbalive | Postgres Check DBAlive | Postgres Check DBAlive |
G2 - Linux - PostgresDB Aliveness Check Status - v2
Description
To monitor the aliveness of the postgres database
Template Usage Guidelines:
- Create a Postgres environment file and provide the file path as input parameter while applying the template.
- We need to provide env path for single instance -
<env path> & for multiple instances - <env path1>,<env path2>,<env path3> - Along with setting up postgres environment,this env file should contain other parameters like PGDATABASE,PGARCHIVEDIR,PGDATADIR,PGWALDIR,PGPORT,SERVICENAME.
- Sample pg_new_5432.env file data:
export PATH=$PATH:/usr/pgsql-12/bin/
PGDATABASE=postgres
PGPORT=5432
PGARCHIVEDIR=/var/lib/pgsql/backups_main/archive/
PGDATADIR=/var/lib/pgsql/12/data
PGWALDIR=/var/lib/pgsql/12/data/pg_wal
SERVICENAME=postgresql-12
Prerequisites
SSH Credentials need to be assigned on end device.
Supported Metric
| Monitor Name | Metric Name | Metric Display Name | Unit | Description |
|---|---|---|---|---|
| G2 - Linux - PostgresDB Aliveness Check Status Monitor - v2 | postgres_check_dbalive | Postgres Check DBAlive | To monitor the aliveness of the postgres database |
G2 MSSQL Database Access Methods Template - v2.0
Description
This template supports windows and SQL server authentication modes Integration is done through JDBC and SQL queries.
Prerequisites
- The gateway version must be 14.0.0 or above.
- Database Credentials must be added on the end device.
- While applying template at device level cross check Transport Type, DB Instance name, Service port, Authentication Type.
Template Usage Guidelines
- We have to use below syntax if those are instances
<instance1>:<port1>,<instance2>:<port2>,..etc - If it is a database then we can use below syntax
<database1>,<database2>,..etc.
Supported Metric
| Monitor Name | Metric Name | Metric Display Name | Unit | Description |
|---|---|---|---|---|
| G2 MSSQL Database Access Methods Monitor - v2.0 | mssql.page.splits | Page splits | psec | The number of page splits per second that occur as the result of overflowing index pages. |
| mssql.full.scans | Full scans | psec | Number of unrestricted full scans. These can either be base table or full index scans. |
G2 MSSQL Database Agent Jobs Template - v2
Description
This template supports for both SQL and Windows Authentication. Integration is done through JDBC and MSSQL queries and tested in MSSQL v18.9.1. In this version, the object name is updated as “msdb.dbo.sysjobs”.
Prerequisites
- The gateway version must be 14.0.0 or above.
- Database Credentials must be added on the end device.
- While applying template at device level cross check Transport Type, DB Instance name, Service port, and Authentication Type.
Template Usage Guidelines
- We have to use the following syntax if those are instances
<instance1>:<port1>,<instance2>:<port2>,..etc - If it is a database then we can use below syntax
<database1>,<database2>,..etc
Supported Metric
| Monitor Name | Metric Name | Metric Display Name | Unit | Description |
|---|---|---|---|---|
| G2 MSSQL Database Agent Jobs Template - v2 | mssql_db_agentJobsStatus | MSSQL DB Agent Jobs Status | null | MSSQL DB Agent Jobs Status : This metric collects mssql agent job status latest information (in last 15mins only): The following are the possible status values - 0 : Failed 1 : Successful 2 : Retry 3 : Cancelled 4 : InProgress. |
G2 MSSQL Database Agent Jobs Template
Description
This template supports for both SQL and Windows Authentication. Integration is done through JDBC and MSSQL queries and tested in MSSQL v18.9.1
Prerequisites
- The gateway version must be 14.0.0 or above.
- Database Credentials must be added on the end device.
- While applying template at device level cross check Transport Type, DB Instance name, Service port, Authentication Type.
Template Usage Guidelines
- We have to use below syntax if those are instances
<instance1>:<port1>,<instance2>:<port2>,..etc - If it is a database then we can use below syntax
<database1>,<database2>,..etc.
Supported Metric
| Monitor Name | Metric Name | Metric Display Name | Unit | Description |
|---|---|---|---|---|
| G2-MSSQLDB-Agent Jobs Monitor | mssql_db_agentJobsStatus | MSSQL DB Agent Jobs Status | NULL | MSSQL DB Agent Jobs Status : This metric collects mssql agent job status latest information (in last 15mins only): Below are the possible status values - 0 : Failed 1 : Successful 2 : Retry 3 : Cancelled 4 : InProgress |
G2 MSSQL Database AlwaysOn Template - v2
Description
This template supports for both SQL and Windows Authentication. Integration is done through JDBC and MSSQL queries and tested in MSSQL v18.9.1.
Prerequisites
- The gateway version must be 14.0.0 or above.
- Database Credentials must be added on the end device.
- While applying template at device level cross check Transport Type, DB Instance name, Service port, Authentication Type.
Template Usage Guidelines
- We have to use below syntax if those are instances
<instance1>:<port1>,<instance2>:<port2>,..etc - If it is a database then we can use below syntax
<database1>,<database2>,..etc.
Supported Metric
| Monitor Name | Metric Name | Metric Display Name | Unit | Description |
|---|---|---|---|---|
| G2-MSSQLDB-AlwaysON Monitor | mssql_db_alwaysOn_AG_SynchronizationHealth | 8MSSQL AlwaysOn Availability Group Synchronization Health | NULL | MSSQL AlwaysOn Availability Group Synchronization Health - Below are the possible values: 0 : NOT_HEALTHY 1 : PARTIALLY_HEALTHY 2 : HEALTHY |
| mssql_db_alwaysOn_DBAvailability_SynchronizationHealth | MSSQL AlwaysOn DataBase Availability Synchronization Health | NULL | MSSQL AlwaysOn DataBase Availability Synchronization Health - Below are the possible states: 0 : NOT_HEALTHY 1 : PARTIALLY_HEALTHY 2 : HEALTHY | |
| mssql_db_alwaysOn_listener_state | MSSQL AlwaysOn Listener State | NULL | MSSQL AlwaysOn Listener State - Below are the possible values: 0 : OFFLINE 1 : ONLINE 2 : ONLINE_PENDING 3 : FAILED | |
| mssql_db_alwaysOn_agListener_ConsolidatedState | MSSQL DB AlwaysOn AGListener Consolidated State | NULL | Monitors MSSQL AlwaysOn Listener Consolidated State with same dnsName. If state = (0 - offline)/(2 - online pending)/(3 - Failed) as Critical and State = (1 - Online) as Ok |
G2 - MSSQL Database Availability SQL Server Authentication
Description
MSSQL DB Database Availability SQL Server Authentication Note: 1. Need to provide \ (backward slashes) instead of \ (single slash). If the SQLServerName contains DomainName\UserName needs to be provided like this DomainName\UserName 2. Add the credential set with this name SQL_credentials.
Prerequisites
End device SSH credentials need to be added on end device itself.
Supported Metric
| Monitor Name | Metric Name | Metric Display Name | Unit | Description | Permissions |
|---|---|---|---|---|---|
| G2 - MSSQL Database Availability SQL Server Authentication | mssql_db_database_availability_sql_auth | MSSQL DB Database Availability SQL Server Authentication | NULL | MSSQL DB Database Availability SQL Server Authentication Note: 1. Need to provide \\ (backward slashes) instead of \ (single slash). If the SQLServerName contains DomainName\UserName need to provide like this DomainName\\UserName. 2. Add the credential set with this name SQL_credentials. | SQL Server Authentication Permissions: The user must have CONNECT permissions on the SQL Server instance. SELECT permission for the master database and relevant system views (if needed) is required. VIEW SERVER STATE permission may be needed to allow the user to access certain server-level information. |
G2 MSSQL Database Backup Template
Description
This template supports for both SQL and Windows Authentication. Integration is done through JDBC and MSSQL queries and tested in MSSQL v18.9.1
Prerequisites
- The gateway version must be 14.0.0 or above.
- Database Credentials must be added on the end device.
- While applying template at device level cross check Transport Type, DB Instance name, Service port, Authentication Type.
Template Usage Guidelines
- We have to use below syntax if those are instances
<instance1>:<port1>,<instance2>:<port2>,..etc - If it is a database then we can use below syntax
<database1>,<database2>,..etc.
Supported Metric
| Monitor Name | Metric Name | Metric Display Name | Unit | Description |
|---|---|---|---|---|
| G2-MSSQLDB-Backup Monitor | mssql_db_backup_daysSinceLastDifferentialBackup | MSSQL DB Backup Days Since Last Differential Backup | Days | MSSQL DB Backup Days Since Last Differential Backup |
| mssql_db_backup_daysSinceLastFullBackup | MSSQL DB Backup Days Since Last Full Backup | Days | MSSQL DB Backup Days Since Last Full Backup | |
| mssql_db_backup_daysSinceLastLogBackup | MSSQL DB Backup Days Since Last Log Backup | Days | MSSQL DB Backup Days Since Last Log Backup |
G2 MSSQL Database Buffer Template - v2.0
Description
This template supports windows and SQL server authentication modes Integration is done through JDBC and SQL queries.
Prerequisites
- The gateway version must be 14.0.0 or above.
- Database Credentials must be added on the end device.
- While applying template at device level cross check Transport Type, DB Instance name, Service port, Authentication Type.
Template Usage Guidelines
- We have to use below syntax if those are instances
<instance1>:<port1>,<instance2>:<port2>,..etc - If it is a database then we can use below syntax
<database1>,<database2>,..etc.
Supported Metric
| Monitor Name | Metric Name | Metric Display Name | Unit | Description |
|---|---|---|---|---|
| G2 MSSQL Database Buffer Monitor - v2.0 | mssql.database.page.reads | Page reads | psec | Number of physical database page reads issued. |
| mssql.database.page.writes | Database Page writes | wps | Number of physical database page writes issued. | |
| mssql.buffer.lazy.writes | Buffer lazy writes | wps | Number of buffers written by buffer manager's lazy writer. | |
| mssql.checkpoint.pages | Checkpoint pages | psec | Indicates the number of pages flushed to disk per second by a checkpoint or other operation that require all dirty pages to be flushed. |
G2 MSSQL Database CPU Template
Description
This template supports for both SQL and Windows Authentication. Integration is done through JDBC and MSSQL queries and tested in MSSQL v18.9.1.
Prerequisites
- The gateway version must be 14.0.0 or above.
- Database Credentials must be added on the end device.
- While applying template at device level cross check Transport Type, DB Instance name, Service port, Authentication Type.
Template Usage Guidelines
- We have to use below syntax if those are instances
<instance1>:<port1>,<instance2>:<port2>,..etc - If it is a database then we can use below syntax
<database1>,<database2>,..etc.
Supported Metric
| Monitor Name | Metric Name | Metric Display Name | Unit | Description |
|---|---|---|---|---|
| G2-MSSQLDB-CPU Monitor | mssql_cpuIoBusy | MSSQL CPU I0Busy | microsec | MSSQL CPU IoBusy |
| mssql_cpuIdle | MSSQL CPU IDLE | microsec | MSSQL CPU IDLE | |
| mssql_cpuBusy | MSSQL CPU Busy | microsec | MSSQL CPU Busy |
G2 MSSQL Database Databases Template - v2.0
Description
This template supports windows and SQL server authentication modes Integration is done through JDBC and SQL queries.
Prerequisites
- The gateway version must be 14.0.0 or above.
- Database Credentials must be added on the end device.
- While applying template at device level cross check Transport Type, DB Instance name, Service port, Authentication Type.
Template Usage Guidelines
- We have to use below syntax if those are instances
<instance1>:<port1>,<instance2>:<port2>,..etc - If it is a database then we can use below syntax
<database1>,<database2>,..etc.
Supported Metric
| Monitor Name | Metric Name | Metric Display Name | Unit | Description |
|---|---|---|---|---|
| G2 MSSQL Database Databases Monitor - v2.0 | mssql.log.flushes | Log Flushes | psec | The number of log flushes. |
| mssql.db.transactions | Db transactions | psec | The number of transactions started for the database. | |
| mssql.db.data.file.size | Data File Size | KB | The cumulative size of all the data files in the database. | |
| mssql.lock.deadlocks | Deadlocks | psec | The number of lock requests that resulted in a deadlock. |
G2 MSSQL Database General Statistics Template - v2.0
Description
This template supports windows and SQL server authentication modes Integration is done through JDBC and SQL queries.
Prerequisites
- The gateway version must be 14.0.0 or above.
- Database Credentials must be added on the end device.
- While applying template at device level cross check Transport Type, DB Instance name, Service port, Authentication Type.
Template Usage Guidelines
- We have to use below syntax if those are instances
<instance1>:<port1>,<instance2>:<port2>,..etc - If it is a database then we can use below syntax
<database1>,<database2>,..etc.
Supported Metric
| Monitor Name | Metric Name | Metric Display Name | Unit | Description |
|---|---|---|---|---|
| G2 MSSQL Database General Statistics Monitor - v2.0 | mssql.user.connections | User connections | NULL | The number of users connected to the system. |
| mssql.blocked.process | Blocked processes | NULL | The number of currently blocked processes. |
G2 MSSQL Database Latches Template - v2.0
Description
This template supports windows and SQL server authentication modes Integration is done through JDBC and SQL queries.
Prerequisites
- The gateway version must be 14.0.0 or above.
- Database Credentials must be added on the end device.
- While applying template at device level cross check Transport Type, DB Instance name, Service port, Authentication Type.
Template Usage Guidelines
- We have to use below syntax if those are instances
<instance1>:<port1>,<instance2>:<port2>,..etc - If it is a database then we can use below syntax
<database1>,<database2>,..etc.
Supported Metric
| Monitor Name | Metric Name | Metric Display Name | Unit | Description |
|---|---|---|---|---|
| G2 MSSQL Database Latches Monitor - v2.0 | mssql.latch.waits | Latch waits | psec | Number of latch requests that could not be granted immediately and had to wait before being granted. |
G2 MSSQL Database Locks Template - v2.0
Description
This template supports windows and SQL server authentication modes Integration is done through JDBC and SQL queries.
Prerequisites
- The gateway version must be 14.0.0 or above.
- Database Credentials must be added on the end device.
- While applying template at device level cross check Transport Type, DB Instance name, Service port, Authentication Type.
Template Usage Guidelines
- We have to use below syntax if those are instances
<instance1>:<port1>,<instance2>:<port2>,..etc - If it is a database then we can use below syntax
<database1>,<database2>,..etc.
Supported Metric
| Monitor Name | Metric Name | Metric Display Name | Unit | Description |
|---|---|---|---|---|
| G2 MSSQL Database Locks Monitor - v2.0 | mssql.lock.waits | Lock waits | psec | Number of lock requests that could not be satisfied immediately and required the caller to wait before being granted the lock. |
| mssql.avg.lock.wait.time | Average lock wait time | ms | The average amount of wait time (milliseconds) for each lock request that resulted in a wait. | |
| mssql.lock.timeouts | Lock timeouts | psec | Number of lock requests that timed out. This includes requests for no wait locks. |
G2 MSSQL Database Memory Manager Template - v2.0
Description
This template supports windows and SQL server authentication modes Integration is done through JDBC and SQL queries.
Prerequisites
- The gateway version must be 14.0.0 or above.
- Database Credentials must be added on the end device.
- While applying template at device level cross check Transport Type, DB Instance name, Service port, Authentication Type.
Template Usage Guidelines
- We have to use below syntax if those are instances
<instance1>:<port1>,<instance2>:<port2>,..etc - If it is a database then we can use below syntax
<database1>,<database2>,..etc.
Supported Metric
| Monitor Name | Metric Name | Metric Display Name | Unit | Description |
|---|---|---|---|---|
| G2 MSSQL Database Memory Manager Monitor - v2.0 | mssql.total.server.memory | Total server memory | KB | Total amount of dynamic memory the server is currently consuming |
| mssql.memory.grants.pending | Memory Grants Pending | NULL | Current number of processes waiting for a workspace memory grant | |
| mssql.database.cache.memory | Database cache memory | KB | Amount of memory the server is currently using for the database cache. | |
| mssql.connection.memory | Connection Memory | KB | Total amount of dynamic memory the server is using for maintaining connections. | |
| mssql.lock.memory | Lock Memory | KB | Total amount of dynamic memory the server is using for locks | |
| mssql.free.memory | Free Memory | KB | Amount of memory the server is currently not using. | |
| mssql.sql.cache.memory | SQL Cache Memory | KB | Total amount of dynamic memory the server is using for the dynamic SQL cache | |
| mssql.optimizer.memory | Optimizer Memory | KB | Total amount of dynamic memory the server is using for query optimization |
G2 MSSQL Database Miscellaneous Template - v2.0
Description
This template supports windows and SQL server authentication modes Integration is done through JDBC and SQL queries.
Prerequisites
- The gateway version must be 14.0.0 or above.
- Database Credentials must be added on the end device.
- While applying template at device level cross check Transport Type, DB Instance name, Service port, Authentication Type.
Template Usage Guidelines
- We have to use below syntax if those are instances
<instance1>:<port1>,<instance2>:<port2>,..etc - If it is a database then we can use below syntax
<database1>,<database2>,..etc.
Supported Metric
| Monitor Name | Metric Name | Metric Display Name | Unit | Description |
|---|---|---|---|---|
| G2 MSSQL Database Miscellaneous Monitor - v2.0 | msql.last.elapsed.time | Last elapsed time | microsec | Elapsed time,reported in microseconds (but only accurate to milliseconds),for the most recently completed execution of this plan. |
| mssql.buffer.cache.hit.ratio | Buffer cache hit ratio | None | Percentage of pages that were found in the buffer pool without having to incur a read from disk. | |
| mssql.procedure.cache.hit.ratio | Procedure Cache Hit Ratio | NULL | Procedure Cache Hit ratio (calculated from server start-up) | |
| mssql.page.life.expectancy | MSSQL PageLifeExpectancy | s | Number of seconds a page will stay in the buffer pool without references. |
G2 MSSQL Database Resource pool Stats Template - v2.0
Description
This template supports windows and SQL server authentication modes Integration is done through JDBC and SQL queries.
Prerequisites
- The gateway version must be 14.0.0 or above.
- Database Credentials must be added on the end device.
- While applying template at device level cross check Transport Type, DB Instance name, Service port, Authentication Type.
Template Usage Guidelines
- We have to use below syntax if those are instances
<instance1>:<port1>,<instance2>:<port2>,..etc - If it is a database then we can use below syntax
<database1>,<database2>,..etc.
Supported Metric
| Monitor Name | Metric Name | Metric Display Name | Unit | Description |
|---|---|---|---|---|
| G2 MSSQL Database Resource pool Stats Monitor - v2.0 | mssql.resource.pool.used.memory | Resource pool used memory | KB | The amount of memory used,in kilobytes (KB),for the resource pool. |
| mssql.resource.pool.disk.read.io | Resource pool disk read IO | rops | Number of read operations from the disk in the last second. | |
| mssql.resource.pool.disk.write.io | Resource pool disk write IO | wps | Number of bytes written to the disk in the last second. |
G2 MSSQL Database SQL Statistics Template - v2.0
Description
This template supports windows and SQL server authentication modes Integration is done through JDBC and SQL queries.
Prerequisites
- The gateway version must be 14.0.0 or above.
- Database Credentials must be added on the end device.
- While applying template at device level cross check Transport Type, DB Instance name, Service port, Authentication Type.
Template Usage Guidelines
- We have to use below syntax if those are instances
<instance1>:<port1>,<instance2>:<port2>,..etc - If it is a database then we can use below syntax
<database1>,<database2>,..etc.
Supported Metric
| Monitor Name | Metric Name | Metric Display Name | Unit | Description |
|---|---|---|---|---|
| G2 MSSQL Database SQL Statistics Monitor - v2.0 | mssql.batch.requests | Batch requests | psec | Number of SQL batch requests received by server. |
| mssql.sql.compilations | Sql compilations | psec | Number of SQL compilations. | |
| msql.sql.recompilations | Sql recompilations | psec | Number of statement recompiles per second. Counts the number of times statement recompiles are triggered. Generally,you want the recompiles to be low. |
G2 MSSQL Database Transactions Time Template - v3
Description
This template supports windows and SQL server authentication modes Integration is done through JDBC and SQL queries Prerequisites :
Prerequisites
Requires Gateway 7.0.0 and above, SQL Server 2008 and above. In this version of template we have corrected the query for this metric “mssql.longest.transaction time”.
Supported Metric
| Monitor Name | Metric Name | Metric Display Name | Unit | Description |
|---|---|---|---|---|
| G2 MSSQL Database Transactions Monitor - v3 | mssql.longest.transaction time | Longest transaction time | s | The length of time (in seconds) since the start of the transaction that has been active longer than any other current transaction. This counter only shows activity when the database is under read committed snapshot isolation level. It does not log any activity if the database is in any other isolation level. |
G2 MSSQL Database Transactions Time Template - v2.0
Description
This template supports windows and SQL server authentication modes Integration is done through JDBC and SQL queries.
Prerequisites
- The gateway version must be 14.0.0 or above.
- Database Credentials must be added on the end device.
- While applying template at device level cross check Transport Type, DB Instance name, Service port, Authentication Type.
Template Usage Guidelines
- We have to use the following syntax if those are instances
<instance1>:<port1>,<instance2>:<port2>,..etc - If it is a database then we can use the following syntax
<database1>,<database2>,..etc.
Supported Metric
| Monitor Name | Metric Name | Metric Display Name | Unit | Description |
|---|---|---|---|---|
| G2 MSSQL Database Transactions Monitor - v2.0 | mssql.longest.transaction time | Longest transaction time | s | The length of time (in seconds) since the start of the transaction that has been active longer than any other current transaction. This counter only shows activity when the database is under read committed snapshot isolation level. It does not log any activity if the database is in any other isolation level. |
G2 - MSSQL Database Monitoring - v5
Description
Monitors MSSQL Database metrics like mssql.avg.lock.wait.time,mssql.buffer.cache.hit.ratio,mssql.sql.cache.memory,mssql.db.data.file.size,mssql_db_databases_count,mssql.full.scans,mssql.database.page.reads,mssql.database.page.writes,mssql_server_uptime,mssql.total.server.memory,mssql.db.transactions,mssql_db_database_status,mssql_db_database_active_users,mssql_db_database_datafiles_freespace,mssql_db_database_freespace,mssql_db_database_log_cachehit_ratio,mssql_db_database_logfiles_freespace. In this version, the object name is corrected as"msdb.dbo.sysjobs" in ‘G2-MSSQLDB-Agent Jobs Monitor - v2’ monitor.
Prerequisites
- The gateway version must be 14.0.0 or above.
- Database Credentials must be added on the end device.
- While applying template at device level cross check Transport Type, DB Instance name, Service port, Authentication Type.
Template Usage Guidelines
- We have to use the following syntax if those are instances
<instance1>:<port1>,<instance2>:<port2>,..etc - If it is a database then we can use the following syntax
<database1>,<database2>,..etc.
Supported Metric
| Monitor Name | Metric Name | Metric Display Name | Unit | Description |
|---|---|---|---|---|
| G2 - MSSQL Database Monitoring - v4 | mssql.avg.lock.wait.time | Average lock wait time | ms | The average amount of wait time (milliseconds) for each lock request that resulted in a wait. |
| mssql.buffer.cache.hit.ratio | Buffer cache hit ratio | % | Pages that were found in the buffer pool without having to incur a read from disk. | |
| mssql.sql.cache.memory | SQL Cache Memory | KB | Total amount of dynamic memory the server is using for the dynamic SQL cache | |
| mssql.db.data.file.size | Data File Size | KB | The cumulative size of all the data files in the database. | |
| mssql_db_database_active_users | MSSQL Database Active Users | count | Monitors the number of active user transactions per database | |
| mssql_db_database_freespace | MSSQL Database Freespace | % | Monitors Database Freespace in Percentage | |
| mssql_db_database_log_cachehit_ratio | MSSQL Database Log CacheHit Ratio | % | Monitors MSSQL database log cache-hit ratio | |
| mssql.db.transactions | Db transactions | psec | The number of transactions started for the database. | |
| mssql.total.server.memory | Total server memory | KB | Total amount of dynamic memory the server is currently consuming | |
| mssql.database.page.writes | Database Page writes | wps | Number of physical database page writes issued. | |
| mssql.database.page.reads | Page reads | psec | Number of physical database page reads issued. | |
| mssql.full.scans | Full scans | psec | Number of unrestricted full scans. These can either be base table or full index scans. | |
| mssql_db_databases_count | MSSQL DB Databases Count | count | Show the count of total number of databases | |
| mssql_server_uptime | MSSQL Server Uptime | Days | Monitors the uptime (in days) of the database server | |
| mssql_db_database_status | MSSQ DB Database Status | 0 = ONLINE 1 = RESTORING 2 = RECOVERING SQL Server 2008 and later 3 = RECOVERY_PENDING SQL Server 2008 and later 4 = SUSPECT 5 = EMERGENCY SQL Server 2008 and later 6 = OFFLINE SQL Server 2008 and later 7 = COPYING Azure SQL Database Active Geo-Replication 10 = OFFLINE_SECONDARY Azure SQL Database Active Geo-Replication | ||
| mssql_db_database_logfiles_freespace | MSSQL database LogFiles Freespace | % | Monitors MSSQL database LogFiles free space | |
| mssql_db_database_datafiles_freespace | MSSQL Database DataFiles FreeSpace | % | Monitors datafiles free space regardless of auto-growth | |
| mssql_buffer_cache_hit_ratio_percent | Buffer cache hit ratio in Percentage | Percentage of pages that were found in the buffer pool without having to incur a read from disk. | ||
| G2 - MSSQL Database Backup Status - v2 | mssql_db_minutesSinceLastTransaction_log_backup | MSSQL DB Minutes Since Last Transaction Log Backup | m | Monitors Database transaction log backup in minutes |
| mssql_db_backup_minutesSinceLastFullBackup | MSSQL Database Backup status in minutes since Last Full Backup | m | Monitors Database Backup status in Minutes since Last Full Backup | |
| G2-MSSQLDB-Agent Jobs Monitor - v2 | mssql_db_agentJobsStatus | MSSQL DB Agent Jobs Status | MSSQL DB Agent Jobs Status : This metric collects mssql agent job status latest information (in last 15mins only): Below are the possible status values - 0 : Failed 1 : Successful 2 : Retry 3 : Cancelled 4 : InProgress |
G2 - MSSQL Database Monitoring - v4
Description
Monitors MSSQL Database metrics like mssql.avg.lock.wait.time,mssql.buffer.cache.hit.ratio,mssql.sql.cache.memory,mssql.db.data.file.size,mssql_db_databases_count,mssql.full.scans,mssql.database.page.reads,mssql.database.page.writes,mssql_server_uptime,mssql.total.server.memory,mssql.db.transactions,mssql_db_database_status,mssql_db_database_active_users,mssql_db_database_datafiles_freespace,mssql_db_database_freespace,mssql_db_database_log_cachehit_ratio,mssql_db_database_logfiles_freespace
Prerequisites
- The gateway version must be 14.0.0 or above.
- Database Credentials must be added on the end device.
- While applying template at device level cross check Transport Type, DB Instance name, Service port, Authentication Type.
Template Usage Guidelines
- We have to use below syntax if those are instances
<instance1>:<port1>,<instance2>:<port2>,..etc - If it is a database then we can use below syntax
<database1>,<database2>,..etc.
Supported Metric
| Monitor Name | Metric Name | Metric Display Name | Unit | Description |
|---|---|---|---|---|
| G2 - MSSQL Database Backup Status - v2 | mssql_db_backup_minutesSinceLastFullBackup | MSSQL Database Backup status in minutes since Last Full Backup | m | Monitors Database Backup status in Minutes since Last Full Backup |
| vmssql_db_minutesSinceLastTransaction_log_backup | MSSQL DB Minutes Since Last Transaction Log Backup | m | Monitors Database transaction log backup in minutes | |
| G2 - MSSQL Database Monitoring - v4 | mssql.database.page.writes | Database Page writes | wps | Number of physical database page writes issued. |
| mssql.sql.cache.memory | SQL Cache Memory | KB | Total amount of dynamic memory the server is using for the dynamic SQL cache | |
| mssql_db_database_logfiles_freespace | MSSQL database LogFiles Freespace | % | Monitors MSSQL database LogFiles free space | |
| mssql.db.transactions | Db transactions | psec | The number of transactions started for the database. | |
| mssql.avg.lock.wait.time | Average lock wait time | ms | The average amount of wait time (milliseconds) for each lock request that resulted in a wait. | |
| mssql_db_database_status | MSSQ DB Database Status | NULL | 0 = ONLINE 1 = RESTORING 2 = RECOVERING SQL Server 2008 and later 3 = RECOVERY_PENDING SQL Server 2008 and later 4 = SUSPECT 5 = EMERGENCY SQL Server 2008 and later 6 = OFFLINE SQL Server 2008 and later 7 = COPYING Azure SQL Database Active Geo-Replication 10 = OFFLINE_SECONDARY Azure SQL Database Active Geo-Replication | |
| mssql.database.page.reads | Page reads | psec | Number of physical database page reads issued. | |
| mssql_db_databases_count | MSSQL DB Databases Count | count | Show the count of total number of databases | |
| mssql.buffer.cache.hit.ratio | Buffer cache hit ratio | None | Percentage of pages that were found in the buffer pool without having to incur a read from disk. | |
| mssql_db_database_freespace | MSSQL Database Freespace | % | Monitors Database Freespace in Percentage | |
| mssql_server_uptime | MSSQL Server Uptime | Days | Monitors the uptime (in days) of the database server | |
| mssql.total.server.memory | Total server memory | KB | Total amount of dynamic memory the server is currently consuming | |
| mssql_db_database_datafiles_freespace | MSSQL Database DataFiles FreeSpace | % | Monitors datafiles free space regardless of auto-growth | |
| mssql_db_database_active_users | MSSQL Database Active Users | count | Monitors the number of active user transactions per database. | |
| mssql_db_database_log_cachehit_ratio | MSSQL Database Log CacheHit Ratio | % | Monitors MSSQL database log cache-hit ratio | |
| mssql.db.data.file.size | Data File Size | KB | The cumulative size of all the data files in the database. | |
| mssql.full.scans | Full scans | psec | Number of unrestricted full scans. These can either be base table or full index scans. | |
| mssql_buffer_cache_hit_ratio_percent | Buffer cache hit ratio in Percentage | NULL | Percentage of pages that were found in the buffer pool without having to incur a read from disk. | |
| G2-MSSQLDB-Agent Jobs Monitor | mssql_db_agentJobsStatus | MSSQL DB Agent Jobs Status | NULL | MSSQL DB Agent Jobs Status : This metric collects mssql agent job status latest information (in last 15mins only): Below are the possible status values - 0 : Failed 1 : Successful 2 : Retry 3 : Cancelled 4 : InProgress |
G2 - MSSQL DB Filegroup Freespace - v2
Description
G2 - MSSQL DB Filegroup Freespace
Prerequisites
- The gateway version must be 14.0.0 or above.
- Database Credentials must be added on the end device.
- While applying template at device level cross check Transport Type, DB Instance name, Service port, Authentication Type.
Template Usage Guidelines
- We have to use below syntax if those are instances
<instance1>:<port1>,<instance2>:<port2>,..etc - If it is a database then we can use below syntax
<database1>,<database2>,..etc.
- If it is a database then we can use below syntax
Supported Metric
| Monitor Name | Metric Name | Metric Display Name | Unit | Description |
|---|---|---|---|---|
| G2 - MSSQL DB Filegroup Freespace - v2 | mssql_db_filegroup_freespace_with_available_disk | MSSQL DB Filegroup Freespace with Available Disk | % | Monitor MSSQL DB Filegroup Freespace with Available Disk |
| mssql_db_filegroup_freespace | MSSQL DB Filegroup Freespace | % | Monitors MSSQL DB Filegroup Freespace |
G2 - MSSQL DB Instance CPU Utilization - v2
Description
G2 - MSSQL DB Instance CPU Utilization
Prerequisites
- The gateway version must be 14.0.0 or above.
- Database Credentials must be added on the end device.
- While applying template at device level cross check Transport Type, DB Instance name, Service port, Authentication Type.
Template Usage Guidelines
- We have to use below syntax if those are instances
<instance1>:<port1>,<instance2>:<port2>,..etc - If it is a database then we can use below syntax
<database1>,<database2>,..etc.
Supported Metric
| Monitor Name | Metric Name | Metric Display Name | Unit | Description |
|---|---|---|---|---|
| G2 - MSSQL DB Instance CPU Utilization - v2 | mssql_db_instance_cpu_utilization | MSSQL Database Instance CPU Utilization | % | Monitors MSSQL Database Instance CPU Utilization in percentage |
G2 - MSSQL DB Instance Free Connections - v2
Description
G2 - MSSQL DB Instance Free Connections
Prerequisites
- The gateway version must be 14.0.0 or above.
- Database Credentials must be added on the end device.
- While applying template at device level cross check Transport Type, DB Instance name, Service port, Authentication Type.
Template Usage Guidelines
- We have to use below syntax if those are instances
<instance1>:<port1>,<instance2>:<port2>,..etc - If it is a database then we can use below syntax
<database1>,<database2>,..etc.
Supported Metric
| Monitor Name | Metric Name | Metric Display Name | Unit | Description |
|---|---|---|---|---|
| G2 - MSSQL DB Instance Free Connections - v2 | mssql_db_instance_free_connections | MSSQL Database Instance Free Connections | % | Monitors MSSQL Database Instance Free Connections in percentage |
G2 - MSSQL DB LogFile Freespace with Available Disk - v2
Description
G2 - MSSQL DB LogFile Freespace with Available Disk
Prerequisites
- The gateway version must be 14.0.0 or above.
- Database Credentials must be added on the end device.
- While applying template at device level cross check Transport Type, DB Instance name, Service port, Authentication Type.
Template Usage Guidelines
- We have to use below syntax if those are instances
<instance1>:<port1>,<instance2>:<port2>,..etc - If it is a database then we can use below syntax
<database1>,<database2>,..etc.
Supported Metric
| Monitor Name | Metric Name | Metric Display Name | Unit | Description |
|---|---|---|---|---|
| G2 - MSSQL DB LogFile Freespace with Available Disk - v2 | mssql_db_logfile_freespace_with_available_disk | MSSQL DB Logfile Freespace with Available Disk | % | Monitors MSSQL DB Logfile Freespace with Available Disk in percentage |
G2 - MSSQL DB Long Running Queries - v2
Description
G2 - MSSQL DB Long Running Queries
Prerequisites
- The gateway version must be 14.0.0 or above.
- Database Credentials must be added on the end device.
- While applying template at device level cross check Transport Type, DB Instance name, Service port, Authentication Type.
Template Usage Guidelines
- We have to use below syntax if those are instances
<instance1>:<port1>,<instance2>:<port2>,..etc - If it is a database then we can use below syntax
<database1>,<database2>,..etc.
Supported Metric
| Monitor Name | Metric Name | Metric Display Name | Unit | Description |
|---|---|---|---|---|
| G2 - MSSQL DB Long Running Queries - v2 | mssql_db_long_running_queries_last_5min | MSSQL Database Long Running queries Last 5 minutes | count | Monitors MSSQL Database Long Running queries count Last 5 minutes |
G2 - MSSQL DB Server IO Busy - v2
Description
G2 - MSSQL DB Server IO Busy
Prerequisites
- The gateway version must be 14.0.0 or above.
- Database Credentials must be added on the end device.
- While applying template at device level cross check Transport Type, DB Instance name, Service port, Authentication Type.
Template Usage Guidelines
- We have to use below syntax if those are instances
<instance1>:<port1>,<instance2>:<port2>,..etc - If it is a database then we can use below syntax
<database1>,<database2>,..etc.
Supported Metric
| Monitor Name | Metric Name | Metric Display Name | Unit | Description |
|---|---|---|---|---|
| G2 - MSSQL DB Server IO Busy - v2 | mssql_db_server_IO_busy | MSSQL DB Server IO Busy | % | Monitors MSSQL DB Server IO Busy |
G2 - MSSQL DB WorkSpace Memory - v2
Description
G2 - MSSQL DB WorkSpace Memory
Prerequisites
- The gateway version must be 14.0.0 or above.
- Database Credentials must be added on the end device.
- While applying template at device level cross check Transport Type, DB Instance name, Service port, Authentication Type.
Template Usage Guidelines
- We have to use below syntax if those are instances
<instance1>:<port1>,<instance2>:<port2>,..etc - If it is a database then we can use below syntax
<database1>,<database2>,..etc.
Supported Metric
| Monitor Name | Metric Name | Metric Display Name | Unit | Description |
|---|---|---|---|---|
| G2 - MSSQL DB WorkSpace Memory - v2 | mssql_db_workspace_memory | MSSQL Database Workspace Memory Percentage | % | Monitors MSSQL Database Workspace Memory in Percentage |
G2-PostgresDB-Replication Running Status - v2
Description
Tested in PostgreSQL 10 and 11. Checks if replication is running. This template applies only on master.
Prerequisite
- Gateway 7.0.0 and above.
- Create a Postgres environment file and provide the file path as input parameter while applying the template. Note: Along with setting up postgres environment this env file should contain other parameters like PGDATABASE and PGPORT.
- Add Postgres database credentials with credential set name “PostgresDB_Credentials”.
Supported Metrics
| Monitor Name | Metric Name | Metric Display Name | Unit | Description |
|---|---|---|---|---|
| G2-PostgresDB-Replication RSE Based Monitor - v2 | postgres_database_replication_running_status | Postgres Database Replication Running Status | Postgres database replication – replication status - replication on/off Possible Status values: ON - 1, OFF - 0 | |
| postgres_database_isInstanceStandby | Postgres Database Is Instance Standby | Check if Postgres database instance is standby or not 0 - Not Standby , 1 - Standby |
G2-PostgresDB-Replication - v2
Description
Integration is done through JDBC and SQL queries and tested in Postgresql-10 and 11 version.
Prerequisite
Gateway 10.0.0 and above.
Note: If needed to apply template on multiple instances on postgresql server, put “postgresql.multiinstance.flag” flag as true.
Supported Metrics
| Monitor Name | Metric Name | Metric Display Name | Unit | Description |
|---|---|---|---|---|
| G2-PostgresDB-Replication Query Based Monitor - v2 | postgres_database_replication_lag_sec | Postgres Database Replication Lag In Seconds | s | Replication lag in seconds |
| postgres_database_replication_sendlag_bytes | Postgres Database Replication Sending Lag In Bytes | Bytes | Sending lag in bytes | |
| postgres_database_replication_receivelag_bytes | Postgres Database Replication Receiving Lag In Bytes | Bytes | Receiving lag in bytes | |
| postgres_database_replication_replaylag_bytes | Postgres Database Replication Replay Lag In Bytes | Bytes | Replay lag in bytes | |
| postgres_database_replication_totallag_bytes | Postgres Database Replication Total Lag In Bytes | Bytes | Total replication lag in bytes | |
| postgres_database_wal_sender_state | Postgres Database Wal Sender State | WAL sender states: startup (1), catchup (2), streaming (3), backup (4), stopping (5) |
G2-PostgresDB-PerformanceQueries - v2
Description
Integration is done through JDBC and SQL queries and tested in Postgresql-10 and 11 version.
Prerequisite
Gateway 10.0.0 and above.
Note: If needed to apply template on multiple instances on postgresql server, put “postgresql.multiinstance.flag” flag as true.
Supported Metrics
| Monitor Name | Metric Name | Metric Display Name | Unit | Description |
|---|---|---|---|---|
| G2-PostgresDB-Performance Query Based Monitor - v2 | postgres_database_backend_connections_percentage | Postgres Database Backend Connections Percentage | % | Backend connections relative to max_connections setting |
| postgres_database_transaction_wraparound | Postgres Database Transaction Wraparound | Transaction wraparound value compared to defined thresholds | ||
| postgres_database_walsegment_count | Postgres Database Walsegment Count | count | WAL segment count compared to defined thresholds | |
| postgres_database_total_backend_connections_percentage | Postgres Database Total Backend Connections Percentage | % | Total backend connections relative to max_connections setting |
G2-PostgresDB-Performance - v2
Description
This template tested on PostgreSQL-10 and 11 version.
Prerequisite
- Gateway 10.0.0 and above.
- Create a Postgres environment file and provide the file absolute path as input parameter, before applying the template.
Template Usage Guidlines
- Create a Postgres environment file and provide the file absolute path as input parameter, before applying the template.
- We need to provide env file for single instance only - <env file>
- Sample Input Parameters: /home/test/pg_new_5432.env
- Along with setting up postgres environment,this environment file should contain other parameters like PGDATABASE,PGARCHIVEDIR,PGDATADIR,PGWALDIR,PGPORT,SERVICENAME.
- Sample pg_new_5432.env file data:
export PATH=$PATH:/usr/pgsql-12/bin/ PGDATABASE=postgres PGPORT=5432 PGARCHIVEDIR=/var/lib/pgsql/backups_main/archive/ PGDATADIR=/var/lib/pgsql/12/data PGWALDIR=/var/lib/pgsql/12/data/pg_wal SERVICENAME=postgresql-12
- This Environment file must have execute permissions.
Supported Metrics
| Monitor Name | Metric Name | Metric Display Name | Unit | Description |
|---|---|---|---|---|
| G2-PostgresDB-Performance Monitor - v2 | postgres_database_archivelog_disk_utilization | Postgres Database ArchiveLog Disk Utilization | % | Disk usage of archive-log volumes |
| postgres_database_disk_utilization | Postgres Database Disk Utilization | % | Total database disk usage | |
| postgres_database_walfiles_disk_utilization | Postgres Database WalFiles Disk Utilization | % | Disk usage of WAL files | |
| G2-PostgresDB-Instance Status Monitor - v2 | postgres_database_instance_status | Postgres Database Instance Status | Instance status - 1 means "UP", 0 means "DOWN" |
G2 PostgreSQL Activity Long Transactions Template-MultiInstance
Description
G2 PostgreSQL Activity Long Transactions Template-MultiInstance
No prerequisite
Supported Metric
| Monitor Name | Metric Name | Metric Display Name | Unit | Description |
|---|---|---|---|---|
| G2 PostgreSQL Activity Long Transactions Monitor-MultiInstance | postgresql.activity.long.transactions | PostgreSQL Activity Long Transactions | h | Monitors PostgreSQL activity long transactions in hours. |
G2 PostgreSQL Database Blockhits Template
Description
G2 PostgreSQL Database Blockhits Template
Prerequisites
No prerequisite
Supported Metric
| Monitor Name | Metric Name | Metric Display Name | Unit | Description |
|---|---|---|---|---|
| Advanced Cloud PostgreSQL Database BlockHits Monitor | postgresql.statiotables.toastblkshit | Postgresql Statio Tables Toast Blks Hit | NULL | Number of buffer hits in this table's TOAST table (if any). |
| postgresql.statiotables.idxblkshit | Postgresql Statio Tables Idx Blks Hit | count | Number of buffer hits in all indexes on this table. | |
| postgresql.database.blkshit | Postgresql Database Blocks Hits | NULL | Number of times disk blocks were found already in the buffer cache,so that a read was not necessary (this only includes hits in the PostgreSQL buffer cache,not the operating system's file system cache). | |
| postgresql.statioindexes.bufferhits | Postgresql Statio Indexes Buffer Hits | NULL | Number of buffer hits in this index. |
G2 - PostgreSQL Instance Health Check
Description
Monitors the availability status of multiple PostgreSQL instances as available (1) or unavailable (0). In version 3 of the template, we extended monitoring capabilities, to monitor availability status across multiple PostgreSQL instances.
Template Usage Guidelines
Provide comma separated list of PostgreSQL environment files as input.Example: /var/lib/pgsql/pg_env_5432.env,/var/lib/pgsql/pg_env_5433.envSample pg_env_5432.env file data:export PATH=$PATH:/usr/pgsql-12/bin/PGPORT=5432SERVICENAME=postgresql-12
This Environment file must have execute permissions.
Prerequisites
- SSH credentials needs to be assigned on end device.
- Gateway 14 and above.
- Create a Postgres environment file and provide the file absolute path as input parameter, prior to applying the template.
Supported Metric
| Monitor Name | Metric Name | Metric Display Name | Unit | Description |
|---|---|---|---|---|
| G2 - PostgreSQL Instance Health Check | postgres_database_instance_status | Postgres Database Instance Status | NULL | Postgres database instance status - 1 means "UP" & 0 means "DOWN". |
G2 - PostgreSQL Disk Utilization
Description
Monitors the disk utilization of PostgreSQL instances, for Database data directory, WAL files directory, Archive log directory. In version 3 of the template, we extended monitoring capabilities, to monitor disk utilization metrics across multiple PostgreSQL instances.
Template Usage Guidelines
Provide comma separated list of PostgreSQL environment files as input.Example: /var/lib/pgsql/pg_env_5432.env,/var/lib/pgsql/pg_env_5433.envSample pg_env_5432.env file data:export PATH=$PATH:/usr/pgsql-12/bin/PGPORT=5432SERVICENAME=postgresql-12PGARCHIVEDIR=/var/lib/pgsql/backups_main/archive/PGDATADIR=/var/lib/pgsql/12/dataPGWALDIR=/var/lib/pgsql/12/data/pg_wal
This Environment file must have execute permissions.User must provide atleast one of PGARCHIVEDIR or PGDATADIR or PGWALDIR for monitor to collect data.
Prerequisites
- SSH credentials needs to be assigned on end device.
- Gateway 14 and above.
- Create a Postgres environment file and provide the file absolute path as input parameter, prior to applying the template.
Supported Metric
| Monitor Name | Metric Name | Metric Display Name | Unit | Description |
|---|---|---|---|---|
| G2 - PostgreSQL Disk Utilization | postgres_database_archivelog_disk_utilization | Postgres Database ArchiveLog Disk Utilization | % | Postgres disk utilization of archive-logs disks - percent relative to the disk space used. |
| postgres_database_disk_utilization | Postgres Database Disk Utilization | % | Postgres disk utilization of the database - percent relative to the disk space used. | |
| postgres_database_walfiles_disk_utilization | Postgres Database WalFiles Disk Utilization | % | Postgres disk utilization of transaction-logs (wal-files) - percent relative to the disk space used. |
G2 PostgreSQL Database Blockhits Template-MultiInstance - v2
Description
Monitors Postgres DB agent metrics like postgresql.statiotables.toastblkshit,postgresql.statiotables.idxblkshit…..
Prerequisites
NULL
Supported Metric
| Monitor Name | Metric Name | Metric Display Name | Unit | Description |
|---|---|---|---|---|
| Advanced Cloud PostgreSQL Database BlockHits Monitor-MultiInstance - v2 | postgresql.statiotables.toastblkshit | Postgresql Statio Tables Toast Blks Hit | NULL | Number of buffer hits in this table's TOAST table (if any). |
| postgresql.statiotables.idxblkshit | Postgresql Statio Tables Idx Blks Hit | count | Number of buffer hits in all indexes on this table. | |
| postgresql.database.blkshit | Postgresql Database Blocks Hits | NULL | Number of times disk blocks were found already in the buffer cache,so that a read was not necessary (this only includes hits in the PostgreSQL buffer cache,not the operating system's file system cache). | |
| postgresql.statioindexes.bufferhits | Postgresql Statio Indexes Buffer Hits | NULL | Number of buffer hits in this index. |
G2 PostgreSQL Database Connection Statistics Template - v2
Description
Monitors the PostgreSQL database connection statistics including active connections, connection utilization ratio, maximum allowed connections, and user table metrics such as table count and row count across schemas. In version 3 of the template, the database connection queries were updated to remove the hardcoded database name filter, enabling monitoring across all databases and additionally, the rows count query was corrected to return actual row estimates instead of table counts.
Prerequisites
No prerequisite
Supported Metrics
| Monitor Name | Metric Name | Metric Display Name | Unit | Metric Category | Metric Description |
|---|---|---|---|---|---|
| G2 PostgreSQL Database Connection Statistics Monitor - v2 | postgresql.database.connections | Postgresql Database Connections | null | null | The number of active connections to postgres database. |
| postgresql.user_tables.rows_count | Postgresql User Tables Rows Count | count | null | number of rows scans | |
| postgresql.max_connections | Postgresql Max Connections | null | null | The maximum number of client connections allowed to this database.shown as connection | |
| postgresql.user.table.count | User Table Count | null | null | It monitors the number of user tables in current database. | |
| postgresql.settings.connection | Postgresql Settings Connections | null | null | The number of connections to this database as a fraction of the maximum number of allowed connections. |
G2 PostgreSQL Database Connection Statistics Template
Description
G2 PostgreSQL Database Connection Statistics Template
Prerequisites
No prerequisite
Supported Metric
| Monitor Name | Metric Name | Metric Display Name | Unit | Description |
|---|---|---|---|---|
| G2 PostgreSQL Database Connection Statistics Monitor | postgresql.database.connections | Postgresql Database Connections | NULL | The number of active connections to postgres database. |
| postgresql.settings.connection | Postgresql Settings Connections | NULL | The number of connections to this database as a fraction of the maximum number of allowed connections. | |
| postgresql.user_tables.rows_count | Postgresql User Tables Rows Count | count | number of rows scans | |
| postgresql.max_connections | Postgresql Max Connections | NULL | The maximum number of client connections allowed to this database.shown as connection | |
| postgresql.user.table.count | User Table Count | NULL | It monitors the number of user tables in current database. |
G2 PostgreSQL Database Connection Statistics Template-MultiInstance - v2
Description
Monitors Postgres DB agent metrics like postgresql.database.connections,postgresql.settings.connection
Prerequisites
NULL
Supported Metric
| Monitor Name | Metric Name | Metric Display Name | Unit | Description |
|---|---|---|---|---|
| G2 PostgreSQL Database Connection Statistics Monitor-MultiInstance - v2 | postgresql.database.connections | Postgresql Database Connections | NULL | The number of active connections to postgres database. |
| postgresql.settings.connection | Postgresql Settings Connections | NULL | The number of connections to this database as a fraction of the maximum number of allowed connections. | |
| postgresql.user_tables.rows_count | Postgresql User Tables Rows Count | count | number of rows scans | |
| postgresql.max_connections | Postgresql Max Connections | NULL | The maximum number of client connections allowed to this database.shown as connection | |
| postgresql.user.table.count | User Table Count | NULL | It monitors the number of user tables in current database. |
G2 PostgreSQL Database CPU Utilization Template
Description
G2 PostgreSQL Database CPU Utilization Template
Prerequisites
No prerequisite
Supported Metric
| Monitor Name | Metric Name | Metric Display Name | Unit | Description |
|---|---|---|---|---|
| G2 PostgreSQL Database Cpu Utilization Monitor | postgresql.activity.long_transactions | Postgresql Activity Long Transactions | h | Long-running transactions are bad because they prevent Postgres from vacuuming old data. This causes database bloat and,in extreme circumstances,shutdown due to transaction ID (xid) wraparound. Transactions should be kept as short as possible,ideally less than a minute. |
G2 PostgreSQL Database Deadlocks Template
Description
G2 PostgreSQL Database Deadlocks Template
Prerequisites
No prerequisite
Supported Metric
| Monitor Name | Metric Name | Metric Display Name | Unit | Description |
|---|---|---|---|---|
| G2 PostgreSQL Database Deadlocks Monitor | postgresql.database.deadlocks | Postgresql Database Deadlocks | count | Number of deadlocks detected in this database |
| postgresql.database.conflict.deadlocks | Postgresql Database Conflict Deadlocks | count | Number of conflicts in this database that have been canceled due to deadlocks |
G2 PostgreSQL Database Deadlocks Template-MultiInstance - v2
Description
Monitors Postgres DB agent metrics like postgresql.database.deadlocks,postgresql.database.conflict.deadlocks
Prerequisites
NULL
Supported Metric
| Monitor Name | Metric Name | Metric Display Name | Unit | Description |
|---|---|---|---|---|
| G2 PostgreSQL Database Deadlocks Monitor-MultiInstance - v2 | postgresql.database.deadlocks | Postgresql Database Deadlocks | count | Number of deadlocks detected in this database |
| postgresql.database.conflict.deadlocks | Postgresql Database Conflict Deadlocks | count | Number of conflicts in this database that have been canceled due to deadlocks |
G2 PostgreSQL Database Disk Usage Template
Description
G2 PostgreSQL Database Disk Usage Template
Prerequisites
No prerequisite
Supported Metric
| Monitor Name | Metric Name | Metric Display Name | Unit | Description |
|---|---|---|---|---|
| G2-PostgresqlDB-Disk-Usage-Monitor | postgresql.class.relpages | Postgresql Class Relpages | count | This query is used to display the tables and their respective indexes in descending order of relpages. |
G2 PostgreSQL Database Disk Usage Template-MultiInstance - v2
Description
Monitors Postgres DB agent metrics like postgresql.class.relpages
Prerequisites
NULL
Supported Metric
| Monitor Name | Metric Name | Metric Display Name | Unit | Description |
|---|---|---|---|---|
| G2 PostgreSQL Database Disk Usage Monitor-MultiInstance - v2 | postgresql.class.relpages | Postgresql Class Relpages | count | This query is used to display the tables and their respective indexes in descending order of relpages. |
G2 PostgreSQL Database IO Template
Description
G2 PostgreSQL Database IO Template
Prerequisites
No prerequisite
Supported Metric
| Monitor Name | Metric Name | Metric Display Name | Unit | Description |
|---|---|---|---|---|
| G2 PostgreSQL Database IO Monitor | postgresql.statio_tables.buffer_hits | Postgresql Statio Tables Buffer Hits | hps | Number of buffer hits in this table. |
| postgresql.statio_tables.index_block_read | Postgresql Statio Tables Index Block Read | NULL | Number of disk blocks read from all indexes on this table. | |
| postgresql.statio_tables.index_buffer_hit | Postgresql Statio Tables Index Buffer Hits | hps | Number of buffer hits in all indexes on this table. |
G2 PostgreSQL Database IO Template-MultiInstance - v2
Description
Monitors Postgres DB agent metrics like postgresql.statio_tables.buffer_hits
Prerequisites
NULL
Supported Metric
| Monitor Name | Metric Name | Metric Display Name | Unit | Description |
|---|---|---|---|---|
| G2 PostgreSQL Database IO Monitor-MultiInstance - v2 | postgresql.statio_tables.buffer_hits | Postgresql Statio Tables Buffer Hits | hps | Number of buffer hits in this table. |
| postgresql.statio_tables.index_block_read | Postgresql Statio Tables Index Block Read | NULL | Number of disk blocks read from all indexes on this table. | |
| postgresql.statio_tables.index_buffer_hit | Postgresql Statio Tables Index Buffer Hits | hps | Number of buffer hits in all indexes on this table. |
G2 PostgreSQL Database Locks Template
Description
G2 PostgreSQL Database Locks Template
Prerequisites
No prerequisite
Supported Metric
| Monitor Name | Metric Name | Metric Display Name | Unit | Description |
|---|---|---|---|---|
| G2 PostgreSQL Database Locks Monitor | postgresql.usertable.rowsdead | Postgresql User Table Rows Dead | NULL | This query gives the number of dead rows (tuples) in the table. |
| postgresql.database.deadlocks | Postgresql Database Deadlocks | count | Number of deadlocks detected in this database2. | |
| postgresql.locks.granted | Postgresql Locks Granted | NULL | True if lock is held,false if lock is awaited. |
G2 PostgreSQL Database Locks Template-MultiInstance - v2
Description
Monitors Postgres DB agent metrics like postgresql.usertable.rowsdead,postgresql.database.deadlocks,postgresql.locks.granted
Prerequisites
NULL
Supported Metric
| Monitor Name | Metric Name | Metric Display Name | Unit | Description |
|---|---|---|---|---|
| G2 PostgreSQL Database Locks Monitor-MultiInstance - v2 | postgresql.usertable.rowsdead | Postgresql User Table Rows Dead | NULL | This query gives the number of dead rows (tuples) in the table. |
| postgresql.database.deadlocks | Postgresql Database Deadlocks | count | Number of deadlocks detected in this database2. | |
| postgresql.locks.granted | Postgresql Locks Granted | NULL | True if lock is held,false if lock is awaited. |
G2 PostgreSQL Database Memory Template
Description
G2 PostgreSQL Database Memory Template
Prerequisites
No prerequisite
Supported Metric
| Monitor Name | Metric Name | Metric Display Name | Unit | Description |
|---|---|---|---|---|
| G2 PostgreSQL Database Memory Monitor | postgresql.database.size | Postgresql Database Size | GB | This helps is know the size of the database. |
G2 PostgreSQL Database Memory Template-MultiInstance - v2
Description
Monitors Postgres DB agent metrics like postgresql.database.size
Prerequisites
NULL
Supported Metric
| Monitor Name | Metric Name | Metric Display Name | Unit | Description |
|---|---|---|---|---|
| G2 PostgreSQL Database Memory Monitor-MultiInstance | postgresql.database.size | Postgresql Database Size | GB | This helps is know the size of the database. |
G2 PostgreSQL Database Performance Template
Description
G2 PostgreSQL Database Performance Template
Prerequisites
No prerequisite
Supported Metric
| Monitor Name | Metric Name | Metric Display Name | Unit | Description |
|---|---|---|---|---|
| G2 PostgreSQL Database Performance Monitor | postgresql.database.temp_bytes | Postgresql Database Temporary Bytes | NULL | Total amount of data written to temporary files by queries in this database. All temporary files are counted,regardless of why the temporary file was created,and regardless of the log_temp_files setting. |
| postgresql.database.rows_fetched | Postgresql Database Rows Fetched | NULL | Number of rows fetched by queries in this database. | |
| postgresql.database.rows_returned | Postgresql Database Rows Returned | NULL | Number of rows returned by queries in this database. | |
| postgresql.database.rows_updated | Postgresql Database Rows Updated | NULL | Number of rows updated by queries in this database. | |
| postgresql.database.rows_deleted | Postgresql Database Rows Deleted | NULL | Number of rows deleted by queries in this database. | |
| postgresql.database.rows_inserted | Postgresql Database Rows Inserted | NULL | Number of rows inserted by queries in this database. | |
| postgresql.stat_tables.seq_tup_read | Postgresql Tables Row Sequential Scan | NULL | Number of live rows fetched by sequential scans. | |
| postgresql.bgwriter.buffers_checkpoint | Postgresql Bgwriter Buffers Checkpoint | NULL | Number of buffers written during checkpoints. | |
| postgresql.bgwriter.buffers_clean | Postgresql Bgwriter Buffers Clean | NULL | Number of buffers written by the background writer. | |
| postgresql.bgwriter.buffers_backend | Postgresql Bgwriter Buffers Backend | NULL | Number of buffers written directly by a backend | |
| postgresql.bgwriter.checkpoints_timed | Postgresql Bgwriter Checkpoints Timed | NULL | Number of scheduled checkpoints that have been performed | |
| postgresql.bgwriter.checkpoints_req | Postgresql Bgwriter Checkpoints Timed | NULL | Number of scheduled checkpoints that have been performed |
G2 PostgreSQL Database Performance Template-MultiInstance - v2
Description
Monitors Postgres DB agent metrics like postgresql.database.temp_bytes,postgresql.database.rows_fetched,postgresql.database.rows_returned….
Prerequisites
NULL
Supported Metric
| Monitor Name | Metric Name | Metric Display Name | Unit | Description |
|---|---|---|---|---|
| G2 PostgreSQL Database Performance Monitor-MultiInstance - v2 | postgresql.database.temp_bytes | Postgresql Database Temporary Bytes | NULL | Total amount of data written to temporary files by queries in this database. All temporary files are counted,regardless of why the temporary file was created,and regardless of the log_temp_files setting. |
| postgresql.database.rows_fetched | Postgresql Database Rows Fetched | NULL | Number of rows fetched by queries in this database. | |
| postgresql.database.rows_returned | Postgresql Database Rows Returned | NULL | Number of rows returned by queries in this database. | |
| postgresql.database.rows_updated | Postgresql Database Rows Updated | NULL | Number of rows updated by queries in this database. | |
| postgresql.database.rows_deleted | Postgresql Database Rows Deleted | NULL | Number of rows deleted by queries in this database. | |
| postgresql.database.rows_inserted | Postgresql Database Rows Inserted | NULL | Number of rows inserted by queries in this database. | |
| postgresql.stat_tables.seq_tup_read | Postgresql Tables Row Sequential Scan | NULL | Number of live rows fetched by sequential scans. | |
| postgresql.bgwriter.buffers_checkpoint | Postgresql Bgwriter Buffers Checkpoint | NULL | Number of buffers written during checkpoints. | |
| postgresql.bgwriter.buffers_clean | Postgresql Bgwriter Buffers Clean | NULL | Number of buffers written by the background writer. | |
| postgresql.bgwriter.buffers_backend | Postgresql Bgwriter Buffers Backend | NULL | Number of buffers written directly by a backend | |
| postgresql.bgwriter.checkpoints_timed | Postgresql Bgwriter Checkpoints Timed | NULL | Number of scheduled checkpoints that have been performed | |
| postgresql.bgwriter.checkpoints_req | Postgresql Bgwriter Checkpoints Timed | NULL | Number of scheduled checkpoints that have been performed |
G2 PostgreSQL Database Session Template
Description
G2 PostgreSQL Database Session Template
Prerequisites
No prerequisite
Supported Metric
| Monitor Name | Metric Name | Metric Display Name | Unit | Description |
|---|---|---|---|---|
| G2 PostgreSQL Database Session Monitor | postgresql.activity.count | Postgresql Activity Count | NULL | This will tell you how close you are to hitting your max_connections limit,and show up any clients which are leaking database connections. |
| postgresql.locks.count | Postgresql Locks Count | NULL | The number of connections blocked waiting for a lock can be an indicator of a slow transaction with an exclusive lock. |
G2 PostgreSQL Database Session Template-MultiInstance - v2
Description
Monitors Postgres DB agent metrics like postgresql.activity.count,postgresql.locks.count
Prerequisites
NULL
Supported Metric
| Monitor Name | Metric Name | Metric Display Name | Unit | Description |
|---|---|---|---|---|
| G2 PostgreSQL Database Session Monitor-MultiInstance - v2 | postgresql.activity.count | Postgresql Activity Count | NULL | This will tell you how close you are to hitting your max_connections limit,and show up any clients which are leaking database connections. |
| postgresql.locks.count | Postgresql Locks Count | NULL | The number of connections blocked waiting for a lock can be an indicator of a slow transaction with an exclusive lock. |
G2 PostgreSQL Database Transactions Rollback Template
Description
G2 PostgreSQL Database Transactions Rollback Template
Prerequisites
No prerequisite
Supported Metric
| Monitor Name | Metric Name | Metric Display Name | Unit | Description |
|---|---|---|---|---|
| G2 PostgreSQL Database Transactions RolledBack Monitor | postgresql.database.transaction.rollback | Postgresql Database Transactions RolledBack | NULL | Number of transactions in this database that have been rolled back. |
G2 PostgreSQL Database Transactions Rollback Template-MultiInstance - v2
Description
Monitors Postgres DB agent metrics like postgresql.database.transaction.rollback
Prerequisites
NULL
Supported Metric
| Monitor Name | Metric Name | Metric Display Name | Unit | Description |
|---|---|---|---|---|
| G2 PostgreSQL Database Transactions RollBack Monitor-MultiInstance - v2 | postgresql.database.transaction.rollback | Postgresql Database Transactions RolledBack | NULL | Number of transactions in this database that have been rolled back. |
G2 PostgreSQL Hot Standby Feature Status Template-MultiInstance
Description
G2 PostgreSQL Hot Standby Feature Status Template-MultiInstance
Prerequisites
No prerequisite
Supported Metric
| Monitor Name | Metric Name | Metric Display Name | Unit | Description |
|---|---|---|---|---|
| G2 PostgreSQL Hot Standby Feature Status Monitor-MultiInstance | postgresql.hot.standby.feature.status | PostgreSQL Hot Standby Feature Status | NULL | Show the Hot Standby mode is either on or off. 1 means "on" & 0 means "off" |
G2-Cisco-UCS-B-Series-Fabric InterConnects Performance- Global
Description
Monitors the Hardware along with network components like switch card status,switch ether net port and fiber channel port status.
Prerequisites
No prerequisite
Supported Metric
| Monitor Name | Metric Name | Metric Display Name | Unit | Description |
|---|---|---|---|---|
| CISCO UCS Fabric Interconnectors | ucs.sys.switch.fanmodule.fan.operstate | CISCO UCS Switch Fan operstate | NULL | CISCO UCS Switch Fan operstate |
| ucs.sys.switch.switchcard.operstate | CISCO UCS SwitchCard operstate | NULL | CISCO UCS SwitchCard operstate | |
| ucs.sys.switch.psu.operstate | CISCO UCS Switch PSU operstate | NULL | CISCO UCS Switch PSU operstate | |
| ucs.sys.switch.operability | CISCO UCS Switch operability | NULL | CISCO UCS Switch operability | |
| ucs.sys.switch.fanmodule.fan.voltage | CISCO UCS Switch Fan voltage | NULL | CISCO UCS Switch Fan voltage | |
| ucs.sys.switch.psu.power | CISCO UCS Switch PSU power | NULL | CISCO UCS Switch PSU power | |
| ucs.sys.switch.switchcard.power | CISCO UCS SwitchCard power | NULL | CISCO UCS SwitchCard power | |
| ucs.sys.switch.switchcard.state | CISCO UCS SwitchCard state | CISCO UCS SwitchCard state |
G2-MSSQLDB-AlwaysON-Database Replication State
Description
This template supports for both SQL and Windows Authentication. Integration is done through JDBC and MSSQL queries and tested in MSSQL v18.9.1
Prerequisites
- The gateway version must be 14.0.0 or above.
- Database Credentials must be added on the end device.
- While applying template at device level cross check Transport Type, DB Instance name, Service port, Authentication Type.
Template Usage Guidelines
- We have to use below syntax if those are instances
<instance1>:<port1>,<instance2>:<port2>,..etc - If it is a database then we can use below syntax
<database1>,<database2>,..etc.
Supported Metric
| Monitor Name | Metric Name | Metric Display Name | Unit | Description |
|---|---|---|---|---|
| G2-MSSQLDB-AlwaysON-Database Replication State | mssql_alwayson_database_replicaState | MSSQL Alwayson Database Replica State | NULL | It monitor the MSSQL Always On Database Replica synchronization state along with role description. Below are the possible states: PRIMARY_NOT SYNCHRONIZING - 0 PRIMARY_SYNCHRONIZING - 1 PRIMARY_SYNCHRONIZED - 2 PRIMARY_REVERTING - 3 PRIMARY_INITIALIZING - 4 SECONDARY_NOT SYNCHRONIZING - 5 SECONDARY_SYNCHRONIZING - 6 SECONDARY_SYNCHRONIZED - 7 SECONDARY_REVERTING - 8 SECONDARY_INITIALIZING - 9 |
G2-Storage-EMC PowerScale-Isilon-Cluster
Description
Template to monitor Dell EMC PowerScale Isilon Cluster parameters like Total Bytes,Used Bytes,Free Bytes,Cluster Health,Node Count,Cluster Offline Nodes,Throughput Rate In,Throughput Rate Out,Interface Input Rate,Interface Output Rate,Cluster CPU User,Cluster CPU Nice,Cluster CPU System,Cluster CPU Interrupt,Cluster CPU Idle Pct [ISILON-MIB :: ifsTotalBytes : 1.3.6.1.4.1.12124.1.3.1.0,ifsUsedBytes : 1.3.6.1.4.1.12124.1.3.2.0,ifsFreeBytes : 1.3.6.1.4.1.12124.1.3.4.0,clusterHealth : 1.3.6.1.4.1.12124.1.1.2.0,nodeCount : 1.3.6.1.4.1.12124.1.1.4.0,offlineNodes : 1.3.6.1.4.1.12124.1.1.7.0,clusterIfsInBitsPerSecond : 1.3.6.1.4.1.12124.1.2.1.2.0,clusterIfsOutBitsPerSecond : 1.3.6.1.4.1.12124.1.2.1.4.0,clusterNetworkInBitsPerSecond : 1.3.6.1.4.1.12124.1.2.2.2.0,clusterNetworkOutBitsPerSecond : 1.3.6.1.4.1.12124.1.2.2.4.0,clusterCPUUser : 1.3.6.1.4.1.12124.1.2.3.1.0,clusterCPUNice : 1.3.6.1.4.1.12124.1.2.3.2.0,clusterCPUSystem : 1.3.6.1.4.1.12124.1.2.3.3.0,clusterCPUInterrupt : 1.3.6.1.4.1.12124.1.2.3.4.0,clusterCPUIdlePct : 1.3.6.1.4.1.12124.1.2.3.5.0]
Prerequisites
No prerequisite
Supported Metric
| Monitor Name | Metric Name | Metric Display Name | Unit | Description |
|---|---|---|---|---|
| Dell EMC Isilon Cluster Capacity Stats | emc_isilon_cluster_ifsUsedSize | Cluster Ifs Used Size | GB | Provides the number of bytes used in the /ifs filesystem.[ISILON-MIB :: ifsUsedBytes : 1.3.6.1.4.1.12124.1.3.2.0] |
| emc_isilon_cluster_IfsUtilization | Cluster Ifs Utilization | % | Provides the utilization of the ifs file system.[ISILON-MIB :: ifsTotalBytes : 1.3.6.1.4.1.12124.1.3.1.0,ifsUsedBytes : 1.3.6.1.4.1.12124.1.3.2.0] | |
| emc_isilon_cluster_IfsTotalSize | Cluster Ifs Total Size | GB | Provides the total cluster capacity of the /ifs filesystem in bytes.[ISILON-MIB :: ifsTotalBytes : 1.3.6.1.4.1.12124.1.3.1.0] | |
| emc_isilon_cluster_ifsFreeSize | Cluster Ifs Free Size | GB | Provides the number of bytes free in the /ifs filesystem (includes Virtual Hot Spare).[ISILON-MIB :: ifsFreeBytes : 1.3.6.1.4.1.12124.1.3.4.0] | |
| Dell EMC Isilon Cluster CPU Statistics | emc_isilon_Cluster_ClusterCPUSystem | Cluster CPU System | Provides the average amount of CPU (per mil) used by system processes within the last 5 seconds for all CPUs.[ISILON-MIB :: clusterCPUSystem : 1.3.6.1.4.1.12124.1.2.3.3.0] | |
| emc_isilon_Cluster_ClusterCPUInterrupt | Cluster CPU Interrupt | Provides the average amount of CPU (per mil) used by interrupts processes within the last 5 seconds for all CPUs.[ISILON-MIB :: clusterCPUInterrupt : 1.3.6.1.4.1.12124.1.2.3.4.0] | ||
| emc_isilon_Cluster_ClusterCPUNice | Cluster CPU Nice | Provides the average amount of CPU (per mil) used by nice processes within the last 5 seconds for all CPUs.[ISILON-MIB :: clusterCPUNice : 1.3.6.1.4.1.12124.1.2.3.2.0] | ||
| emc_isilon_Cluster_ClusterCPUUser | Cluster CPU User | Provides the average amount of CPU (per mil) used by user processes within the last 5 seconds for all CPUs.[ISILON-MIB :: clusterCPUUser : 1.3.6.1.4.1.12124.1.2.3.1.0] | ||
| emc_isilon_Cluster_ClusterCPUIdlePct | Cluster CPU Idle Pct | Provides the average amount of CPU time (per mil) averaged for all nodes averaged for all nodes over the last 5 seconds. | ||
| Dell EMC Isilon Cluster Stats | emc_isilon_ClusterHealth | Cluster Health | Monitors the overall health status of the cluster. Possible status values of the node health status are 0- Ok,1- Attention,2- Down,3- Invalid. Alert will be generated when the health status is 2- Down,3- Invalid.[ISILON-MIB :: clusterHealth : 1.3.6.1.4.1.12124.1.1.2.0]. | |
| emc_isilon_Cluster_NodeCount | Cluster Node Count | count | Monitors the total number of nodes in the cluster [ISILON-MIB :: nodeCount : 1.3.6.1.4.1.12124.1.1.4.0] | |
| emc_isilon_Cluster_ClusterIfsInBitsPerSecond | Cluster Ifs Throughput Rate In | bps | Providdes the cumulative throughput rate (bits per second) into /ifs [ISILON-MIB :: clusterIfsInBitsPerSecond : 1.3.6.1.4.1.12124.1.2.1.2.0] | |
| emc_isilon_Cluster_ClusterNetworkInBitsPerSecond | Cluster Network Throughput Rate In | bps | Provides the the cumulative input rate (bits per second) for all external interfaces [ISILON-MIB :: clusterNetworkInBitsPerSecond : 1.3.6.1.4.1.12124.1.2.2.2.0] | |
| emc_isilon_Cluster_ClusterNetworkOutBitsPerSecond | Cluster Network Throughput Rate Out | bps | Provides the cumulative output rate (bits per second) for all external interfaces [ISILON-MIB :: clusterNetworkOutBitsPerSecond : 1.3.6.1.4.1.12124.1.2.2.4.0] | |
| emc_isilon_Cluster_clusterIfsOutBitsPerSecond | Cluster Ifs Throughput Rate Out | bps | Provides the cumulative throughput rate (bits per second) out of/ifs [ISILON-MIB :: clusterIfsOutBitsPerSecond : 1.3.6.1.4.1.12124.1.2.1.4.0] | |
| emc_isilon_Cluster_OfflineNodes | Cluster Offline Nodes | count | Provides a comma-separted list of the logical node numbers of the offline nodes in the cluster.[ISILON-MIB :: offlineNodes : 1.3.6.1.4.1.12124.1.1.7.0] |
G2-Storage-EMC PowerScale-Isilon-Hardware
Description
Template to monitor Dell EMC PowerScale Isilon Hardware parameters like Fan Speed,Temparature Sensor Value,Power Sensor Value,License Status [ISILON-MIB :: fanSpeed : 1.3.6.1.4.1.12124.2.53.1.4,tempSensorValue : 1.3.6.1.4.1.12124.2.54.1.4,powerSensorValue : 1.3.6.1.4.1.12124.2.55.1.4,licenseStatus : 1.3.6.1.4.1.12124.1.5.1.1.3].
Prerequisites
No prerequisite
Supported Metric
| Monitor Name | Metric Name | Metric Display Name | Unit | Description |
|---|---|---|---|---|
| Dell EMC Isilon Fan | emc_isilon_fan_FanSpeed | Fan Speed | rpm | Provides the current speed of the fan in revolutions per minute.[ISILON-MIB :: fanSpeed : 1.3.6.1.4.1.12124.2.53.1.4] |
| Dell EMC Isilon License Status | emc_isilon_license_LicenseStatus | License Status | Monitors the status of the license. It may be licensed,unlicensed,or an evaluation license. Possible status values are - 1 - Expired,-2 - Inactive,0- Activated,1- Evaluation. Alert will be generated when the license status is -1- Expired.[ISILON-MIB :: licenseStatus : 1.3.6.1.4.1.12124.1.5.1.1.3] | |
| Dell EMC Isilon Power Sensor | emc_isilon_power_PowerSensorValue | Power Sensor | v | Monitors the current reading of the sensor in volts or amps.[ISILON-MIB :: powerSensorValue : 1.3.6.1.4.1.12124.2.55.1.4] |
| Dell EMC Isilon Temperature Sensor | emc_isilon_temparature_TempSensorValue | Temparature Sensor Value | Celsius | Monitors the current reading of the temperature sensor in degrees celsius. sensor[ISILON-MIB :: tempSensorValue : 1.3.6.1.4.1.12124.2.54.1.4] |
G2-Storage-EMC PowerScale-Isilon-Node
Description
Template to monitor Dell EMC PowerScale Isilon Node parameters likeNode Health,Throughput Rate In,Throughput Rate Out,Interface Input Rate,Interface Output Rate,Node CPU User,Node CPU Nice,Node CPU System,Node CPU Interrupt,Node CPU Idle,Minimum Input Operations,Maximum Input Operations,Average Input Operations,Minimum Output Operations,Maximum Output Operations,Average Output Operations,Minimum Latency,Maximum Latency,Average Latency,Disk Operations,Disk Input Rate,Disk Output Rate,Disk Status,Disk Size.[ISILON-MIB :: nodeHealth : 1.3.6.1.4.1.12124.2.1.2.0,nodeIfsInBitsPerSecond : 1.3.6.1.4.1.12124.2.2.1.2.0,nodeIfsOutBitsPerSecond : 1.3.6.1.4.1.12124.2.2.1.4.0,nodeNetworkInBitsPerSecond : 1.3.6.1.4.1.12124.2.2.2.2.0,nodeNetworkOutBitsPerSecond : 1.3.6.1.4.1.12124.2.2.2.4.0,nodeCPUUser : 1.3.6.1.4.1.12124.2.2.3.1.0,nodeCPUNice : 1.3.6.1.4.1.12124.2.2.3.2.0,nodeCPUSystem : 1.3.6.1.4.1.12124.2.2.3.3.0,nodeCPUInterrupt : 1.3.6.1.4.1.12124.2.2.3.4.0,nodeCPUIdle : 1.3.6.1.4.1.12124.2.2.3.5.0,inMinBytes : 1.3.6.1.4.1.12124.2.2.10.1.4,inMaxBytes : 1.3.6.1.4.1.12124.2.2.10.1.5,inAvgBytes : 1.3.6.1.4.1.12124.2.2.10.1.6,outMinBytes : 1.3.6.1.4.1.12124.2.2.10.1.9,outMaxBytes : 1.3.6.1.4.1.12124.2.2.10.1.10,outAvgBytes : 1.3.6.1.4.1.12124.2.2.10.1.11,latencyMin : 1.3.6.1.4.1.12124.2.2.10.1.14,latencyMax : 1.3.6.1.4.1.12124.2.2.10.1.15,latencyAverage : 1.3.6.1.4.1.12124.2.2.10.1.16,diskPerfOpsPerSecond : 1.3.6.1.4.1.12124.2.2.52.1.3,diskPerfInBitsPerSecond : 1.3.6.1.4.1.12124.2.2.52.1.4,diskPerfOutBitsPerSecond : 1.3.6.1.4.1.12124.2.2.52.1.5,diskStatus : 1.3.6.1.4.1.12124.2.52.1.5,diskSizeBytes : 1.3.6.1.4.1.12124.2.52.1.9].
Prerequisites
No prerequisite
Supported Metric
| Monitor Name | Metric Name | Metric Display Name | Unit | Description |
|---|---|---|---|---|
| Dell EMC Isilon Disk Performance | emc_isilon_disk_DiskPerfInBitsPerSecond | Disk Input Rate | bps | Provides the input rate (bits per second) into this disk.[ISILON-MIB :: diskPerfInBitsPerSecond : 1.3.6.1.4.1.12124.2.2.52.1.4] |
| emc_isilon_disk_DiskPerfOutBitsPerSecond | Disk Output Rate | bps | Provides the output rate (bits per second) from this disk.[ISILON-MIB :: diskPerfOutBitsPerSecond : 1.3.6.1.4.1.12124.2.2.52.1.5] | |
| emc_isilon_disk_DiskPerfOpsPerSecond | Disk Operations | psec | Provides the value of number of disk operations per second.[ISILON-MIB :: diskPerfOpsPerSecond : 1.3.6.1.4.1.12124.2.2.52.1.3] | |
| Dell EMC Isilon Disk Status | emc_isilon_disk_DiskSizeBytes | Disk Size | GB | Monitors the size of the disk in bytes.[ISILON-MIB :: diskSizeBytes : 1.3.6.1.4.1.12124.2.52.1.9] |
| emc_isilon_disk_DiskStatus | Disk Status | Monitors the status of the Disk. Alert will be generated when the status is not Healthy.[ISILON-MIB :: diskStatus : 1.3.6.1.4.1.12124.2.52.1.5] | ||
| Dell EMC Isilon Node Statistics | emc_isilon_node_NodeIfsOutBitsPerSecond | Node Ifs Throughput Rate Out | bps | Provides the throughput rate (bits per second) out of/ifs through this node.[ISILON-MIB :: nodeIfsOutBitsPerSecond : 1.3.6.1.4.1.12124.2.2.1.4.0] |
| emc_isilon_node_NodeIfsInBitsPerSecond | Node Ifs Throughput Rate In | bps | Provides the throughput rate (bits per second) into /ifs through this node.[ISILON-MIB :: nodeIfsInBitsPerSecond : 1.3.6.1.4.1.12124.2.2.1.2] | |
| emc_isilon_node_NodeHealth | Node Health | Monitors the node health status and gives the details about the basic node type as well. Possible status values of the node health status are 0- Ok,1- Attention,2- Down,3- Invalid. Alert will be generated when the health status is 2- Down,3- Invalid.[ISILON-MIB :: nodeHealth : 1.3.6.1.4.1.12124.2.1.2.0] | ||
| emc_isilon_node_NodeNetworkOutBitsPerSecond | Node Network Throughput Rate Out | bps | Provides the total output rate (bits per second) from the node's external interfaces.[ISILON-MIB :: 1.3.6.1.4.1.12124.2.2.2.4.0] | |
| emc_isilon_node_NodeNetworkInBitsPerSecond | Node Network Throughput Rate In | bps | Provides the total input rate (bits per second) into the node's external interfaces.[ISILON-MIB :: nodeNetworkInBitsPerSecond : 1.3.6.1.4.1.12124.2.2.2.2.0] | |
| Dell EMC Isilon Node CPU Statistics | emc_isilon_node_NodeCPUUser | Node CPU User | Provides the average amount of CPU (per mil) used by user processes within the last 5 seconds for all CPUs.[ISILON-MIB :: nodeCPUUser : 1.3.6.1.4.1.12124.2.2.3.1.0] | |
| emc_isilon_node_NodeCPUSystem | Node CPU System | Provides the average amount of CPU (per mil) used by system processes within the last 5 seconds for all CPUs.[ISILON-MIB :: nodeCPUSystem : 1.3.6.1.4.1.12124.2.2.3.3.0] | ||
| emc_isilon_node_NodeCPUIdle | Node CPU Idle | Provides the average amount of CPU (per mil) used by idle processes within the last 5 seconds for all CPUs.[ISILON-MIB :: nodeCPUIdle : 1.3.6.1.4.1.12124.2.2.3.5.0] | ||
| emc_isilon_node_NodeCPUInterrupt | Node CPU Interrupt | Provides the average amount of CPU (per mil) used by interrupts processes within the last 5 seconds for all CPUs.[ISILON-MIB :: nodeCPUInterrupt : 1.3.6.1.4.1.12124.2.2.3.4.0] | ||
| emc_isilon_node_NodeCPUNice | Node CPU Nice | Provides the average amount of CPU (per mil) used by nice processes within the last 5 seconds for all CPUs.[ISILON-MIB :: nodeCPUNice : 1.3.6.1.4.1.12124.2.2.3.2.0] | ||
| Dell EMC Node Protocol Statistics | emc_isilon_node_OutMaxBytes | Maximum Output Size | Bytes | Monitors the largest output size in bytes of all operations for the protocol.[ISILON-MIB :: outMaxBytes : 1.3.6.1.4.1.12124.2.2.10.1.10] |
| emc_isilon_node_OutMinBytes | Minimum Output Size | Bytes | Monitors the smallest output size in bytes of all operations for the protocol.[ISILON-MIB :: outMinBytes : 1.3.6.1.4.1.12124.2.2.10.1.9] | |
| emc_isilon_node_LatencyMin | Minimum Latency | microsec | Provides the minimum latency in microseconds for all operations for the protocol.[ISILON-MIB :: latencyMin : 1.3.6.1.4.1.12124.2.2.10.1.14] | |
| emc_isilon_node_OutAvgBytes | Average Output Size | Bytes | Monitors the average output size in bytes of all operations for the protocol.[ISILON-MIB :: outAvgBytes : 1.3.6.1.4.1.12124.2.2.10.1.11] | |
| emc_isilon_node_latencyAverage | Average Latency | microsec | Provides the average latency in microseconds for all operations for the protocol.[ISILON-MIB :: latencyAverage : 1.3.6.1.4.1.12124.2.2.10.1.16] | |
| emc_isilon_node_LatencyMax | Maximum Latency | microsec | Provides the maximum latency in microseconds for all operations for the protocol.[ISILON-MIB :: latencyMax : 1.3.6.1.4.1.12124.2.2.10.1.15] | |
| emc_isilon_node_InMinBytes | Minimum Input Size | Bytes | Provides the smallest input size in bytes of all operations for the protocol.[ISILON-MIB :: 1.3.6.1.4.1.12124.2.2.10.1.4] | |
| emc_isilon_node_InMaxBytes | Maximum Input Size | Bytes | Monitors the largest input size in bytes of all operations for the protocol.[ISILON-MIB :: inMaxBytes : 1.3.6.1.4.1.12124.2.2.10.1.5] | |
| emc_isilon_node_InAvgBytes | Average Input Size | Bytes | Monitors the average input size in bytes for all operations for the protocol.[ISILON-MIB :: inAvgBytes : 1.3.6.1.4.1.12124.2.2.10.1.6] |
G2-Storage-EMC-Xtremio Cluster Array
Description
G2-Storage-EMC-Xtremio Cluster Array
Prerequisites
No prerequisite
Supported Metric
| Monitor Name | Metric Name | Metric Display Name | Unit | Description |
|---|---|---|---|---|
| EMC Xtremio Cluster Monitor | xtremio.array.cluster.overall-efficiency | Cluster Overall Efficiency | Cluster Overall Efficiency | |
| xtremio.array.cluster.sys-health-state | Cluster Health State | Cluster Health State | ||
| xtremio.array.cluster.sys-state | Cluster State | Cluster State | ||
| xtremio.array.cluster.sys-mgr-conn-state | Cluster Connection State | Cluster Connection State | ||
| xtremio.array.cluster.data-reduction-ratio | Cluster Data Reduction Ratio | Cluster Data Reduction Ratio | ||
| xtremio.array.cluster.space-saving-ratio | Cluster Space Saving Ratio | Cluster Space Saving Ratio | ||
| xtremio.array.cluster.dedup-ratio | Cluster Deduplication Ratio | Cluster Deduplication Ratio | ||
| xtremio.array.cluster.compression-factor | Cluster Compression Reduction Ratio | Cluster Compression Reduction Ratio | ||
| xtremio.array.cluster.thin-provisioning-ratio | Cluster Thin Provisioning Saving | % | Cluster Thin Provisioning Saving | |
| xtremio.array.cluster.vol-size | Cluster Volume Capacity | GB | Cluster Volume Capacity | |
| xtremio.array.cluster.logical-space-in-use | Cluster Volume Used Space | Gb | Cluster Volume Used Space | |
| xtremio.array.cluster.volume-percent-used | Cluster Volume Percent Used | % | Cluster Volume Percent Used | |
| xtremio.array.cluster.volume-free-space | Cluster Volume Free Space | GB | Cluster Volume Free Space | |
| xtremio.array.cluster.volume-free-percent | Cluster Volume Free Percent | % | Cluster Volume Free Percent | |
| xtremio.array.cluster.ud-ssd-space | Cluster Physical Capacity | GB | Cluster Physical Capacity | |
| xtremio.array.cluster.ud-ssd-space-in-use | Cluster Physical Space in Use | GB | Cluster Physical Space in Use | |
| xtremio.array.cluster.physical-percent-used | Cluster Physical Percent Used | % | Cluster Physical Percent Used | |
| xtremio.array.cluster.physical-free-space | Cluster Physical Free Space | GB | Cluster Physical Free Space | |
| xtremio.array.cluster.free-ud-ssd-space-in-percent | Cluster Physical Free Percent | % | Cluster Physical Free Percent | |
| xtremio.array.cluster.totalbandwidth | Cluster Total Bandwidth | KBps | Cluster Total Bandwidth | |
| xtremio.array.cluster.readbandwidth | Cluster Read Bandwidth | KBps | Cluster Read Bandwidth | |
| xtremio.array.cluster.writebandwidth | Cluster Write Bandwidth | KBps | Cluster Write Bandwidth | |
| xtremio.array.cluster.iops | Cluster Total IOPS | Cluster Total IOPS | ||
| xtremio.array.cluster.rd-iops | Cluster Read IOPS | Cluster Read IOPS | ||
| xtremio.array.cluster.wr-iops | Cluster Write IOPS | Cluster Write IOPS | ||
| xtremio.array.cluster.avg-latency | Cluster Total Latency | ms | Cluster Total Latency | |
| xtremio.array.cluster.rd-latency | Cluster Read Latency | ms | Cluster Read Latency | |
| xtremio.array.cluster.wr-latency | Cluster Write Latency | ms | Cluster Write Latency |
G2-Storage-EMC-XtremIO Cluster Array Battery
Description
Monitors the Cluster Array battery status and its parameters.
Prerequisites
No prerequisite
Supported Metric
| Monitor Name | Metric Name | Metric Display Name | Unit | Description |
|---|---|---|---|---|
| EMC Xtremio Battery Monitor | xtremio.cluster.bbu.ups-input | BBU Input | Battery Input | |
| xtremio.cluster.bbu.fru-lifecycle-state | BBU Lifecycle State | Battery Lifecycle State | ||
| xtremio.cluster.bbu.ups-conn-state | BBU Connection State | Battery Connection State | ||
| xtremio.cluster.bbu.ups-battery-charge-in-percent | Battery Charge in Percent | % | Battery Charge in Percent | |
| xtremio.cluster.bbu.ups-load-in-percent | BBU Load in Percent | % | Battery Load in Percent | |
| xtremio.cluster.bbu.ups-load-percent-level | BBU Load Level | Battery Load Level |
G2-Storage-EMC-XtremIO Cluster Array Disk
Description
Monitors the Cluster Array disk parameters.
Prerequisites
No prerequisite
Supported Metric
| Monitor Name | Metric Name | Metric Display Name | Unit | Description |
|---|---|---|---|---|
| EMC Xtremio Disk Array Enclosure Monitor | xtremio.cluster.dae.fru-lifecycle-state | DAE Lifecycle State | DAE Lifecycle State | |
| EMC Xtremio Disk Monitor | xtremio.cluster.ssd.fru-lifecycle-state | SSD FRU Lifecycle State | SSD FRU Lifecycle State | |
| xtremio.cluster.ssd.ssd-size-in-kb | SSD Capacity GB | GB | SSD Capacity GB | |
| xtremio.cluster.ssd.ssd-space-in-use | SSD Used GB | GB | SSD Used GB | |
| xtremio.cluster.ssd.ssd-percent-used | SSD Percent Used | % | SSD Percent Used | |
| xtremio.cluster.ssd.percent-endurance-remaining | SSD Percent Endurance Remaining | % | SSD Percent Endurance Remaining | |
| xtremio.cluster.ssd.ssd-failure-reason | SSD Failure Reason | SSD Failure Reason | ||
| xtremio.cluster.ssd.bandwidth | SSD Total Bandwidth | KBps | SSD Total Bandwidth | |
| xtremio.cluster.ssd.readbandwidth | SSD Read Bandwidth | KBps | SSD Read Bandwidth | |
| xtremio.cluster.ssd.writebandwidth | SSD Write Bandwidth | KBps | SSD Write Bandwidth | |
| xtremio.cluster.ssd.iops | SSD Total IOPS | SSD Total IOPS | ||
| xtremio.cluster.ssd.rd-iops | SSD Read IOPS | SSD Read IOPS | ||
| xtremio.cluster.ssd.wr-iops | SSD Write IOPS | SSD Write IOPS |
G2-Storage-EMC-XtremIO Cluster Array-DAE Controller
Description
Monitors the DAE Controller parameters
Prerequisites
No prerequisite
Supported Metric
| Monitor Name | Metric Name | Metric Display Name | Unit | Description |
|---|---|---|---|---|
| EMC Xtremio DAE Controller Monitor | xtremio.cluster.daecontroller.fru-lifecycle-state | DAE Controller Lifecycle State | DAE Controller Lifecycle State | |
| xtremio.cluster.daecontroller.enabled-state | DAE Controller Enabled State | DAE Controller Enabled State | ||
| xtremio.cluster.daecontroller.sas1-port-state | DAE Controller SAS1 Port State | DAE Controller SAS1 Port State | ||
| xtremio.cluster.daecontroller.sas2-port-state | DAE Controller SAS2 Port State | DAE Controller SAS2 Port State |
G2-Storage-EMC-XtremIO Cluster Array-DPG & IG
Description
Monitors the Data Protection Group,Initiator Group and Infiband Switch parameters.
Prerequisites
No prerequisite
Supported Metric
| Monitor Name | Metric Name | Metric Display Name | Unit | Description |
|---|---|---|---|---|
| EMC Xtremio Data Protection Group Monitor | xtremio.cluster.dataprotectiongroup.protection-state | DP Group Protection State | Data Protection Group Protection State | |
| xtremio.cluster.dataprotectiongroup.ssd-size | DP Group Total SSD Size | GB | Data Protection Group Total SSD Size | |
| xtremio.cluster.dataprotectiongroup.useful-ssd-space | DP Group Useful SSD Space | GB | Data Protection Group Useful SSD Space | |
| xtremio.cluster.dataprotectiongroup.ud-ssd-space | DP Group User Space | GB | Data Protection Group User Space | |
| xtremio.cluster.dataprotectiongroup.ud-ssd-space-in-use | DP Group In Use User Space | GB | Data Protection Group In Use User Space | |
| xtremio.cluster.dataprotectiongroup.rg-ud-ssd-percent-free-space | DP Group Free User Space Percent | % | Data Protection Group Free User Space Percent | |
| EMC Xtremio Infiband Switch Monitor | xtremio.cluster.infibandswitch.fru-lifecycle-state | Infiband Switch Lifecycle State | Infiband Switch Lifecycle State | |
| EMC Xtremio Initiator Group Monitor | xtremio.cluster.initiatorgroup.totalbandwidth | Igrp Total Bandwidth | KBps | Initiator Group Total Bandwidth |
| xtremio.cluster.initiatorgroup.readbandwidth | Igrp Read Bandwidth | KBps | Initiator Group Read Bandwidth | |
| xtremio.cluster.initiatorgroup.writebandwidth | Igrp Write Bandwidth | KBps | Initiator Group Write Bandwidth | |
| xtremio.cluster.initiatorgroup.iops | Igrp Total IOPS | Initiator Group Total IOPS | ||
| xtremio.cluster.initiatorgroup.rd-iops | Igrp Read IOPS | Initiator Group Read IOPS | ||
| xtremio.cluster.initiatorgroup.wr-iops | Igrp Write IOPS | Initiator Group Write IOPS |
G2-Storage-EMC-Xtremio Cluster Volume
Description
This template is applicable for Cluster Volume of Xtremio. This template monitors performance related to particular Cluster Volume.
Prerequisites
No prerequisite
Supported Metric
| Monitor Name | Metric Name | Metric Display Name | Unit | Description |
|---|---|---|---|---|
| EMC Xtremio Cluster Volume Monitor | xtremio.cluster.volume.vol-size | Capacity GB | GB | Capacity GB |
| xtremio.cluster.volume.logical-space-in-use | Used GB | GB | Used GB | |
| xtremio.cluster.volume.volume-percent-used | Percent Used | % | Percent Used | |
| xtremio.cluster.volume.totalbandwidth | Total Bandwidth | KBps | Total Bandwidth | |
| xtremio.cluster.volume.readbandwidth | Read Bandwidth | KBps | Read Bandwidth | |
| xtremio.cluster.volume.writebandwidth | Write Bandwidth | KBps | Write Bandwidth | |
| xtremio.cluster.volume.iops | Total IOPS | NULL | Total IOPS | |
| xtremio.cluster.volume.rd-iops | Read IOPS | NULL | Read IOPS | |
| xtremio.cluster.volume.wr-iops | Write IOPS | NULL | Write IOPS | |
| xtremio.cluster.volume.avg-latency | Average Latency | ms | Average Latency | |
| xtremio.cluster.volume.rd-latency | Read Latency | ms | Read Latency | |
| xtremio.cluster.volume.wr-latency | Write Latency | ms | Write Latency |
G2-Storage-EMC-XtremIO-Controller
Description
Applicable on Storage Controller / Controller
Prerequisites
No prerequisite
Supported Metric
| Monitor Name | Metric Name | Metric Display Name | Unit | Description |
|---|---|---|---|---|
| EMC Xtremio Controller Monitor | xtremio.cluster.storagecontroller.fru-lifecycle-state | Controller Lifecycle State | Controller Lifecycle State | |
| xtremio.cluster.storagecontroller.node-health-state | Controller Health State | Controller Health State | ||
| xtremio.cluster.storagecontroller.enabled-state | Controller Enabled State | Controller Enabled State | ||
| xtremio.cluster.storagecontroller.node-mgr-conn-state | Conrtoller Connection State | Controller Connection State | ||
| xtremio.cluster.storagecontroller.sas1-port-state | Controller SAS1 Port State | Controller SAS1 Port State | ||
| xtremio.cluster.storagecontroller.sas2-port-state | Controller SAS2 Port State | Controller SAS2 Port State |
Gateway - Linux Network Remote Monitoring - v2
Description
Monitors the network statistics like traffic, packets, errors, and discards. Version 2 template is redesigned for better reliability and maintainability with improved performance.
Prerequisites
End device SSH credentials need to be added on End device itself.
Supported Metric
| Monitor Name | Metric Name | Metric Display Name | Unit | Description |
|---|---|---|---|---|
| Gateway - Linux Network Monitor - v2 | system.network.interface.packets.in | System Network In packets | packets/sec | Monitors in Packets of each interface for Linux Devices |
| system.network.interface.errors.in | System Network In Errors | Errors per Sec | Monitors network in errors of each interface for Linux Devices | |
| system.network.interface.errors.out | System Network Out Errors | Errors per Sec | Monitors network out traffic of each interface for Linux Devices | |
| system.network.interface.traffic.out | System Network Out Traffic | Kbps | Monitors out traffic of each interface for Linux Devices | |
| system.network.interface.discards.out | System Network Out Discards | packets/sec | Monitors network out discards of each interface for Linux Devices | |
| system.network.interface.traffic.in | System Network In traffic | Kbps | Monitors in traffic of each interface for Linux Devices | |
| system.network.interface.discards.in | System Network In discards | packets/sec | Monitors network in discards of each interface for Linux Devices | |
| system.network.interface.packets.out | System Network out packets | packets/sec | Monitors out packets of each interface for Linux Devices |
Gateway - Linux Network Remote Monitoring
Description
Gateway - Linux Network Remote Monitoring
Prerequisites
End device SSH credentials need to be added on End device itself.
Supported Metric
| Monitor Name | Metric Name | Metric Display Name | Unit | Description |
|---|---|---|---|---|
| Gateway - Linux Network Monitor | system.network.interface.packets.in | System Network In packets | packets/sec | Monitors in Packets of each interface for Linux Devices |
| system.network.interface.errors.in | System Network In Errors | Errors per Sec | Monitors network in errors of each interface for Linux Devices | |
| system.network.interface.errors.out | System Network Out Errors | Errors per Sec | Monitors Network Out traffic of each interface for Linux Devices | |
| system.network.interface.traffic.out | System Network Out Traffic | Kbps | Monitors Out traffic of each interface for Linux Devices | |
| system.network.interface.discards.out | System Network Out Discards | psec | Monitors network Out Discards of each interface for Linux Devices | |
| system.network.interface.traffic.in | System Network In traffic | Kbps | Monitors In traffic of each interface for Linux Devices | |
| system.network.interface.discards.in | System Network In discards | psec | Monitors Network in discards of each interface for Linux Devices | |
| system.network.interface.packets.out | System Network out packets | packets/sec | Monitors Out packets of each interface for Linux Devices |
Gateway - Linux OS Performance Remote Monitoring - v4
Description
Monitors the basic OS performance metrics like Uptime, CPU Load, CPU Utilization, Memory, and Disk Usage (Space and Inodes). Version 4 template is redesigned for better reliability and maintainability with improved performance.
Prerequisites
- Applicable on devices which are managed by Linux gateway 10.0.0 and above versions.
- SSH credentials should be assigned at end device level.
- The credentials of user assigned on the device must have permissions to create the required temporary files/folders in any one of the following directories:
/var/log,/home/$USER, or/home.
Supported Metric
| Monitor Name | Metric Name | Metric Display Name | Unit | Description |
|---|---|---|---|---|
| Gateway - Linux OS Performance Monitor - v4 | system.cpu.load | System CPU Load | Monitors the system's last 1min, 5min and 15min load. It sends per cpu core load average. | |
| system.os.uptime | System Uptime | m | Time lapsed since last reboot in minutes | |
| system.cpu.usage.stats | System CPU Usage Statistics | % | Monitors cpu time in percentage spent in various program spaces. User - The processor time spent running user space processes. System - The amount of time that the CPU spent running the kernel. IOWait - The time the CPU spends idle while waiting for an I/O operation to complete. Idle - The time the processor spends idle. Steal - The time virtual CPU has spent waiting for the hypervisor to service another virtual CPU running on a different virtual machine. Kernel Time, Total Time | |
| system.disk.usage.freespace | System FreeDisk Usage | GB | Monitors the Free Space usage in GB | |
| system.disk.usage.usedspace | System Disk UsedSpace | GB | Monitors disk used space in GB | |
| system.memory.usage.usedspace | System Memory Used Space | GB | Physical and virtual memory usage in GB | |
| system.disk.inode.utilization | System Disk Inode Utilization | % | This monitor is to collect DISK Inode metrics for all physical disks in a server. | |
| system.memory.usage.utilization | System Memory Utilization | % | Physical and virtual memory usage in percentage. | |
| system.disk.usage.utilization | System Disk Utilization | % | Monitors disk utilization in percentage | |
| system.cpu.usage.utilization | System CPU Utilization | % | The percentage of elapsed time that the processor spends to execute a non-Idle thread (This does not include CPU steal time) |
Gateway - Linux OS Performance Remote Monitoring - V3
Description
Template to monitor basic OS performance metrics and validated it on below Linux flavors: CentOS Linux 7 (core) ,Fedora 31 ,Suse Linux Enterprise Server 1 ,Ubuntu 18.04.5 Lts . Prerequisites: 1. Applicable on devices which are managed by Linux gateway 10.0.0 and above versions 2. SSH credentials should be assigned at device level. In version 3 of the template, we have corrected thresholds for disk usage free space metric.
Prerequisites
- Applicable on devices which are managed by Linux gateway 10.0.0 and above versions.
- SSH credentials should be assigned at device level.
- The credentials of user assigned on the device must have permissions to create the required temporary files/folders in any one of the following directories:
/var/log,/home/$USER, or/home.
Supported Metric
| Monitor Name | Metric Name | Metric Display Name | Unit | Description |
|---|---|---|---|---|
| Gateway - Linux OS Performance Monitor - v3 | system.cpu.load | System CPU Load | NULL | Monitors the system's last 1min,5min and 15min load. It sends per cpu core load average. |
| system.memory.usage.utilization | System Memory Utilization | % | Physical and virtual memory usage in percentage. | |
| system.disk.usage.utilization | System Disk Utilization | % | Monitors disk utilization in percentage | |
| system.os.uptime | System Uptime | m | Time lapsed since last reboot in minutes | |
| system.cpu.usage.stats | System CPU Usage Statistics | % | Monitors cpu time in percentage spent in various program spaces. User - The processor time spent running user space processes. System - The amount of time that the CPU spent running the kernel. IOWait - The time the CPU spends idle while waiting for an I/O operation to complete. Idle - The time the processor spends idle. Steal - The time virtual CPU has spent waiting for the hypervisor to service another virtual CPU running on a different virtual machine. Kernal Time,Total Time | |
| system.disk.usage.freespace | System FreeDisk Usage | GB | Monitors the Free Space usage in GB | |
| system.disk.usage.usedspace | System Disk UsedSpace | GB | Monitors disk used space in GB | |
| system.cpu.usage.utilization | System CPU Utilization | % | The percentage of elapsed time that the processor spends to execute a non-Idle thread(This does not include CPU steal time) | |
| system.memory.usage.usedspace | System Memory Used Space | GB | Physical and virtual memory usage in GB | |
| system.disk.inode.utilization | System Disk Inode Utilization | % | This monitor is to collect DISK Inode metrics for all physical disks in a server. |
Gateway - Linux OS Performance Remote Monitoring - V2
Description
Template to monitor basic OS performance metrics and validate it on below Linux flavors: CentOS Linux 7 (core),Fedora 31,Suse Linux Enterprise Server 1,Ubuntu 18.04.5 Lts
Prerequisites
- Applicable on devices which are managed by Linux gateway 10.0.0 and above versions.
- SSH credentials should be assigned at device level.
- The credentials of user assigned on the device must have permissions to create the required temporary files/folders in any one of the following directories:
/var/log,/home/$USER, or/home.
Supported Metric
| Monitor Name | Metric Name | Metric Display Name | Unit | Description |
|---|---|---|---|---|
| Gateway - Linux OS Performance Monitor - V2 | system.cpu.load | System CPU Load | NULL | Monitors the system's last 1min,5min and 15min load. It sends per cpu core load average. |
| system.memory.usage.utilization | System Memory Utilization | % | Physical and virtual memory usage in percentage. | |
| system.disk.usage.utilization | System Disk Utilization | % | Monitors disk utilization in percentage | |
| system.os.uptime | System Uptime | m | Time lapsed since last reboot in minutes | |
| system.cpu.usage.stats | System CPU Usage Statistics | % | Monitors cpu time in percentage spent in various program spaces. User - The processor time spent running user space processes. System - The amount of time that the CPU spent running the kernel. IOWait - The time the CPU spends idle while waiting for an I/O operation to complete. Idle - The time the processor spends idle. Steal - The time virtual CPU has spent waiting for the hypervisor to service another virtual CPU running on a different virtual machine. Kernal Time,Total Time | |
| system.disk.usage.freespace | System FreeDisk Usage | GB | Monitors the Free Space usage in GB | |
| system.disk.usage.usedspace | System Disk UsedSpace | GB | Monitors disk used space in GB | |
| system.cpu.usage.utilization | System CPU Utilization | % | The percentage of elapsed time that the processor spends to execute a non-Idle thread(This does not include CPU steal time) | |
| system.memory.usage.usedspace | System Memory Used Space | GB | Physical and virtual memory usage in GB | |
| system.disk.inode.utilization | System Disk Inode Utilization | % | This monitor is to collect DISK Inode metrics for all physical disks in a server. |
Gateway - Linux OS Performance Remote Monitoring
Description
Gateway - Linux OS Performance Remote Monitoring
Prerequisites
No prerequisite
Supported Metric
| Monitor Name | Metric Name | Metric Display Name | Unit | Description |
|---|---|---|---|---|
| Gateway - Linux OS Performance Monitor | system.cpu.load | System CPU Load | NULL | Monitors the system's last 1min,5min and 15min load. It sends per cpu core load average. |
| system.memory.usage.utilization | System Memory Utilization | % | Physical and virtual memory usage in percentage. | |
| system.disk.usage.utilization | System Disk Utilization | % | Monitors disk utilization in percentage | |
| system.os.uptime | System Uptime | m | Time lapsed since last reboot in minutes | |
| system.cpu.usage.stats | System CPU Usage Statistics | % | Monitors cpu time in percentage spent in various program spaces. User - The processor time spent running user space processes. System - The amount of time that the CPU spent running the kernel. IOWait - The time the CPU spends idle while waiting for an I/O operation to complete. Idle - The time the processor spends idle. Steal - The time virtual CPU has spent waiting for the hypervisor to service another virtual CPU running on a different virtual machine. Kernal Time,Total Time | |
| system.disk.usage.freespace | System FreeDisk Usage | GB | Monitors the Free Space usage in GB | |
| system.disk.usage.usedspace | System Disk UsedSpace | GB | Monitors disk used space in GB | |
| system.cpu.usage.utilization | System CPU Utilization | % | The percentage of elapsed time that the processor spends to execute a non-Idle thread(This does not include CPU steal time) | |
| system.memory.usage.usedspace | System Memory Used Space | GB | Physical and virtual memory usage in GB | |
| system.disk.inode.utilization | System Disk Inode Utilization | % | This monitor is to collect DISK Inode metrics for all physical disks in a server. |
Glassfish JVM Template
Description
Glassfish JVM Template
Prerequisites
No prerequisite
Supported Metric
| Monitor Name | Metric Name | Metric Display Name | Unit | Description |
|---|---|---|---|---|
| Glassfish JVM Monitor | glassfish.jvm.memorypool.codecache.peak_usage_used | Glassfish JVM Memorypool Codecache Peak Usage Used | Bytes | NULL |
| glassfish.jvm.memorypool.codecache.peak_usage_init | Glassfish JVM Memorypool Codecache Peak Usage Init | KB | NULL | |
| glassfish.jvm.memorypool.codecache.peak_usage_max | Glassfish JVM Memorypool Codecache Peak Usage Max | KB | NULL | |
| glassfish.jvm.memorypool.edenspace.peak_usage_used | Glassfish JVM Memorypool Edenspace Peak Usage Used | KB | NULL | |
| glassfish.jvm.memorypool.edenspace.peak_usage_committed | Glassfish JVM Memorypool.edenspace Peak Usage Committed | KB | NULL | |
| glassfish.jvm.memorypool.edenspace.peak_usage_init | Glassfish JVM Memorypool Edenspace Peak Usage Init | KB | NULL | |
| glassfish.jvm.memorypool.edenspace.peak_usage_max | Glassfish JVM Memorypool Edenspace Peak Usage Max | KB | NULL | |
| glassfish.jvm.memorypool.metaspace.peak_usage_used | Glassfish JVM Memorypool Metaspace Peak Usage Used | KB | NULL | |
| glassfish.jvm.memorypool.metaspace.peak_usage_committed | Glassfish JVM Memorypool.metaspace Peak Usage Committed | KB | NULL | |
| glassfish.jvm.memorypool.metaspace.peak_usage_init | Glassfish JVM Memorypool Metaspace Peak Usage Init | KB | NULL | |
| glassfish.jvm.memorypool.metaspace.peak_usage_max | Glassfish JVM Memorypool Metaspace Peak Usage Max | KB | NULL | |
| glassfish.jvm.memorypool.survivorspace.peak_usage_used | Glassfish JVM Memorypool Survivorspace Peak Usage | KB | NULL | |
| glassfish.jvm.memorypool.survivorspace.peak_usage_committed | Glassfish JVM Memorypool Survivorspace Peak Usage Committed | KB | NULL | |
| glassfish.jvm.memorypool.survivorspace.peak_usage_init | Glassfish JVM Memorypool Survivorspace Peak Usage Init | KB | NULL | |
| glassfish.jvm.memorypool.survivorspace.peak_usage_max | Glassfish JVM Memorypool Survivorspace Peak Usage Max | KB | NULL | |
| glassfish.jvm.memorypool.tenuredgen.peak_usage_used | Glassfish JVM Memorypool Tenuredgen Peak Usage Used | KB | NULL | |
| glassfish.jvm.memorypool.tenuredgen.peak_usage.init | Glassfish JVM Memorypool Tenuredgen Peak Usage Init | KB | NULL | |
| glassfish.jvm.memorypool.tenuredgen.peak_usage.max | Glassfish JVM Memorypool Tenuredgen Peak Usage Max | KB | NULL | |
| glassfish.jvm.memorypool.tenuredgen.peak_usage_committed | Glassfish JVM Memorypool Tenuredgen Peak Usage Committed | KB | NULL | |
| glassfish.jvm.memorypool.codecache.peak_usage_committed | Glassfish JVM Memorypool Codecache Peak Usage Committed | KB | NULL | |
| glassfish.jvm.gc.collection.count | Glassfish JVM GC Collection Count | count | The number of garbage collections that have ocurred. | |
| glassfish.jvm.gc.thread.count | Glasssfish JVM GC Thread Count | count | The total number of garbage collections that have occurred |
Glassfish Thread,Memory,Sessions Template
Description
Glassfish Thread,Memory,Sessions Template
Prerequisites
No prerequisite
Supported Metric
| Monitor Name | Metric Name | Metric Display Name | Unit | Description |
|---|---|---|---|---|
| Glassfish Memory Monitor | glassfish.memory.usedheapsize.count | Glassfish Memory Used Heap Size | Bytes | amount of used heap memory in bytes |
| glassfish.memory.usednonheapsize.count | Glassfish Memory Used Non Heap Size | Bytes | amount of used non heap size memory in bytes | |
| glassfish.memory.committedheapsize.count | Glassfish Memory Committed Heap Size | Bytes | amount of memory in bytes that is committed for the Java virtual machine to use | |
| glassfish.memory.committednonheapsize.count | Glassfish Memory Committed Non Heap Size | Bytes | amount of memory in bytes that is committed for the Java virtual machine to use | |
| glassfish.memory.maxheapsize.count | Glassfish Memory Max Heap Size | Bytes | maximum amount of heap memory in bytes that can be used for memory management | |
| glassfish.memory.maxnonheapsize.count | Glassfish Memory Max Non Heap Size | Bytes | maximum amount of non heap memory in bytes that can be used for memory management | |
| Glassfish Sessions Monitor | glassfish.activesessionscurrent | Glassfish Active Session Current | count | Number of active sessions |
| glassfish.activatedsessionstotal | Glassfish Total Activated Sessions | count | Total number of sessions ever activated | |
| glassfish.expiredsessionstotal | Glassfish Total Expired Sessions | count | Total number of sessions ever expired | |
| glassfish.passivatedsessionstotal | Glassfish Total Passivated Sessions | count | Total number of sessions ever passivated | |
| glassfish.persistedsessionstotal | Glassfish Total Persisted Sessions | count | Total number of sessions ever persisted | |
| glassfish.sessionstotal | Glassfish Total Sessions | count | Total number of sessions ever created | |
| glassfish.rejectedsessionstotal | Glassfish Total Rejected Sessios | count | Total number of sessions ever rejected | |
| Glassfish Thread Monitor | glassfish.totalstartedthreadcount | Glassfish Total Started Thread Count | count | Returns the total number of threads created and also started since the Java virtual machine started |
| glassfish.daemonthreadcount | Glassfish Daemon Thread Count | count | Returns the current number of live daemon threads | |
| glassfish.threadcount | Glassfish Thread Count | count | Returns the current number of live threads including both daemon and non-daemon threads |
Glassfish Transaction,Classes,System Stats Template
Description
Glassfish Transaction,Classes,System Stats Template
Prerequisites
No prerequisite
Supported Metric
| Monitor Name | Metric Name | Metric Display Name | Unit | Description |
|---|---|---|---|---|
| Glassfish Classes Monitor | glassfish.loadedclass.count | Glassfish Loaded Class Count | count | number of classes currently loaded in the JVM |
| glassfish.unloadedclass.count | Glassfish UnLoaded Count | count | Total number of classes unloaded since the JVM started | |
| glassfish.totalservletsloaded.count | Glassfish Total Servlets Loaded | count | Total number of Servlets ever loaded | |
| glassfish.activeservletsloaded.count | Glassfish Active Servlets Loaded | count | Number of Servlets loaded | |
| glassfish.jsp.totaljspcount | Glassfish JSP Total Count | count | Total number of JSP pages ever loaded | |
| glassfish.jsp.jsperrorcount | Glassfish JSP Error Count | count | Total number of errors triggered by JSP page invocations | |
| glassfish.jsp.jspreloadedcount | Glassfish JSP Reloaded Count | count | Total number of JSP pages that were reloaded | |
| glassfish.jsp.jspcount | Glassfish JSP Count | count | Number of active JSP pages | |
| Glassfish System Stats Monitor | glassfish.jvm.uptime | Glassfish JVM Uptime | ms | uptime of the Java virtual machine in milliseconds |
| glassfish.servlet.processingtime | Glassfish Servlet Processing Time | ms | Average response time | |
| glassfish.request.processingtime | Glassfish Request Processing Time | ms | Average request processing time | |
| glassfish.request.errorcount | Glassfish Request Error Count | count | Cumulative value of the error count,with error count representing the number of cases where the response code was greater than or equal to 400 | |
| glassfish.request.requestcount | Glassfish Request Request Count | count | Cumulative number of requests processed so far | |
| Glassfish Transaction Monitor | glassfish.transaction.committedcount | Glassfish Transaction Committed Count | count | Provides the number of transactions that have been committed. |
| glassfish.transaction.rolledbackcount | Glassfish Transaction Rolledback Count | count | Provides the number of transactions that have been rolled back. | |
| glassfish.transaction.activecount | Glassfish Transaction Active Count | count | Provides the number of transactions that are currently active. | |
| glassfish.transaction.service.state | Glassfish Transaction State | NULL | Indicates if the transaction service has been frozen. |
HBase Master JVM Template
Description
HBase Master JVM Template
Prerequisites
No prerequisite
Supported Metric
| Monitor Name | Metric Name | Metric Display Name | Unit | Description |
|---|---|---|---|---|
| HBase Master JVM Monitor | hbase.jvm.thread.count | HBase JVM Thread Count | count | Displays the number of active threads in the system. |
| hbase.jvm.thread.peakcount | HBase JVM Thread PeakCount | count | peak number of threads running in the JVM since it started. | |
| hbase.jvm.heap_memory_init | HBase JVM Heap Memory Init | Bytes | The initial Java heap memory allocated. | |
| hbase.jvm.heap_memory_max | HBase JVM Heap Memory Max | Bytes | The maximum Java heap memory available. | |
| hbase.jvm.non_heap_memory_committed | HBase JVM Non Heap Memory Committed | Bytes | The total Java non-heap memory committed to be used. | |
| hbase.jvm.non_heap_memory_init | HBase JVM Non Heap Memory Init | Bytes | The initial Java non-heap memory allocated. | |
| hbase.jvm.non_heap_memory_used | HBase JVM Non Heap Memory Used | Bytes | The total Java non-heap memory used. | |
| hbase.jvm.non_heap_memory_max | HBase JVM Non Heap Memory Max | Bytes | The maximum Java non-heap memory available. | |
| hbase.jvm.memorypool.codecache.peak_usage_used | HBase JVM MemoryPool Codecache Peak Usage Used | KB | Displays the peak usage of code cache in kilo bytes | |
| hbase.jvm.memorypool.codecache.peak_usage_init | HBase JVM MemoryPool Codecache Peak Usage Init | KB | Displays the initial peak usage max of code cache in kilo bytes | |
| hbase.jvm.memorypool.edenspace.peak_usage_max | HBase JVM MemoryPol Edenspace Peak Usage Max | KB | Displays the maximum peak usage max of edenspace in kilo bytes | |
| hbase.jvm.memorypool.edenspace.peak_usage_init | HBase JVM MemoryPool Edenspace Peak Usage Init | KB | Displays the initial peak usage of edenspace in kilo bytes | |
| hbase.jvm.memorypool.edenspace.peak_usage_committed | HBase JVM MemoryPool Edenspace Peak Usage Committed | KB | The total edenspace memory committed to be used | |
| hbase.jvm.memorypool.metaspace.peak_usage_init | HBase JVM MemoryPool Metaspace Peak Usage Init | KB | Displays the initial peak usage of metaspace in kilo bytes | |
| hbase.jvm.memorypool.metaspace.peak_usage_used | HBase JVM MemoryPool Metaspace Peak Usage Used | KB | Displays the peak usage of metaspace in kilo bytes | |
| hbase.jvm.memorypool.metaspace.peak_usage_max | HBase JVM MemoryPool Metaspace Peak Usage Max | KB | Displays the maximum peak usage of metaspace in kilo bytes | |
| hbase.jvm.memorypool.metaspace.peak_usage_committed | HBase JVM MemoryPool Metaspace Peak Usage Committed | KB | The total metaspace memory committed to be used | |
| hbase.jvm.memorypool.survivorspace.peak_usage_used | HBase JVM MemoryPool Survivorspace Peak Usage Used | KB | Displays the peak usage of survivorspace in kilo bytes | |
| hbase.jvm.memorypool.survivorspace.peak_usage_init | HBase JVM MemoryPool Survivorspace Peak Usage Init | KB | Displays the initial peak usage max of survivorspace in kilo bytes | |
| hbase.jvm.memorypool.survivorspace.peak_usage_max | HBase JVM MemoryPol SurvivorspacePeak Usage Max | KB | Displays the peak maximum usage of survivorspace in kilo bytes | |
| hbase.jvm.memorypool.survivorspace.peak_usage_committed | HBase JVM MemoryPool Survivorspace Peak Usage Committed | KB | The total survivorspace memory committed to be used | |
| hbase.jvm.memorypool.tenuredgen.peak_usage | HBase JVM MemoryPool Tenuredgen Peak Usage | KB | Displays the peak usage of tenuredgen in kilo bytes | |
| hbase.jvm.memorypool.tenuredgen.peak_usage.init | HBase JVM MemoryPool Tenuredgen Peak Usage Init | KB | Displays the initial peak usage max of tenuredgen in kilo bytes | |
| hbase.jvm.memorypool.tenuredgen.peak_usage.max | HBase JVM MemoryPool Tenuredgen Peak Usage Max | KB | Displays the peak maximum usage of tenuredgen in kilo bytes | |
| hbase.jvm.memorypool.tenuredgen.peak_usage_committed | HBase JVM MemoryPol Edenspace Peak Usage Committed | KB | The total tenuredgen memory committed to be used | |
| hbase.jvm.gc.collection.count | HBase JVM GC Collection Count | count | the number of garbage collections that have ocurred. | |
| hbase.jvm.gc.thread.count | HBase JVM GC Thread Count | count | The total number of garbage collections that have occurred | |
| hbase.jvm.totalstartedthread.count | HBase JVM TotalStartedThread Count | count | Displays the number of threads marked as daemons in the system. | |
| hbase.jvm.daemonthread.count | HBase JVM Daemonthread Count | count | Displays the number of threads marked as daemons in the system. | |
| hbase.jvm.heap_memory_used | HBase JVM Heap Memory Used | Bytes | The total Java heap memory used. | |
| hbase.jvm.heap_memory_committed | HBase JVM Heap Memory Committed | Bytes | The total Java heap memory committed to be used. | |
| hbase.jvm.memorypool.codecache.peak_usage_max | HBase JVM MemoryPool Codecache Peak Usage Max | KB | Displays the maximum peak usage of code cache in kilo bytes | |
| hbase.jvm.memorypool.codecache.peak_usage_committed | HBase JVM MemoryPool Codecache Peak Usage Committed | KB | The total codecache memory committed to be used | |
| hbase.jvm.memorypool.edenspace.peak_usage_used | HBase JVM MemoryPool Edenspace Peak Usage Used | KB | Displays the peak usage of edenspace in kilo bytes |
HBase Master Performance Template
Description
HBase Master Performance Template
Prerequisites
No prerequisite
Supported Metric
| Monitor Name | Metric Name | Metric Display Name | Unit | Description |
|---|---|---|---|---|
| HBase Master Performance Monitor | hbase.master.regionservers.count | HBase Master RegionServers Count | count | Number of live regionservers |
| hbase.master.deadregionservers.count | HBase Master Dead RegionServers Count | count | Number of dead regionservers | |
| hbase.master.starttime | HBase Master StartTime | ms | Master Start Time | |
| hbase.master.activetime | HBase Master ActiveTime | ms | Master Active Time | |
| hbase.master.clusterrequests | HBase Master ClusterRequests | Req per Sec | Cluster requests | |
| hbase.master.ritcount | HBase Master RitCount | count | The number of regions in transition | |
| hbase.master.ritcountoverthreshold | HBase Master RitCount Overthreshold | count | The number of regions that have been in transition longer than a threshold time (default: 60 seconds) | |
| hbase.master.ritoldestage | HBase Master Ritoldestage | NULL | The age of the longest region in transition,in milliseconds | |
| hbase.master.openconnections.count | HBase Master OpenConnections Count | count | Number of open connections. | |
| hbase.master.activehandler.count | HBase Master ActiveHandler Count | count | Number of active rpc handlers. | |
| hbase.master.receivedbytes | HBase Master ReceivedBytes | Bytes | Number of bytes received. | |
| hbase.master.assignmin | HBase Master Assignmin | ms | Assign Region Min | |
| hbase.master.assignmax | HBase Master AssignMax | ms | Assign Region Max | |
| hbase.master.assignmean | HBase Master AssignMean | ms | Assign Region Mean | |
| hbase.master.assignmedian | HBase Master AssignMedian | ms | Assign Region Median | |
| hbase.master.assign99thpercentile | HBase Master Assign99thpercentile | ms | Assign Region Time 99% | |
| hbase.master.queuesize | HBase Master QueueSize | Bytes | Number of bytes in the call queues. | |
| hbase.master.callsingeneralqueue.count | HBase Master Callsingeneralqueue Count | count | Number of calls in the general call queue. | |
| hbase.master.callsinreplicationqueue.count | HBase Master Callsinreplicationqueue Count | count | Number of calls in the replication call queue. | |
| hbase.master.callsinpriorityqueue.count | HBase Master Callsinpriorityqueue Count | count | Number of calls in the priority call queue. | |
| hbase.master.totalcalltime.max | HBase Master Totalcalltime Max | ms | total call time,including both queued and processing time. | |
| hbase.master.totalcalltime.min | HBase Master Totalcalltime Min | ms | total call time,including both queued and processing time. | |
| hbase.master.totalcalltime.mean | HBase Master Totalcalltime Mean | ms | total call time,including both queued and processing time. | |
| hbase.master.totalcalltime.median | HBase Master Totalcalltime Median | ms | total call time,including both queued and processing time. | |
| hbase.master.totalcalltime.99thpercentile | HBase Master Totalcalltime 99thpercentile | ms | total call time,including both queued and processing time. | |
| hbase.master.tag.isactivemaster | HBase Master Tag Isactivemaster | NULL | Is Active Master |
HBase Regionserver Jvm Template
Description
testing
Prerequisites
No prerequisite
Supported Metric
| Monitor Name | Metric Name | Metric Display Name | Unit | Description |
|---|---|---|---|---|
| HBase Regionserver Jvm Monitor | hbase.regionserver.jvm.daemonthread.count | HBase Regionserver JVM Daemonthread Count | count | Displays the number of threads marked as daemons in the system. |
| hbase.regionserver.jvm.gc.collection.count | HBase Regionserver JVM GC Collection Count | count | The number of garbage collections that have ocurred. | |
| hbase.regionserver.jvm.gc.thread.count | HBase Regionserver JVM GC Thread Count | count | The total number of garbage collections that have occurred | |
| hbase.regionserver.jvm.heap_memory_committed | HBase Regionserver JVM Heap Memory Committed | Bytes | The total Java heap memory committed to be used. | |
| hbase.regionserver.jvm.heap_memory_init | HBase Regionserver JVM Heap Memory Init | Bytes | The initial Java heap memory allocated. | |
| hbase.regionserver.jvm.heap_memory_max | HBase Regionserver JVM Heap Memory Max | Bytes | The maximum Java heap memory available. | |
| hbase.regionserver.jvm.heap_memory_used | HBase Regionserver JVM Heap Memory Used | Bytes | The total Java heap memory used. | |
| hbase.regionserver.jvm.memorypool.cmsoldgen.peak_usage | HBase Regionserver JVM Memorypool Cmsoldgen Peak Usage | KB | Displays the peak usage of cmsoldgen in kilo bytes | |
| hbase.regionserver.jvm.memorypool.cmsoldgen.peak_usage.init | HBase Regionserver JVM Memorypool Cmsoldgen Peak Usage Init | KB | Displays the initial peak usage max of cmsoldgen in kilo bytes | |
| hbase.regionserver.jvm.memorypool.cmsoldgen.peak_usage.max | HBase Regionserver JVM Memorypool Cmsoldgen Peak Usage Max | KB | Displays the peak maximum usage of cmsoldgen in kilo bytes | |
| hbase.regionserver.jvm.memorypool.cmsoldgen.peak_usage_committed | HBase Regionserver JVM Memorypool Cmsoldgen Peak Usage Committed | KB | The total cmsoldgen memory committed to be used | |
| hbase.regionserver.jvm.memorypool.codecache.peak_usage_committed | HBase Regionserver JVM Memorypool Codecache Peak Usage Committed | KB | The total codecache memory committed to be used | |
| hbase.regionserver.jvm.memorypool.codecache.peak_usage_init | HBase Regionserver JVM Memorypool Codecache Peak Usage Init | KB | Displays the initial peak usage max of code cache in kilo bytes | |
| hbase.regionserver.jvm.memorypool.codecache.peak_usage_max | HBase Regionserver JVM Memorypool Codecache Peak Usage Max | KB | Displays the maximum peak usage of code cache in kilo bytes | |
| hbase.regionserver.jvm.memorypool.codecache.peak_usage_used | HBase Regionserver JVM Memorypool Codecache Peak Usage Used | KB | Displays the peak usage of code cache in kilo bytes | |
| hbase.regionserver.jvm.memorypool.edenspace.peak_usage_committed | HBase Regionserver JVM Memorypool Par Eden Space Peak Usage Committed | KB | The total Par Eden Space memory committed to be used | |
| hbase.regionserver.jvm.memorypool.edenspace.peak_usage_init | HBase Regionserver JVM Memorypool Par edenspace Peak Usage Init | KB | Displays the initial peak usage of paredenspace in kilo bytes | |
| hbase.regionserver.jvm.memorypool.edenspace.peak_usage_max | HBase Regionserver JVM Memorypool Pardenspace Peak Usage Max | KB | Displays the maximum peak usage max of Paredenspace in kilo bytes | |
| hbase.regionserver.jvm.memorypool.edenspace.peak_usage_used | HBase Regionserver JVM Memorypool Pardenspace Peak Usage Used | KB | Displays the peak usage of paredenspace in kilo bytes | |
| hbase.regionserver.jvm.memorypool.metaspace.peak_usage_committed | HBase Regionserver JVM Memorypool Metaspace Peak Usage Committed | KB | The total metaspace memory committed to be used | |
| hbase.regionserver.jvm.memorypool.metaspace.peak_usage_init | HBase Regionserver JVM Memorypool Metaspace Peak Usage Init | KB | Displays the initial peak usage of metaspace in kilo bytes | |
| hbase.regionserver.jvm.memorypool.metaspace.peak_usage_max | HBase Regionserver JVM Memorypool Metaspace Peak Usage Max | KB | Displays the maximum peak usage of metaspace in kilo bytes | |
| hbase.regionserver.jvm.memorypool.metaspace.peak_usage_used | HBase Regionserver JVM Memorypool Metaspace Peak Usage Used | KB | Displays the peak usage of metaspace in kilo bytes | |
| hbase.regionserver.jvm.memorypool.survivorspace.peak_usage_committed | HBase Regionserver JVM Memorypool Parsurvivorspace Peak Usage Committed | KB | The total parsurvivorspace memory committed to be used | |
| hbase.regionserver.jvm.memorypool.survivorspace.peak_usage_init | HBase Regionserver JVM Memorypool Parsurvivorspace Peak Usage Init | KB | Displays the initial peak usage max of parsurvivorspace in kilo bytes | |
| hbase.regionserver.jvm.memorypool.survivorspace.peak_usage_max | HBase Regionserver JVM Memorypool Parsurvivorspace Peak Usage Max | KB | Displays the peak maximum usage of parsurvivorspace in kilo bytes | |
| hbase.regionserver.jvm.memorypool.survivorspace.peak_usage_used | HBase Regionserver JVM Memorypool ParSurvivorspace Peak Usage Used | KB | Displays the peak usage of parsurvivorspace in kilo bytes | |
| hbase.regionserver.jvm.non_heap_memory_committed | HBase Regionserver JVM Non Heap Memory Committed | Bytes | The total Java non-heap memory committed to be used. | |
| hbase.regionserver.jvm.non_heap_memory_init | HBase Regionserver JVM Non Heap Memory Init | Bytes | The initial Java non-heap memory allocated. | |
| hbase.regionserver.jvm.non_heap_memory_max | HBase Regionserver JVM Non Heap Memory Max | Bytes | The maximum Java non-heap memory available. | |
| hbase.regionserver.jvm.non_heap_memory_used | HBase Regionserver JVM Non Heap Memory Used | Bytes | The total Java non-heap memory used. | |
| hbase.regionserver.jvm.thread.count | HBase Regionserver JVM Thread Count | count | Displays the number of active threads in the system. | |
| hbase.regionserver.jvm.thread.peakcount | HBase Regionserver JVM Thread Peak Count | count | peak number of threads running in the JVM since it started. | |
| hbase.regionserver.jvm.totalstartedthread.count | HBase Regionserver JVM Totalstartedthread Count | count | Displays the number of threads marked as daemons in the system. |
HBase Regionserver Template
Description
HBase Regionserver Template
Prerequisites
No prerequisite
Supported Metric
| Monitor Name | Metric Name | Metric Display Name | Unit | Description |
|---|---|---|---|---|
| HBase Regionserver Monitor | hbase.regionserver.ipc.queue_size | HBase Region Server IPC Queue Size | Bytes | Number of bytes in the call queues. |
| hbase.regionserver.ipc.num_open_connections | HBase Region Server IPC Number of Open Connections | count | Number of open connections. | |
| hbase.regionserver.ipc.num_active_handler | HBase Region Server IPC Num Active Handler | count | The number of active RPC handlers. | |
| hbase.regionserver.ipc.total_call_time_max | HBase Region Server IPC Total Call Time Max | ms | Total call time,including both queued and processing time. | |
| hbase.regionserver.regions.num_regions | HBase Region Server Regions Num Regions | count | Number of regions in the metrics system | |
| hbase.regionserver.server.region_count | HBase Region Server Region Count for Server | count | Number of regions | |
| hbase.regionserver.server.store_count | HBase Region Server Store Count for Server | count | Number of Stores | |
| hbase.regionserver.server.hlog_file_count | HBase Region Server Hlog File Count for Server | count | Number of WAL Files | |
| hbase.regionserver.server.hlog_file_size | HBase Region Server Hlog File Size for Server | Bytes | Size of all WAL Files | |
| hbase.regionserver.server.store_file_count | HBase Region Server Store File Count for Server | count | Number of Store Files | |
| hbase.regionserver.server.mem_store_size | HBase Region Server Mem Store Size for Server | Bytes | Size of the mem store | |
| hbase.regionserver.server.store_file_size | HBase Region Server Store File Size for Server | Bytes | Size of store files being served. | |
| hbase.regionserver.server.total_request_count | HBase Region Server Total Request Count for Server | count | A total number of requests this RegionServer has answered. | |
| hbase.regionserver.server.read_request_count | HBase Region Server Read Request Count for Server | count | The number of reading requests this region server has answered. | |
| hbase.regionserver.wal.append_time.num_ops | HBase Regionserver WAL Appen Time Num Ops | ms | Time an append to the log took. | |
| hbase.regionserver.server.write_request_count | HBase Region Server Write Request Count for Server | count | Number of Checks and Mutate calls that failed the checks. | |
| hbase.regionserver.wal.low_replica_roll_request | HBase Regionserver WAL Low Replica Roll Request | ms | How many times a log roll was requested due to too few DN's in the write pipeline. | |
| hbase.regionserver.server.check_mutate_passed_count | HBase Region Server Check Mutate Passed Count for Server | count | Number of Checks and Mutate calls that passed the checks. | |
| hbase.regionserver.wal.append_count | HBase Regionserver WAL Append Count | count | Number of appends to the write ahead log. | |
| hbase.regionserver.wal.roll_request | HBase Regionserver WAL Roll Request | ms | How many times a log roll has been requested total | |
| hbase.regionserver.wal.slow_append_count | HBase Regionserver WAL Slow Append Count | count | Number of appends that were slow. | |
| hbase.regionserver.wal.sync_time.num_ops | HBase Regionserver WAL Sync Time Num Ops | ms | The time it took to sync the WAL to HDFS. | |
| hbase.regionserver.wal.append_size.num_ops | HBase Regionserver WAL Append Size Num Ops | Bytes | Size (in bytes) of the data appended to the WAL. | |
| hbase.regionserver.server.slow_get_count | HBase Regionserver Server Slow Get Count | count | The number of Gets that took over 1000ms to complete | |
| hbase.regionserver.server.split_success_count | HBase Regionserver Server Split Success Count | count | Number of successfully executed splits | |
| hbase.regionserver.server.split_request_count | HBase Regionserver Server Split Request Count | count | Number of splits requested | |
| hbase.regionserver.server.slow_delete_count | HBase Regionserver Server Slow Delete Count | count | The number of Deletes that took over 1000ms to complete | |
| hbase.regionserver.server.slow_append_count | HBase Regionserver Server Slow Append Count | count | The number of Appends that took over 1000ms to complete | |
| hbase.regionserver.server.blocked_request_count | HBase Regionserver Server Blocked Request Count | count | The number of blocked requests because of memstore size is larger than blockingMemStoreSize | |
| hbase.regionserver.server.major_compacted_cells_size | HBase Regionserver Server Major Compacted Cells Size | Bytes | The total amount of data processed during major compactions,in bytes | |
| hbase.regionserver.server.compacted_cells_size | HBase Regionserver Server Compacted Cells Size | Bytes | The total amount of data processed during minor compactions,in bytes | |
| hbase.regionserver.server.flushed_cells_size | HBase Regionserver Server Flushed Cells Size | Bytes | The total amount of data flushed to disk,in bytes | |
| hbase.regionserver.server.major_compacted_cells_count | HBase Regionserver Server Major Compacted Cells Count | count | The number of cells processed during major compactions | |
| hbase.regionserver.server.compacted_cells_count | HBase Regionserver Server Compacted Cells Count | count | The number of cells processed during minor compactions | |
| hbase.regionserver.server.flushed_cells_count | HBase Regionserver Server Flushed Cells Count | count | The number of cells flushed to disk | |
| hbase.regionserver.server.updates_blocked_time | HBase Regionserver Server Updates Blocked Time | ms | Number of MS updates have been blocked so that the memstore can be flushed. | |
| hbase.regionserver.server.block_cache_failed_insertion_count | HBase Regionserver Server Block Cache Failed Insertion Count | ms | Number of times that a block cache insertion failed. Usually due to size restrictions. | |
| hbase.regionserver.server.block_cache_express_hit_percent | HBase Regionserver Server Block Cache Express Hit Percent | % | The percent of the time that requests with the cache turned on hit the cache. | |
| hbase.regionserver.server.block_cache_hit_percent | HBase Regionserver Server.block Cache Hit Percent | % | Percent of block cache requests that are hits | |
| hbase.regionserver.server.block_cache_eviction_count_primary | HBase Regionserver Server Block Cache Eviction Count Primary | count | Count of the number of blocks evicted from primary replica in the block cache. | |
| hbase.regionserver.server.block_cache_eviction_count | HBase Regionserver Server Block Cache Eviction Count | count | Count of the number of blocks evicted from the block cache. | |
| hbase.regionserver.server.block_cache_miss_count_primary | HBase Regionserver Server Block Cache Miss Count Primary | count | Number of requests for a block of primary replica that missed the block cache. | |
| hbase.regionserver.server.block_cache_miss_count | HBase Regionserver Server Block Cache Miss Count | count | Number of requests for a block that missed the block cache. | |
| hbase.regionserver.server.block_cache_hit_count_primary | HBase Regionserver Server Block Cache Hit Count Primary | count | Count of hit on primary replica in the block cache. | |
| hbase.regionserver.server.block_cache_hit_count | HBase Regionserver Server Block Cache Hit Count | count | Count of the hit on the block cache. | |
| hbase.regionserver.server.block_cache_size | HBase Regionserver Server Block Cache Size | Bytes | Size of the block cache. | |
| hbase.regionserver.server.block_cache_count | HBase Regionserver Server Block Cache Count | count | Number of block in the block cache. | |
| hbase.regionserver.server.block_cache_free_size | HBase Regionserver Server Block Cache Free Size | Bytes | Size of the block cache that is not occupied. | |
| hbase.regionserver.server.flush_queue_length | HBase Regionserver Server Flush Queue Length | count | Length of the queue for region flushes | |
| hbase.regionserver.server.compaction_queue_length | HBase Regionserver Server Compaction Queue Length | count | Length of the queue for compactions. | |
| hbase.regionserver.server.split_queue_length | HBase Regionserver Server Split Queue Length | count | Length of the queue for splits. | |
| hbase.regionserver.server.percent_files_local_secondary_regions | HBase Regionserver Server Percent Files Local Secondary Regions | % | The percent of HFiles used by secondary regions that are stored on the local hdfs data node. | |
| hbase.regionserver.server.percent_files_local | HBase Regionserver Server Percent Files Local | % | The percent of HFiles that are stored on the local hdfs data node. | |
| hbase.regionserver.server.mutations_without_wal_size | HBase Regionserver Server Mutations Without Wal Size | Bytes | Size of data that has been sent by clients with the write ahead logging turned off. | |
| hbase.regionserver.server.mutations_without_wal_count | HBase Regionserver Server Mutations Without Wal Count | count | Number of mutations that have been sent by clients with the write ahead logging turned off. | |
| hbase.regionserver.server.static_bloom_size | HBase Regionserver Server Static Bloom Size | Bytes | Uncompressed size of the static bloom filters. | |
| hbase.regionserver.server.static_index_size | HBase Regionserver Server Static Index Size | Bytes | Uncompressed size of the static indexes. | |
| hbase.regionserver.server.store_file_index_size | HBase Regionserver Server Store File Index Size | Bytes | Size of indexes in storefiles on disk. |
HBase Sample Template
Description
testing
Prerequisites
No prerequisite
Supported Metric
| Monitor Name | Metric Name | Metric Display Name | Unit | Description |
|---|---|---|---|---|
| HBase Sample Monitor | hbase.regionserver.ipc.queue_size | HBase Region Server IPC Queue Size | Bytes | Number of bytes in the call queues. |
HDFS DataNode Template
Description
HDFS DataNode Template
Prerequisites
No prerequisite
Supported Metric
| Monitor Name | Metric Name | Metric Display Name | Unit | Description |
|---|---|---|---|---|
| HDFS DataNode JVM Monitor | hdfs.datanode.memory.non.heap.used | HDFS DataNode Non Heap Memory Used | MB | Current non-heap memory used in MB |
| hdfs.datanode.memory.non.heap.committed | HDFS DataNode Non Heap Memory Committed | MB | Current non-heap memory committed in MB | |
| hdfs.datanode.memory.non.heap.max | HDFS DataNode Non Heap Memory Max | MB | Max non-heap memory size in MB | |
| hdfs.datanode.memory.heap.used | HDFS DataNode Heap Memory Used | MB | Current heap memory used in MB | |
| hdfs.datanode.memory.heap.committed | HDFS DataNode Heap Memory Committed | MB | Current heap memory committed in MB | |
| hdfs.datanode.memory.heap.max | HDFS DataNode Heap Memory Max | MB | Max heap memory size in MB | |
| hdfs.datanode.memory.max | HDFS DataNode Max Memory | MB | Max memory size in MB | |
| hdfs.datanode.threads.new | HDFS DataNode New Threads | count | Current number of NEW threads | |
| hdfs.datanode.threads.runnable | HDFS DataNode Runnable Threads | count | Current number of RUNNABLE threads | |
| hdfs.datanode.threads.blocked | HDFS DataNode Blocked Threads | count | Current number of BLOCKED threads | |
| hdfs.datanode.threads.waiting | HDFS DataNode Waiting Threads | count | Current number of WAITING threads | |
| hdfs.datanode.threads.timed.waiting | HDFS DataNode Timed Waiting Threads | count | Current number of TIMED_WAITING threads | |
| hdfs.datanode.threads.terminated | HDFS DataNode Terminated Threads | count | Current number of TERMINATED threads | |
| HDFS DataNode Monitor | hdfs.datanode.dfs.remaining | HDFS DataNode DFS Remaining | Bytes | The remaining disk space left |
| hdfs.datanode.dfs.capacity | HDFS DataNode DFS Capacity | Bytes | Total configured HDFS storage capacity | |
| hdfs.datanode.dfs.used | HDFS DataNode DFS Used | Bytes | Total HDFS storage used | |
| hdfs.datanode.cache.capacity | HDFS DataNode Cache Capacity | Bytes | The capacity of the HDFS cache on this DataNode. | |
| hdfs.datanode.cache.used | HDFS DataNode Cache Used | Bytes | The total cache used. | |
| hdfs.datanode.last.volume.failure.date | HDFS DataNode Last Volume Failure Date | ms | The date/time of the last volume failure in milliseconds since epoch | |
| hdfs.datanode.estimated.capacity.lost.total | HDFS DataNode Total Lost Estimated Capacity | Bytes | The estimated capacity lost in bytes | |
| hdfs.datanode.num.blocks.cached | HDFS DataNode Blocks Cached Number | count | The number of blocks cached | |
| hdfs.datanode.num.blocks.failed.to.cache | HDFS DataNode Blocks Failed To Cache Number | count | The total number of blocks the DataNode failed to cache. | |
| hdfs.datanode.num.blocks.failed.to.uncache | HDFS DataNode Blocks Failed To Uncache Number | count | The total number of blocks the DataNode failed to uncache. | |
| hdfs.datanode.num.failed.volumes | HDFS DataNode Failed Volumes Number | count | Total number of failed volumes |
HDFS DataNode Template Monitor
Description
HDFS DataNode Template Monitor
Prerequisites
No prerequisite
Supported Metric
| Monitor Name | Metric Name | Metric Display Name | Unit | Description |
|---|---|---|---|---|
| HDFS DataNode Monitor | hdfs.datanode.dfs.remaining | HDFS DataNode DFS Remaining | Bytes | The remaining disk space left |
| hdfs.datanode.dfs.capacity | HDFS DataNode DFS Capacity | Bytes | Total configured HDFS storage capacity | |
| hdfs.datanode.dfs.used | HDFS DataNode DFS Used | Bytes | Total HDFS storage used | |
| hdfs.datanode.cache.capacity | HDFS DataNode Cache Capacity | Bytes | The capacity of the HDFS cache on this DataNode. | |
| hdfs.datanode.cache.used | HDFS DataNode Cache Used | Bytes | The total cache used. | |
| hdfs.datanode.last.volume.failure.date | HDFS DataNode Last Volume Failure Date | ms | The date/time of the last volume failure in milliseconds since epoch | |
| hdfs.datanode.estimated.capacity.lost.total | HDFS DataNode Total Lost Estimated Capacity | Bytes | The estimated capacity lost in bytes | |
| hdfs.datanode.num.blocks.cached | HDFS DataNode Blocks Cached Number | count | The number of blocks cached | |
| hdfs.datanode.num.blocks.failed.to.cache | HDFS DataNode Blocks Failed To Cache Number | count | The total number of blocks the DataNode failed to cache. | |
| hdfs.datanode.num.blocks.failed.to.uncache | HDFS DataNode Blocks Failed To Uncache Number | count | The total number of blocks the DataNode failed to uncache. | |
| hdfs.datanode.num.failed.volumes | HDFS DataNode Failed Volumes Number | count | Total number of failed volumes |
HDFS NameNode Template
Description
HDFS NameNode Template
Prerequisites
No prerequisite
Supported Metric
| Monitor Name | Metric Name | Metric Display Name | Unit | Description |
|---|---|---|---|---|
| HDFS NameNode JVM Monitor | hdfs.namenode.non.heap.memory.used | HDFS Namenode Non Heap Memory Used | MB | Current non-heap memory used in MB |
| hdfs.namenode.non_heap_memory_committed | HDFS Namenode Non Heap Memory Committed | MB | Current non-heap memory committed in MB | |
| hdfs.namenode.non_heap_memory_max | HDFS Namenode Non Heap Memory Max | MB | Max non-heap memory size in MB | |
| hdfs.namenode.heap_memory_used | HDFS Namenode Heap Memory Used | MB | Current heap memory used in MB | |
| hdfs.namenode.heap_memory_committed | HDFS Namenode Heap Memory Committed | MB | Current heap memory committed in MB | |
| hdfs.namenode.heap_memory_max | HDFS Namenode Heap Memory Max | NULL | Max heap memory size in MB | |
| hdfs.namenode.max.memory | HDFS Namenode Max Memory | NULL | JVM Max memory size in MB | |
| hdfs.namenode.threads_new | HDFS Namenode New Threads | count | Current number of NEW threads | |
| hdfs.namenode.threads_blocked | HDFS Namenode Blocked Threads | count | Current number of BLOCKED threads | |
| hdfs.namenode.threads_waiting | HDFS Namenode Waiting Threads | count | Current number of WAITING threads | |
| hdfs.namenode.threads_timed_waiting | HDFS Namenode Timed Waiting Threads | count | Current number of TIMED_WAITING threads | |
| hdfs.namenode.threads_terminated | HDFS Namenode Terminated Threads | count | Current number of TERMINATED threads | |
| hdfs.namenode.threads_runnable | HDFS Namenode Runnable Threads | count | Current number of RUNNABLE threads | |
| HDFS NameNode Monitor | hdfs.namenode.blocks.total | HDFS Namenode Total blocks | count | Total number of allocated blocks in the system |
| hdfs.namenode.capacity.remaining | HDFS Namenode Remaining Capacity | Bytes | Remaining disk space left in bytes | |
| hdfs.namenode.capacity.used | HDFS Namenode Used Capacity | Bytes | Capacity used by Namenodes. | |
| hdfs.namenode.capacity.total | HDFS Namenode Total Capacity | Bytes | Total capacity of the Namenode in bytes | |
| hdfs.namenode.files.total | HDFS Namenode Total Files | count | Total number of files | |
| hdfs.namenode.total.load | HDFS Namenode Total Load | count | Total load on the file system | |
| hdfs.namenode.scheduled.replication.blocks | HDFS Namenode Scheduled Replication Blocks | count | Current number of blocks scheduled for replications. | |
| hdfs.namenode.pending.deletion.blocks | HDFS Namenode Pending Deletion Blocks | count | Current number of blocks pending for deletion. | |
| hdfs.namenode.under.replicated.blocks | HDFS Namenode Under Replicated Blocks | count | Number of under replicated blocks | |
| hdfs.namenode.pending.replication.blocks | HDFS Namenode Pending Replication Blocks | count | Number of blocks pending for replication. | |
| hdfs.namenode.max.objects | HDFS Namenode Max Objects | count | Maximum number of files HDFS supports. | |
| hdfs.namenode.num.live.data.nodes | HDFS Namenode Live Data Nodes | count | Total number of live data nodes. | |
| hdfs.namenode.num.dead.data.nodes | HDFS Namenode Total Dead DataNodes | count | Total number of dead data nodes | |
| hdfs.namenode.num.decom.live.data.nodes | HDFS Namenode Decomm Live Data Nodes | count | Number of decommissioning live data nodes | |
| hdfs.namenode.num.decom.dead.data.nodes | HDFS Namenode Decomm Dead Data Nodes | count | Number of decommissioning dead data nodes | |
| hdfs.namenode.num.decomm.data.nodes | HDFS Namenode Decomm Data Nodes | count | Number of decommissioning data nodes | |
| hdfs.namenode.num.stale.data.nodes | HDFS Namenode Stale DataNodes | count | Number of stale data nodes | |
| hdfs.namenode.num.stale.storages | HDFS Namenode Stale Storages | count | Number of stale storages | |
| hdfs.namenode.missing.blocks | HDFS Namenode Missing Blocks | count | Number of missing blocks | |
| hdfs.namenode.corrupt.blocks | HDFS Namenode Corrupt blocks | count | Number of corrupt blocks | |
| hdfs.namenode.status | HDFS Namenode Status | NULL | NameNode Status,displays,1 : active Mode,2 : Standby Mode |
Hitachi DF RAID Monitors
Description
Monitors the DF RAID command statistics like number of received read/write commands,read/write hit commands and read/write hit rate to the LUN and to the internal LUN. Also it monitors the write date rate in the cache memory.[Hitachi-DF-RAID-LAN-MIB.mib]
Prerequisites
No prerequisite
Supported Metric
| Monitor Name | Metric Name | Metric Display Name | Unit | Description |
|---|---|---|---|---|
| Hitachi DF Cache Memory Write Data Rate | hitachi.df.cache.write.data.rate | Cache Memory Write Data Rate | Represents the write data rate in the cache memory.[OID: 1.3.6.1.4.1.116.5.11.1.2.4.1] | |
| Hitachi DF Internal LUN Command Statistics | hitachi.df.internal.lun.received.read.commands | Internal LUN Received Read Commands | Represents the number of received read commands to the internal LUN.[OIDs: 1.3.6.1.4.1.116.5.11.1.2.7.1.1.1,1.3.6.1.4.1.116.5.11.1.2.7.1.1.2] | |
| hitachi.df.internal.lun.read.hit.commands | Internal LUN Read Hit Commands | Represents the number of read hit commands to the internal LUN.[OIDs: 1.3.6.1.4.1.116.5.11.1.2.7.1.1.1,1.3.6.1.4.1.116.5.11.1.2.7.1.1.3] | ||
| hitachi.df.internal.lun.read.hit.rate | Internal LUN Read Hit Rate | Represents the read hit rate to the internal LUN.[OIDs: 1.3.6.1.4.1.116.5.11.1.2.7.1.1.1,1.3.6.1.4.1.116.5.11.1.2.7.1.1.4] | ||
| hitachi.df.internal.lun.received.write.commands | Internal LUN Received Write Commands | Represents the number of received write commands to the internal LUN.[OIDs: 1.3.6.1.4.1.116.5.11.1.2.7.1.1.1,1.3.6.1.4.1.116.5.11.1.2.7.1.1.5] | ||
| hitachi.df.internal.lun.write.hit.commands | Internal LUN Write Hit Commands | Represents the number of write hit commands to the internal LUN.[OIDs: 1.3.6.1.4.1.116.5.11.1.2.7.1.1.1,1.3.6.1.4.1.116.5.11.1.2.7.1.1.6] | ||
| hitachi.df.internal.lun.write.hit.rate | Internal LUN Write Hit Rate | Represents the write hit rate to the internal LUN.[OIDs: 1.3.6.1.4.1.116.5.11.1.2.7.1.1.1,1.3.6.1.4.1.116.5.11.1.2.7.1.1.7] | ||
| Hitachi DF LUN Command Statistics | hitachi.df.lun.received.read.commands | LUN Recieved Read Commands | Represents the number of received read commands.[OIDs: 1.3.6.1.4.1.116.5.11.1.2.3.1.1.1,1.3.6.1.4.1.116.5.11.1.2.3.1.1.2] | |
| hitachi.df.lun.read.hit.commands | LUN Read Hit Commands | Represents the number of read hit commands to LUN.[OIDs: 1.3.6.1.4.1.116.5.11.1.2.3.1.1.1,1.3.6.1.4.1.116.5.11.1.2.3.1.1.3] | ||
| hitachi.df.lun.read.hit.rate | LUN Read Hit Rate | Represents the read hit rate to LUN.[OIDs: 1.3.6.1.4.1.116.5.11.1.2.3.1.1.1,1.3.6.1.4.1.116.5.11.1.2.3.1.1.4] | ||
| hitachi.df.lun.received.write.commands | LUN Received Write Commands | Represents the number of received write commands.[OIDs: 1.3.6.1.4.1.116.5.11.1.2.3.1.1.1,1.3.6.1.4.1.116.5.11.1.2.3.1.1.5] | ||
| hitachi.df.lun.write.hit.commands | LUN Write Hit Commands | Represents the number of write hit commands to LUN.[OIDs: 1.3.6.1.4.1.116.5.11.1.2.3.1.1.1,1.3.6.1.4.1.116.5.11.1.2.3.1.1.6] | ||
| hitachi.df.lun.write.hit.rate | LUN Write Hit Rate | Represents the write hit rate to LUN.[OIDs: 1.3.6.1.4.1.116.5.11.1.2.3.1.1.1,1.3.6.1.4.1.116.5.11.1.2.3.1.1.7] |
Hitachi HCP
Description
Template to monitor Hitachi HCP parameters like Services Status,System,Node,Storage,Storage Component,Storage Pool,Tenant,Storage License,Compression Stats and Replication.
Prerequisites
This template defined on HCP-MIB and validated on HCP version 9.2.1.9
Supported Metric
| Monitor Name | Metric Name | Metric Display Name | Unit | Description |
|---|---|---|---|---|
| Hitachi HCP - System | hcp_system_SpindownStorageCapacity | HCP System Spindown Storage Capacity | GB | It monitors the total amount of spindown storage capacity on all storage nodes [HCP-MIB :: spindownStorageCapacity : 1.3.6.1.4.1.116.5.46.7.1.20.0] |
| hcp_system_SpindownStorageUtilization | HCP System Spindown Storage Utilization | % | It monitors the total amount of spindown storage utilized on all storage node. | |
| hcp_system_IndexedObjectCount | HCP System Indexed Object Count | count | It monitors the number of indexed,and therefore searchable,objects stored in the repository [HCP-MIB :: indexedObjectCount : 1.3.6.1.4.1.116.5.46.7.1.10.0] | |
| hcp_system_EconomyStorageUsage | HCP System Economy Storage Usage | GB | It monitors the total amount of used space on all S-Series nodes [HCP-MIB :: economyStorageUsage : 1.3.6.1.4.1.116.5.46.7.1.33.0] | |
| hcp_system_systemDplSafeOrUnsafe | HCP System Dpl Safe Or Unsafe | It monitors whether HCP system DPL setting is below what is considered safe or not. Possible values are 1 - Unsafe 2 - Safe [HCP-MIB :: systemDplUnsafe : 1.3.6.1.4.1.116.5.46.7.1.14.0] | ||
| hcp_system_SpindownStorageUsage | HCP System Spindown Storage Usage | GB | It monitors the total amount of used space in spindown storage on all storage nodes [HCP-MIB :: spindownStorageUsage : 1.3.6.1.4.1.116.5.46.7.1.19.0] | |
| hcp_system_IndexingTotalSharedVolumesCapacity | HCP System Indexing Total Shared Volumes Capacity | TB | It monitors the total space on all shared volumes [HCP-MIB :: indexingTotalSharedVolumesCapacity : 1.3.6.1.4.1.116.5.46.7.1.25.0] | |
| hcp_system_EconomyStorageCapacity | HCP System Economy Storage Capacity | GB | It monitors the Total amount of storage capacity on all S-Series nodes [HCP-MIB :: economyStorageCapacity : 1.3.6.1.4.1.116.5.46.7.1.34.0] | |
| hcp_system_TotalCapacity | HCP System Total Capacity | TB | It monitors the total amount of storage space in the HCP system,in bytes [HCP-MIB :: totalCapacity : 1.3.6.1.4.1.116.5.46.7.1.6.0] | |
| hcp_system_UnavailableObjects | HCP System Unavailable Objects | count | It monitors the total number of unavailable objects in the HCP system [HCP-MIB :: unavailableObjects : 1.3.6.1.4.1.116.5.46.7.1.37.0] | |
| hcp_system_EconomyStorageUtilization | HCP System Economy Storage Utilization | % | It monitors the total amount of space utilized on all S-Series nodes. | |
| hcp_system_ProtectedVolume | HCP System Protected Volume | GB | It monitors the amount of storage space,in bytes,currently occupied by all stored data,including original file data,metadata [HCP-MIB :: protectedVolume : 1.3.6.1.4.1.116.5.46.7.1.7.0] |
Hitachi HCP - Node Uptime
Description
Template to monitor the Hitachi HCP nodes uptime. Validated it on Hitachi HCP G10 v9.2.1.9. System Object OID: 1.3.6.1.4.1.116.5.46. MIB Name: HCP-MIB
Prerequisites
No prerequisite
Supported Metric
| Monitor Name | Metric Name | Metric Display Name | Unit | Description |
|---|---|---|---|---|
| Hitachi HCP - Node Uptime | hcp_node_Uptime | HCP Node Uptime | Days | It represents the Hitachi HCP Node uptime.[HCP-MIB::nodeBootTime - 1.3.6.1.4.1.116.5.46.1.1.1.6,nodeIP - 1.3.6.1.4.1.116.5.46.1.1.1.2] |
Hitachi HCP Ver2
Description
Template to monitor Hitachi hcp parameters like Services Status,System,Node,Storage,Storage Component,Storage Pool,Tenant,Storage License,Compression Stats and Replication.
Prerequisites
This template defined on HCP-MIB and validated on HCP version 9.2.1.9
Supported Metric
| Monitor Name | Metric Name | Metric Display Name | Unit | Description |
|---|---|---|---|---|
| Hitachi HCP - System Ver2 | hcp_system_SpindownStorageCapacity | HCP System Spindown Storage Capacity | GB | It monitors the total amount of spindown storage capacity on all storage nodes [HCP-MIB :: spindownStorageCapacity : 1.3.6.1.4.1.116.5.46.7.1.20.0] |
| hcp_system_SpindownStorageUtilization | HCP System Spindown Storage Utilization | % | It monitors the total amount of spindown storage utilized on all storage node. | |
| hcp_system_IndexedObjectCount | HCP System Indexed Object Count | count | It monitors the number of indexed,and therefore searchable,objects stored in the repository [HCP-MIB :: indexedObjectCount : 1.3.6.1.4.1.116.5.46.7.1.10.0] | |
| hcp_system_EconomyStorageUsage | HCP System Economy Storage Usage | GB | It monitors the total amount of used space on all S-Series nodes [HCP-MIB :: economyStorageUsage : 1.3.6.1.4.1.116.5.46.7.1.33.0] | |
| hcp_system_systemDplSafeOrUnsafe | HCP System Dpl Safe Or Unsafe | It monitors whether HCP system DPL setting is below what is considered safe or not. Possible values are 1 - Unsafe 2 - Safe [HCP-MIB :: systemDplUnsafe : 1.3.6.1.4.1.116.5.46.7.1.14.0] | ||
| hcp_system_SpindownStorageUsage | HCP System Spindown Storage Usage | GB | It monitors the total amount of used space in spindown storage on all storage nodes [HCP-MIB :: spindownStorageUsage : 1.3.6.1.4.1.116.5.46.7.1.19.0] | |
| hcp_system_IndexingTotalSharedVolumesCapacity | HCP System Indexing Total Shared Volumes Capacity | TB | It monitors the total space on all shared volumes [HCP-MIB :: indexingTotalSharedVolumesCapacity : 1.3.6.1.4.1.116.5.46.7.1.25.0] | |
| hcp_system_EconomyStorageCapacity | HCP System Economy Storage Capacity | GB | It monitors the Total amount of storage capacity on all S-Series nodes [HCP-MIB :: economyStorageCapacity : 1.3.6.1.4.1.116.5.46.7.1.34.0] | |
| hcp_system_TotalCapacity | HCP System Total Capacity | TB | It monitors the total amount of storage space in the HCP system,in bytes [HCP-MIB :: totalCapacity : 1.3.6.1.4.1.116.5.46.7.1.6.0] | |
| hcp_system_UnavailableObjects | HCP System Unavailable Objects | count | It monitors the total number of unavailable objects in the HCP system [HCP-MIB :: unavailableObjects : 1.3.6.1.4.1.116.5.46.7.1.37.0] | |
| hcp_system_EconomyStorageUtilization | HCP System Economy Storage Utilization | % | It monitors the total amount of space utilized on all S-Series nodes. | |
| hcp_system_ProtectedVolume | HCP System Protected Volume | GB | It monitors the amount of storage space,in bytes,currently occupied by all stored data,including original file data,metadata [HCP-MIB :: protectedVolume : 1.3.6.1.4.1.116.5.46.7.1.7.0] | |
| hcp_system_IrreparableObjectsPresent | HCP System Irreparable Objects Present | Monitors whether the repository contains any irreparable objects or not.[HCP-MIB :: irreparableObjectsPresent : 1.3.6.1.4.1.116.5.46.7.1.15.0] | ||
| hcp_system_NonReplicatingIrreparableObjects | HCP System Non Replicating Irreparable Objects | count | Monitors the total number of objects in the HCP system that currently cannot be replicated because they are irreparable.[HCP-MIB :: nonReplicatingIrreparableObjects : 1.3.6.1.4.1.116.5.46.7.1.35.0] | |
| Hitachi HCP - Compression Stats Ver1 | hcp_compression_ObjectsCompressed | HCP Compression Objects Compressed | count | It monitors the number of objects and parts of multipart objects currently compressed [HCP-MIB :: compressionObjectsCompressed : 1.3.6.1.4.1.116.5.46.5.2.1.5] |
| hcp_compression_PercentSpaceSaved | HCP Compression Percent Space Saved | % | It monitors the amount of storage space currently saved by object and part compression,expressed as a percentage of the total space available for storing objects and parts of multipart objects [HCP-MIB :: compressionPercentSpaceSaved : 1.3.6.1.4.1.116.5.46.5.2.1.4] | |
| Hitachi HCP - Node Ver1 | hcp_node_NicDegraded | HCP Node Nic Degraded | It monitors the indication of whether (1) or not (2) the node has a degraded [HCP-MIB :: nodeNicDegraded : 1.3.6.1.4.1.116.5.46.1.1.1.14] | |
| hcp_node_MemoryTotal | HCP Node Memory Total | GB | It monitors the total amount of memory on the node,in bytes [HCP-MIB :: nodeMemoryTotal : 1.3.6.1.4.1.116.5.46.1.1.1.20] | |
| hcp_node_Status | HCP Node Status | It monitors the current status of the node .Possible values are unavailable(0),available(4) [HCP-MIB :: nodeStatus : 1.3.6.1.4.1.116.5.46.1.1.1.7] | ||
| hcp_node_UtilizationPercent | HCP Node Utilization Percent | % | It monitors the total amount of space utilized on all the logical volumes managed by the nodes. | |
| hcp_node_SANStatus | HCP Node SAN Status | It monitors the indication of the status of the SAN path [HCP-MIB :: nodeSANStatus : 1.3.6.1.4.1.116.5.46.1.1.1.12] | ||
| hcp_node_Capacity | HCP Node Capacity | GB | It monitors the total amount of storage space on all the logical volumes managed by the node,in bytes [HCP-MIB :: nodeCapacity : 1.3.6.1.4.1.116.5.46.1.1.1.5] | |
| hcp_node_NicFailure | HCP Node NIc Failure | It monitors the indication of whether (1) or not (2) the node has a failed NIC [HCP-MIB :: nodeNicFailure : 1.3.6.1.4.1.116.5.46.1.1.1.11] | ||
| hcp_node_Availability | HCP Node Availability | GB | It monitors the total amount of unused space on all the logical volumes managed by the node,in bytes [HCP-MIB :: nodeAvailability : 1.3.6.1.4.1.116.5.46.1.1.1.4] | |
| hcp_node_Usage | HCP Node Usage | GB | It monitors the total amount of used space on all the logical volumes managed by the node,in bytes [HCP-MIB :: nodeUsage : 1.3.6.1.4.1.116.5.46.1.1.1.3] | |
| Hitachi HCP - Replication Ver1 | hcp_replication_LinkStatus | HCP Replication Link Status | It monitors the status of the replication link [HCP-MIB :: replicationLinkStatus : 1.3.6.1.4.1.116.5.46.5.7.1.1.6] | |
| hcp_replication_LinkErrorsPerSecond | HCP Replication Link Errors Per Seconds | psec | It monitors the cached number of errors that have occurred on the replication link during the past minute,in errors per second [HCP-MIB :: replicationLinkErrorsPerSecond : 1.3.6.1.4.1.116.5.46.5.7.1.1.16] | |
| hcp_replication_LinkSuspendedOrNot | HCP Replication Link Suspended Or Not | It monitors the suspends (1) or resumes (2) t state of he replication link [HCP-MIB :: replicationLinkSuspended : 1.3.6.1.4.1.116.5.46.5.7.1.1.8] | ||
| hcp_replication_LinkOperationsPerSecond | HCP Replication Link Operations Per Second | psec | It monitors the cached operation rate for the replication link during the past minute,in operations per second [HCP-MIB :: replicationLinkOperationsPerSecond : 1.3.6.1.4.1.116.5.46.5.7.1.1.14] | |
| hcp_replication_LinkBytesPerSecond | HCP Replication Link Bytes Per Second | Bps | It monitors the cached data transmission rate for the replication link during the past minute,in bytes per second [HCP-MIB :: replicationLinkBytesPerSecond : 1.3.6.1.4.1.116.5.46.5.7.1.1.12] | |
| Hitachi HCP - Services Status Ver2 | hcp_service_DispositionStatus | HCP Service Disposition Status | It monitors the Current status of the disposition service. Possible values are waiting(-1),stopped(0),completed(1),ongoing(2),running(3),fixing(4),unrecoverable(5),stopping(6),disabled(7) [HCP-MIB :: dispositionStatus : 1.3.6.1.4.1.116.5.46.5.13.1.1.0] | |
| hcp_service_DuplicateEliminationStatus | HCP Service Duplicate Elimination Status | It monitors the current status of the duplicate elimination service. Possible values are waiting(-1),stopped(0),completed(1),ongoing(2),running(3),fixing(4),unrecoverable(5),stopping(6),disabled(7).[HCP-MIB :: duplicateEliminationStatus : 1.3.6.1.4.1.116.5.46.5.4.1.1.0] | ||
| hcp_service_CompressionStatus | HCP Service Compression Status | It monitors the current status of the compression service. Possible values are waiting(-1),stopped(0),completed(1),ongoing(2),running(3),fixing(4),unrecoverable(5),stopping(6),disabled(7) [HCP-MIB :: compressionStatus : 1.3.6.1.4.1.116.5.46.5.2.1.1.0] | ||
| hcp_service_CapacityBalancingStatus | HCP Service Capacity Balancing Status | It monitors the current status of the capacity balancing service. Possible values are waiting(-1),stopped(0),completed(1),ongoing(2),running(3),fixing(4),unrecoverable(5),stopping(6),disabled(7) [HCP-MIB :: capacityBalancingStatus : 1.3.6.1.4.1.116.5.46.5.1.1.1.0] | ||
| hcp_service_StorageTieringStatus | HCP Service Storage Tiering Status | It monitors the current status of the storage tiering service. Possible values are waiting(-1),stopped(0),completed(1),ongoing(2),running(3),fixing(4),unrecoverable(5),stopping(6),disabled(7) [HCP-MIB :: storageTieringStatus : 1.3.6.1.4.1.116.5.46.5.12.1.1.0] | ||
| hcp_service_GarbageCollectionStatus | HCP Service Garbage Collection Status | It monitors the current status of the garbage collection service. Possible values are waiting(-1),stopped(0),completed(1),ongoing(2),running(3),fixing(4),unrecoverable(5),stopping(6),disabled(7) [HCP-MIB :: garbageCollectionStatus : 1.3.6.1.4.1.116.5.46.5.5.1.1.0] | ||
| hcp_service_ProtectionStatus | HCP Service Protection Status | It monitors the current status of the protection service. Possible values are waiting(-1),stopped(0),completed(1),ongoing(2),running(3),fixing(4),unrecoverable(5),stopping(6),disabled(7) [HCP-MIB :: protectionStatus : 1.3.6.1.4.1.116.5.46.5.6.1.1.0] | ||
| hcp_service_ScavengingStatus | HCP Service Scavenging Status | It monitors the current status of the scavenging service. Possible values are waiting(-1),stopped(0),completed(1),ongoing(2),running(3),fixing(4),unrecoverable(5),stopping(6),disabled(7)[HCP-MIB :: scavengingStatus : 1.3.6.1.4.1.116.5.46.5.8.1.1.0] | ||
| hcp_service_ContentVerificationStatus | HCP Service Content Verification Status | Monitors the current status of the content verification service.Possible values are waiting(-1),stopped(0),completed(1),ongoing(2),running(3),fixing(4),unrecoverable(5),stopping(6),disabled(7) [HCP-MIB :: contentVerificationStatus : 1.3.6.1.4.1.116.5.46.5.3.1.1.0] | ||
| Hitachi HCP - Storage Component Status Ver1 | hcp_storagecomponent_Status | HCP Storage Component Status | It monitors the status of storage component. Possible values are good(0),warning(1),error(2) [HCP-MIB :: storageComponentStatus : 1.3.6.1.4.1.116.5.46.2.2.1.4] | |
| Hitachi HCP - Storage License Ver1 | hcp_storage_ExtendedLicensedCapacity | HCP Storage Extended Licensed Capacity | TB | It monitors the licensed capacity for extended storage [HCP-MIB :: storageExtendedLicensedCapacity : 1.3.6.1.4.1.116.5.46.2.5.5] |
| hcp_storage_LicensedCapacity | HCP Storage Licensed Capacity | TB | It monitors the licensed capacity for HCP and HCP S-node storage [HCP-MIB :: storageLicensedCapacity : 1.3.6.1.4.1.116.5.46.2.5.8] | |
| hcp_storage_UsedCapacity | HCP Storage Used Capacity | TB | It monitors the total space used between HCP and HCP S-node storage [HCP-MIB :: storageUsedCapacity : 1.3.6.1.4.1.116.5.46.2.5.7] | |
| hcp_storage_ExtendedLicenseUtilization | HCP Storage Extended License Utilization | % | It monitors the total space utilized on extended storage. | |
| hcp_storage_ActiveUsedCapacity | HCP Storage Active Used Capacity | TB | It monitors the total space used on active storage [HCP-MIB :: storageActiveUsedCapacity : 1.3.6.1.4.1.116.5.46.2.5.3] | |
| hcp_storage_ActiveLicensedCapacity | HCP Storage Active Licensed Capacity | TB | It monitors the Licensed capacity for active storage [HCP-MIB :: storageActiveLicensedCapacity : 1.3.6.1.4.1.116.5.46.2.5.3] | |
| hcp_storage_LicenseUtilization | HCP Storage License Utilization | % | It monitors the total space utilized between HCP and HCP S-node storage | |
| hcp_storage_ActiveLicenseUtilization | HCP Storage Active License Utilization | % | It monitors the total space utilized on active storage | |
| hcp_storage_ExtendedUsedCapacity | HCP Storage Extended Used Capacity | TB | It monitors the total space used on extended storage [HCP-MIB :: storageExtendedUsedCapacity : 1.3.6.1.4.1.116.5.46.2.5.4] | |
| Hitachi HCP - Storage Pool Status Ver1 | hcp_storagepool_Status | HCP Storage Pool Status | It monitors the status of storage pool . Possible values are good(0),warning(1),error(2) [HCP-MIB :: storagePoolStatus : 1.3.6.1.4.1.116.5.46.2.3.1.4] | |
| Hitachi HCP - Storage Ver2 | hcp_storage_Availability | HCP Storage Availability | GB | It monitors the amount of unused space on the logical volume,in bytes [HCP-MIB :: storageAvailability : 1.3.6.1.4.1.116.5.46.2.1.1.4] |
| hcp_storage_Capacity | HCP Storage Capapcity | GB | It monitors the total amount of space on the logical volume,in bytes [HCP-MIB :: storageCapacity : 1.3.6.1.4.1.116.5.46.2.1.1.5] | |
| hcp_storage_Usage | HCP Storage Usage | GB | It monitors the amount of used space on the logical volume,in bytes [HCP-MIB :: storageUsage : 1.3.6.1.4.1.116.5.46.2.1.1.3] | |
| hcp_storage_Utilization | HCP Storage Utilization | % | It monitors the total amount of space utilized on the logical volumes. | |
| hcp_storage_VolumeSpinStateValue | HCP Storage Volume Spin State Value | Monitors the volume spin state.[HCP-MIB :: volumeSpinStateValue : 1.3.6.1.4.1.116.5.46.2.1.1.10]. Possible values are Unknown(0),Spinup requested(1),Spinup wait(2),Spinup error(4),Spinup in progress(8),Spinup fail(16),Spinning(32),Spindown requested(64),Spindown wait(128),Spindown error(256),Spindown fail(512),Spun down(1024),Failed(268435456). | ||
| hcp_storage_Status | HCP Storage Status | It monitors the current status of the logical volume. Possible values are unavailable(0),broken(1),suspended(2),initialized(3),available(4),degraded(5) [HCP-MIB :: storageStatus : 1.3.6.1.4.1.116.5.46.2.1.1.7] | ||
| Hitachi HCP - Tenant Ver2 | hcp_tenant_LogicalStorageSpaceUsed | HCP Tenant Logical Storage Space Used | MB | It monitors the total size,in bytes,of the stored data and custom metadata before it was added to the namespaces owned by the tenant [HCP-MIB :: tenantLogicalBytesUsed : 1.3.6.1.4.1.116.5.46.4.1.1.25] |
| hcp_tenant_ObjectsStored | HCP Tenant Objects Stored | count | It monitors the number of objects currently stored in all namespaces owned by the tenant [HCP-MIB :: tenantObjectsStored : 1.3.6.1.4.1.116.5.46.4.1.1.19] | |
| hcp_tenant_PhysicalStorageSpaceUsed | HCP Tenant Physical Storage Space Used | MB | It monitors the Total amount of storage,in bytes,used by all the namespaces owned by the tenant to store object data and metadata [HCP-MIB :: tenantPhysicalBytesUsed : 1.3.6.1.4.1.116.5.46.4.1.1.24] | |
| hcp_tenant_ObjectsIndexed | HCP Tenant Objects Indexed | count | It monitors the number of indexed objects currently stored in all namespaces owned by the tenant [HCP-MIB :: tenantObjectsIndexed : 1.3.6.1.4.1.116.5.46.4.1.1.20] | |
| hcp_tenant_TenantCapacity | HCP Tenant Capacity | % | Monitors the tenant capacity | |
| hcp_tenant_HardQuota | HCP Tenant Hard Quota | GB | It monitors the hard quota for the tenant [HCP-MIB :: tenantHardQuota : 1.3.6.1.4.1.116.5.46.4.1.1.21] | |
| hcp_tenant_SoftQuota | HCP Tenant Soft Quota | % | It monitors the Soft quota for the tenant [HCP-MIB :: tenantSoftQuota : 1.3.6.1.4.1.116.5.46.4.1.1.22] | |
| hcp_tenant_IsTenantOwnsNonReplicatedDpl1Namespace | HCP Tenant Is Tenant Owns Non Replicated Dpl1 Namespace | It monitors the indication of whether (1) or not (2) the tenant owns any non-replicated namespaces with a DPL that is considered unsafe for the HCP system hardware configuration [HCP-MIB :: nonReplicatedDpl1Namespace : 1.3.6.1.4.1.116.5.46.4.1.1.26] |
Hitachi HNAS
Description
Template to monitor Hitachi HNAS parameters like chassis drive status,CIFS Traffic parameters like Bytes Read,Bytes Written,cluster quorum device status,CPU Utilization,Fan parameters like Speed Status,Speed,field programmable gate array utilization,NFS Traffic parameters like Bytes Read,Bytes Written,NVRAM pool waited allocations,power supply unit status,Temperature Sensor parameters like Status,Reading.
Prerequisites
No prerequisite
Supported Metric
| Monitor Name | Metric Name | Metric Display Name | Unit | Description |
|---|---|---|---|---|
| Hitachi HNAS - Chassis Drive Status | hnas_chassisdrive_Status | HNAS Chassis Drive Status | It monitors the RAID status of the chassis drive. Possible values are raidUnknown(1),raidDegraded(2),raidRebuilding(3),raidFailed(4),raidInvalid(5),raidGood(6). Component or instance is represented as chassis drive cluster node ID and chassis drive ID with dotted notation.[BLUEARC-SERVER-MIB::chassisDriveStatus:1.3.6.1.4.1.11096.6.1.1.1.2.1.15.1.4]. | |
| Hitachi HNAS - CIFS Traffic | hnas_cifs_BytesWritten | HNAS CIFS Bytes Written | Bps | It monitors the number of bytes written.[BLUEARC-SERVER-MIB::protocolXferStatsBytesWritten:1.3.6.1.4.1.11096.6.1.1.6.6.8.1.5]. |
| hnas_cifs_BytesRead | HNAS CIFS Bytes Read | Bps | It monitors the number of bytes read.[BLUEARC-SERVER-MIB::protocolXferStatsBytesRead:1.3.6.1.4.1.11096.6.1.1.6.6.8.1.4]. | |
| Hitachi HNAS - Cluster Quorum Device Status | hnas_clusterquorum_DeviceStatus | HNAS Cluster Quorum Device Status | It monitors the status of the quorum device. Possible values are unknown(0),unconfigured(1),offLine(2),owned(3),configured(4),granted(5),clusterNodeNotUp(6),misconfigured(7).[BLUEARC-SERVER-MIB::clusterQuorumDeviceStatus:1.3.6.1.4.1.11096.6.1.1.1.2.5.7.0]. | |
| Hitachi HNAS - CPU Utilization | hnas_CpuUtilization | HNAS CPU Utilization | % | It monitors the HNAS CPU utilization. Component or instance is represented as Cluster Node Index and CPU Index with dotted notation.[BLUEARC-SERVER-MIB::cpuUtilization:1.3.6.1.4.1.11096.6.1.1.6.1.2.1.3]. |
| Hitachi HNAS - Fan | hnas_fan_SpeedStatus | HNAS Fan Speed Status | It monitors the speed status of the fan. Possible values are ok(1),warning(2),severe(3),unknown(4). Component or instance is represented as fan cluster node ID and fan ID with dotted notation.[BLUEARC-SERVER-MIB::fanSpeedStatus:1.3.6.1.4.1.11096.6.1.1.1.2.1.11.1.4]. | |
| hnas_fan_Speed | HNAS Fan Speed | rpm | It monitors the speed of the fan. Component or instance is represented as fan cluster node ID and fan ID with dotted notation.[BLUEARC-SERVER-MIB::fanSpeed:1.3.6.1.4.1.11096.6.1.1.1.2.1.11.1.5]. | |
| Hitachi HNAS - Field Programmable Gate Array Utilization | hnas_fpga_Utilization | HNAS FPGA Utilization | % | It monitors the current percentage usage averaged over the last second of this Field Programmable Gate Array.[BLUEARC-SERVER-MIB::fpgaUtilization:1.3.6.1.4.1.11096.6.1.1.6.1.4.1.4]. |
| Hitachi HNAS - NFS Traffic | hnas_nfs_BytesRead | HNAS NFS Bytes Read | Bps | It monitors the number of bytes read.[BLUEARC-SERVER-MIB::protocolXferStatsBytesRead:1.3.6.1.4.1.11096.6.1.1.6.6.8.1.4]. |
| hnas_nfs_BytesWritten | HNAS NFS Bytes Written | Bps | It monitors the number of bytes written.[BLUEARC-SERVER-MIB::protocolXferStatsBytesWritten:1.3.6.1.4.1.11096.6.1.1.6.6.8.1.5]. | |
| Hitachi HNAS - NVRAM Pool Waited Allocations | hnas_nvrampool_WaitedAllocations | HNAS NVRAM Pool Waited Allocations | count | It monitors the number of allocations,for the entire NVRAM pool,for which a wait has occurred.[BLUEARC-SERVER-MIB::nvramPoolStatsWaitedAllocs:1.3.6.1.4.1.11096.6.1.1.1.3.9.6.1.5]. |
| Hitachi HNAS - Power Supply Unit Status | hnas_powersupplyunit_Status | HNAS Power Supply Unit Status | It monitors the status of the power supply unit. Possible values are ok(1),failed(2),notFitted(3),unknown(4). Component or instance is represented as power supply unit cluster node ID and power supply unit ID with dotted notation.[BLUEARC-SERVER-MIB::psuStatus:1.3.6.1.4.1.11096.6.1.1.1.2.1.13.1.3]. | |
| Hitachi HNAS - Temperature Sensor | hnas_temperaturesensor_Reading | HNAS Temperature Sensor Reading | Celsius | It monitors the temperature taken by the sensor in degrees Celsius. Component or instance is represented as temperature sensor cluster node ID and temperature sensor ID with dotted notation.[BLUEARC-SERVER-MIB::temperatureSensorCReading:1.3.6.1.4.1.11096.6.1.1.1.2.1.9.1.4]. |
| hnas_temperaturesensor_Status | HNAS Temperature Sensor Status | It monitors whether the temperature measurement is within the expected range. Component or instance is represented as temperature sensor cluster node ID and temperature sensor ID with dotted notation. Possible values are ok(1),tempWarning(2),tempSevere(3),tempSensorFailed(4),tempSensorWarning(5),unknown(6).[BLUEARC-SERVER-MIB::temperatureSensorStatus:1.3.6.1.4.1.11096.6.1.1.1.2.1.9.1.3]. |
Hitachi HNAS - v2
Description
Template to monitor Hitachi HNAS parameters like chassis drive status,CIFS Traffic parameters like Bytes Read,Bytes Written,cluster quorum device status,CPU Utilization,Fan parameters like Speed Status,Speed,field programmable gate array utilization,NFS Traffic parameters like Bytes Read,Bytes Written,NVRAM pool waited allocations,power supply unit status,Temperature Sensor parameters like Status,Reading.
Prerequisites
No prerequisite
Supported Metric
| Monitor Name | Metric Name | Metric Display Name | Unit | Description |
|---|---|---|---|---|
| Hitachi HNAS - Chassis Drive Status | hnas_chassisdrive_Status | HNAS Chassis Drive Status | It monitors the RAID status of the chassis drive. Possible values are raidUnknown(1),raidDegraded(2),raidRebuilding(3),raidFailed(4),raidInvalid(5),raidGood(6). Component or instance is represented as chassis drive cluster node ID and chassis drive ID with dotted notation.[BLUEARC-SERVER-MIB::chassisDriveStatus:1.3.6.1.4.1.11096.6.1.1.1.2.1.15.1.4]. | |
| Hitachi HNAS - CIFS Traffic | hnas_cifs_BytesWritten | HNAS CIFS Bytes Written | Bps | It monitors the number of bytes written.[BLUEARC-SERVER-MIB::protocolXferStatsBytesWritten:1.3.6.1.4.1.11096.6.1.1.6.6.8.1.5]. |
| hnas_cifs_BytesRead | HNAS CIFS Bytes Read | Bps | It monitors the number of bytes read.[BLUEARC-SERVER-MIB::protocolXferStatsBytesRead:1.3.6.1.4.1.11096.6.1.1.6.6.8.1.4]. | |
| Hitachi HNAS - Cluster Quorum Device Status | hnas_clusterquorum_DeviceStatus | HNAS Cluster Quorum Device Status | It monitors the status of the quorum device. Possible values are unknown(0),unconfigured(1),offLine(2),owned(3),configured(4),granted(5),clusterNodeNotUp(6),misconfigured(7).[BLUEARC-SERVER-MIB::clusterQuorumDeviceStatus:1.3.6.1.4.1.11096.6.1.1.1.2.5.7.0]. | |
| Hitachi HNAS - CPU Utilization | hnas_CpuUtilization | HNAS CPU Utilization | % | It monitors the HNAS CPU utilization. Component or instance is represented as Cluster Node Index and CPU Index with dotted notation.[BLUEARC-SERVER-MIB::cpuUtilization:1.3.6.1.4.1.11096.6.1.1.6.1.2.1.3]. |
| Hitachi HNAS - Fan | hnas_fan_SpeedStatus | HNAS Fan Speed Status | It monitors the speed status of the fan. Possible values are ok(1),warning(2),severe(3),unknown(4). Component or instance is represented as fan cluster node ID and fan ID with dotted notation.[BLUEARC-SERVER-MIB::fanSpeedStatus:1.3.6.1.4.1.11096.6.1.1.1.2.1.11.1.4]. | |
| hnas_fan_Speed | HNAS Fan Speed | rpm | It monitors the speed of the fan. Component or instance is represented as fan cluster node ID and fan ID with dotted notation.[BLUEARC-SERVER-MIB::fanSpeed:1.3.6.1.4.1.11096.6.1.1.1.2.1.11.1.5]. | |
| Hitachi HNAS - Field Programmable Gate Array Utilization | hnas_fpga_Utilization | HNAS FPGA Utilization | % | It monitors the current percentage usage averaged over the last second of this Field Programmable Gate Array.[BLUEARC-SERVER-MIB::fpgaUtilization:1.3.6.1.4.1.11096.6.1.1.6.1.4.1.4]. |
| Hitachi HNAS - NFS Traffic | hnas_nfs_BytesRead | HNAS NFS Bytes Read | Bps | It monitors the number of bytes read.[BLUEARC-SERVER-MIB::protocolXferStatsBytesRead:1.3.6.1.4.1.11096.6.1.1.6.6.8.1.4]. |
| hnas_nfs_BytesWritten | HNAS NFS Bytes Written | Bps | It monitors the number of bytes written.[BLUEARC-SERVER-MIB::protocolXferStatsBytesWritten:1.3.6.1.4.1.11096.6.1.1.6.6.8.1.5]. | |
| Hitachi HNAS - NVRAM Pool Waited Allocations | hnas_nvrampool_WaitedAllocations | HNAS NVRAM Pool Waited Allocations | count | It monitors the number of allocations,for the entire NVRAM pool,for which a wait has occurred.[BLUEARC-SERVER-MIB::nvramPoolStatsWaitedAllocs:1.3.6.1.4.1.11096.6.1.1.1.3.9.6.1.5]. |
| Hitachi HNAS - Power Supply Unit Status | hnas_powersupplyunit_Status | HNAS Power Supply Unit Status | It monitors the status of the power supply unit. Possible values are ok(1),failed(2),notFitted(3),unknown(4). Component or instance is represented as power supply unit cluster node ID and power supply unit ID with dotted notation.[BLUEARC-SERVER-MIB::psuStatus:1.3.6.1.4.1.11096.6.1.1.1.2.1.13.1.3]. | |
| Hitachi HNAS - Temperature Sensor | hnas_temperaturesensor_Reading | HNAS Temperature Sensor Reading | Celsius | It monitors the temperature taken by the sensor in degrees Celsius. Component or instance is represented as temperature sensor cluster node ID and temperature sensor ID with dotted notation.[BLUEARC-SERVER-MIB::temperatureSensorCReading:1.3.6.1.4.1.11096.6.1.1.1.2.1.9.1.4]. |
| hnas_temperaturesensor_Status | HNAS Temperature Sensor Status | It monitors whether the temperature measurement is within the expected range. Component or instance is represented as temperature sensor cluster node ID and temperature sensor ID with dotted notation. Possible values are ok(1),tempWarning(2),tempSevere(3),tempSensorFailed(4),tempSensorWarning(5),unknown(6).[BLUEARC-SERVER-MIB::temperatureSensorStatus:1.3.6.1.4.1.11096.6.1.1.1.2.1.9.1.3]. | ||
| Hitachi HNAS - Span Capacity Utilization | hnas_span_CapacityTotal | HNAS Span Capacity Total(GB) | GB | It monitors the total span capacity in GB.[BLUEARC-SERVER-MIB :: spanCapacityTotalUpper : 1.3.6.1.4.1.11096.6.1.1.6.4.2.1.3,spanCapacityTotalLower : 1.3.6.1.4.1.11096.6.1.1.6.4.2.1.4] |
| hnas_span_CapacityUsed | HNAS Span Capacity Used(GB) | GB | It monitors the span capacity used in GB.[BLUEARC-SERVER-MIB :: spanCapacityUsedUpper : 1.3.6.1.4.1.11096.6.1.1.6.4.2.1.5,spanCapacityUsedLower : 1.3.6.1.4.1.11096.6.1.1.6.4.2.1.6] | |
| hnas_span_CapacityUtilization | HNAS Span Capacity Utilization(%) | % | It monitors the span capacity utilization in percentage.It monitors the HNAS span capacity utilization parameters like Span Capacity Total,Span Capacity Used,Span Capacity Utilization.[BLUEARC-SERVER-MIB :: spanCapacityTotalUpper : 1.3.6.1.4.1.11096.6.1.1.6.4.2.1.3,spanCapacityTotalLower : 1.3.6.1.4.1.11096.6.1.1.6.4.2.1.4,spanCapacityUsedUpper : 1.3.6.1.4.1.11096.6.1.1.6.4.2.1.5,spanCapacityUsedLower : 1.3.6.1.4.1.11096.6.1.1.6.4.2.1.6] | |
| Hitachi HNAS - Volume(File System) Statistics | hnas_filesystem_VolumeStatus | HNAS Filesystem Volume Status | Monitors the status of the volume (i.e. file system).[BLUEARC-SERVER-MIB :: volumeStatus : 1.3.6.1.4.1.11096.6.1.1.1.3.5.2.1.4].Possible values are unformatted(1),mounted(2),formatted(3),needsChecking(4). | |
| hnas_filesystem_VolumeCapacity | HNAS Filesystem Volume Capacity | GB | Monitors the volume's (i.e. file system's) capacity in bytes.[BLUEARC-SERVER-MIB :: volumeCapacity : 1.3.6.1.4.1.11096.6.1.1.1.3.5.2.1.5] | |
| hnas_filesystem_VolumeFreeCapacity | HNAS Filesystem Volume Free | GB | Monitors the remaining free volume (i.e. file system) capacity in GB.[BLUEARC-SERVER-MIB :: volumeFreeCapacity : 1.3.6.1.4.1.11096.6.1.1.1.3.5.2.1.6] | |
| hnas_filesystem_VolumeUtilization | HNAS Filesystem Volume Utilization | % | Monitors the HNAS Filesystem Volume Utilization.[BLUEARC-SERVER-MIB :: volumeFreeCapacity : 1.3.6.1.4.1.11096.6.1.1.1.3.5.2.1.6,volumeCapacity : 1.3.6.1.4.1.11096.6.1.1.1.3.5.2.1.5] |
Hitachi Storage Hardware Status
Description
Monitors the hardware parameters of Hitachi disk controllers and disk units such as fan,power supply,processor state,cache and environment.
Prerequisites
Tested on USP V = RAID600. sysObjectID: enterprises.116.3.11.4.1.1
Supported Metric
| Monitor Name | Metric Name | Metric Display Name | Unit | Description |
|---|---|---|---|---|
| Hitachi Disk Controller (DKC) Hardware Monitor | hitachi.disk.controller.hardware.processor | Hitachi Disk Controller Hardware Processor | This monitor provides the status of the hardware (HW) disk controller (DKC) processor. The possible status values are 1- No Error,2- Acute,3- Serious,4- Moderate,5- Service.[OID: 1.3.6.1.4.1.116.5.11.4.1.1.6.1.2] | |
| hitachi.disk.controller.hardware.powersupply | Hitachi Disk Controller Hardware Power Supply | This monitor provides the status of the hardware (HW) disk controller (DKC) power supply. The possible status values are 1- No Error,2- Acute,3- Serious,4- Moderate,5- Service.[OID: 1.3.6.1.4.1.116.5.11.4.1.1.6.1.6] | ||
| hitachi.disk.controller.hardware.cache | Hitachi Disk Controller Hardware Cache | This monitor provides the status of the hardware (HW) disk controller (DKC) cache. The possible status values are 1- No Error,2- Acute,3- Serious,4- Moderate,5- Service.[OID: 1.3.6.1.4.1.116.5.11.4.1.1.6.1.4] | ||
| hitachi.disk.controller.hardware.fan | Hitachi Disk Controller Hardware Fan | This monitor provides the status of the hardware (HW) disk controller (DKC) fan. The possible status values are 1- No Error,2- Acute,3- Serious,4- Moderate,5- Service.[OID: 1.3.6.1.4.1.116.5.11.4.1.1.6.1.8] | ||
| hitachi.disk.controller.hardware.battery | Hitachi Disk Controller Hardware Battery | This monitor provides the status of the hardware (HW) disk controller (DKC) battery. The possible status values are 1- No Error,2- Acute,3- Serious,4- Moderate,5- Service.[OID: 1.3.6.1.4.1.116.5.11.4.1.1.6.1.7] | ||
| hitachi.disk.controller.hardware.environment | Hitachi Disk Controller Hardware Environnment | This monitor provides the status of the hardware (HW) disk controller (DKC) environment. The possible status values are 1- No Error,2- Acute,3- Serious,4- Moderate,5- Service.[OID: 1.3.6.1.4.1.116.5.11.4.1.1.6.1.9] | ||
| Hitachi Disk Unit (DKU) Hardware Monitor | hitachi.disk.unit.hardware.environment | Hitachi Disk Unit Hardware Environment | This monitor provides the status of the hardware (HW) disk unit (DKU) environment. The possible status values are 1- No Error,2- Acute,3- Serious,4- Moderate,5- Service.[OID: 1.3.6.1.4.1.116.5.11.4.1.1.7.1.4] | |
| hitachi.disk.unit.hardware.powersupply | Hitachi Disk Unit Hardware Power Supply | This monitor provides the status of the hardware (HW) disk unit (DKU) power supply. The possible status values are 1- No Error,2- Acute,3- Serious,4- Moderate,5- Service.[OID: 1.3.6.1.4.1.116.5.11.4.1.1.7.1.2] | ||
| hitachi.disk.unit.hardware.fan | Hitachi Disk Unit Hardware Fan | This monitor provides the status of the hardware (HW) disk unit (DKU) fan. The possible status values are 1- No Error,2- Acute,3- Serious,4- Moderate,5- Service.[OID: 1.3.6.1.4.1.116.5.11.4.1.1.7.1.3] | ||
| hitachi.disk.unit.hardware.drive | Hitachi Disk Unit Hardware Drive | This monitor provides the status of the hardware (HW) disk unit (DKU) drive. The possible status values are 1- No Error,2- Acute,3- Serious,4- Moderate,5- Service.[OID: 1.3.6.1.4.1.116.5.11.4.1.1.7.1.5] |
Host System Uptime
Description
Template to provide the amount of time since this host was last initialized.
Prerequisites
No prerequisite
Supported Metric
| Monitor Name | Metric Name | Metric Display Name | Unit | Description |
|---|---|---|---|---|
| Host System Uptime | system.uptime | System Uptime | s | The amount of time since this host was last initialized.[OID - 1.3.6.1.2.1.25.1.1.0] |
Huawei Datacomm Entity - Performance
Description
Template to monitor the huawei entity cpu utilization and memory utilization.[HUAWEI-ENTITY-EXTENT-MIB :: hwEntityCpuUsage : 1.3.6.1.4.1.2011.5.25.31.1.1.1.1.5,hwEntityMemUsage : 1.3.6.1.4.1.2011.5.25.31.1.1.1.1.7]
Prerequisites
Device must support HUAWEI-ENTITY-EXTENT-MIB
Supported Metric
| Monitor Name | Metric Name | Metric Display Name | Unit | Description |
|---|---|---|---|---|
| Huawei Datacomm Entity - Performance | huawei_datacomm_entity_CpuUsage | Huawei Entity Cpu Utilization | % | Monitors the overall CPU usage on the entity.[HUAWEI-ENTITY-EXTENT-MIB :: hwEntityCpuUsage : 1.3.6.1.4.1.2011.5.25.31.1.1.1.1.5] |
| huawei_datacomm_entity_MemUsage | Huawei Entity Memory Utilization | % | Monitors the memory usage for the entity.[HUAWEI-ENTITY-EXTENT-MIB :: hwEntityMemUsage : 1.3.6.1.4.1.2011.5.25.31.1.1.1.1.] |
Huawei Datacomm Entity - Hardware
Description
Template to monitor the hardware statistics like voltage sensor status and value,battery state,fan state and speed,power supply,Storage Utilization,emperature sensor status and value.[HUAWEI-ENTITY-EXTENT-MIB :: hwEntityVolStatus : 1.3.6.1.4.1.2011.5.25.31.1.1.9.1.5,hwEntityVolCurValue : 1.3.6.1.4.1.2011.5.25.31.1.1.9.1.7,hwBatteryState : 1.3.6.1.4.1.2011.5.25.31.1.1.15.1.1,hwBatteryRemainPercent : 1.3.6.1.4.1.2011.5.25.31.1.1.15.1.4,hwEntityFanSpeed : 1.3.6.1.4.1.2011.5.25.31.1.1.10.1.5,hwEntityFanState : 1.3.6.1.4.1.2011.5.25.31.1.1.10.1.7,hwEntityPwrState : 1.3.6.1.4.1.2011.5.25.31.1.1.18.1.6,hwStorageEntSpace : 1.3.6.1.4.1.2011.5.25.31.1.1.13.1.3,hwStorageEntSpaceFree : 1.3.6.1.4.1.2011.5.25.31.1.1.13.1.4,hwEntityTempStatus : 1.3.6.1.4.1.2011.5.25.31.1.1.8.1.5,hwEntityTempValue : 1.3.6.1.4.1.2011.5.25.31.1.1.8.1.6]
Prerequisites
Device must support HUAWEI-ENTITY-EXTENT-MIB
Supported Metric
| Monitor Name | Metric Name | Metric Display Name | Unit | Description |
|---|---|---|---|---|
| Huawei Datacomm Entity - Voltage | huawei_datacomm_entity_VolStatus | Huawei Entity Voltage Sensor Status | Monitors the the current status of a voltage sensor.[HUAWEI-ENTITY-EXTENT-MIB :: hwEntityVolStatus : 1.3.6.1.4.1.2011.5.25.31.1.1.9.1.5].ossible values are normal(1),major(2),fatal(3). | |
| huawei_datacomm_entity_VolCurValue | Huawei Entity Voltage Sensor Value | mV | Monitors the voltage sensor value in millivolt.[HUAWEI-ENTITY-EXTENT-MIB :: hwEntityVolCurValue : 1.3.6.1.4.1.2011.5.25.31.1.1.9.1.7] | |
| Huawei Datacomm Entity - Fan | huawei_datacomm_entity_FanSpeed | Huawei Entity Fan Speed | % | Monitors the the rotation speed (in percentage of the full speed) of the fan.[HUAWEI-ENTITY-EXTENT-MIB :: hwEntityFanSpeed : 1.3.6.1.4.1.2011.5.25.31.1.1.10.1.5] |
| huawei_datacomm_entity_FanState | Huawei Entity Fan State | Monitors the state of the fan.[HUAWEI-ENTITY-EXTENT-MIB :: hwEntityFanState : 1.3.6.1.4.1.2011.5.25.31.1.1.10.1.7].Possible values are normal(1),abnormal(2). | ||
| Huawei Datacomm Entity - Power Supply | huawei_datacomm_entity_PowerState | Huawei Power Supply State | Monitors the state of the power supply .[HUAWEI-ENTITY-EXTENT-MIB :: hwEntityPwrState : 1.3.6.1.4.1.2011.5.25.31.1.1.18.1.6].Possible values are supply(1),notSupply(2),sleep(3),unknown(4) | |
| Huawei Datacomm Entity - Storage Utilization | huawei_datacomm_entity_storage_Utilization | Huawei Entity Storage Utilization | % | Monitors the huawei entity storage utilization.[HUAWEI-ENTITY-EXTENT-MIB :: hwStorageEntSpace : 1.3.6.1.4.1.2011.5.25.31.1.1.13.1.3,hwStorageEntSpaceFree : 1.3.6.1.4.1.2011.5.25.31.1.1.13.1.4] |
| Huawei Datacomm Entity - Temperature | huawei_datacomm_entity_TempStatus | Huawei Entity Temperature Sensor Status | Monitors the current status of a temperature sensor.[HUAWEI-ENTITY-EXTENT-MIB :: hwEntityTempStatus : 1.3.6.1.4.1.2011.5.25.31.1.1.8.1.5].Possible values are normal(1),minor(2),major(3),fatal(4) | |
| huawei_datacomm_entity_TempValue | Huawei Entity Temperature Sensor Value | Celsius | Monitors the temperature sensor value in Celsius .[HUAWEI-ENTITY-EXTENT-MIB :: hwEntityTempValue : 1.3.6.1.4.1.2011.5.25.31.1.1.8.1.6] | |
| Huawei Datacomm Entity - Battery | huawei_datacomm_battery_State | Huawei Battery State | Monitors the state of lithium battery.[HUAWEI-ENTITY-EXTENT-MIB :: hwBatteryState : 1.3.6.1.4.1.2011.5.25.31.1.1.15.1.1].Possible values are charge(1),discharge(2),full(3),abnormal(4). | |
| huawei_datacomm_battery_RemainPercent | Huawei Battery Remain Percent | Minutes | Monitors the remained time of lithium battery.[HUAWEI-ENTITY-EXTENT-MIB :: hwBatteryRemainPercent : 1.3.6.1.4.1.2011.5.25.31.1.1.15.1.4] |
Huawei ISM Storage Performance Statistics
Description
Monitors the Huawei ISM Storage Performance Statistics like CPU Usage,Total IOPS,Read IOPS,Write IOPS,Total Traffic,Read Traffic,Write Traffic,Average IO Response Time,Average Read IO Latency,Average Write IO Latency.[ISM-PERFORMANCE-MIB :: hwPerfNodeCPUUsage : 1.3.6.1.4.1.34774.4.1.21.3.1.2,hwPerfNodeTotalIOPS : 1.3.6.1.4.1.34774.4.1.21.3.1.5,hwPerfNodeReadIOPS : 1.3.6.1.4.1.34774.4.1.21.3.1.6,hwPerfNodeWriteIOPS : 1.3.6.1.4.1.34774.4.1.21.3.1.7,hwPerfNodeTotalTraffic : 1.3.6.1.4.1.34774.4.1.21.3.1.8,hwPerfNodeReadTraffic : 1.3.6.1.4.1.34774.4.1.21.3.1.9,hwPerfNodeWriteTraffic : 1.3.6.1.4.1.34774.4.1.21.3.1.10,hwPerfLunTotalIOPS : 1.3.6.1.4.1.34774.4.1.21.4.1.3,hwPerfLunReadIOPS : 1.3.6.1.4.1.34774.4.1.21.4.1.4,hwPerfLunWriteIOPS : 1.3.6.1.4.1.34774.4.1.21.4.1.5,hwPerfLunTotalTraffic : 1.3.6.1.4.1.34774.4.1.21.4.1.6,hwPerfLunReadTraffic : 1.3.6.1.4.1.34774.4.1.21.4.1.7,hwPerfLunWriteTraffic : 1.3.6.1.4.1.34774.4.1.21.4.1.8,hwPerfLunAverageIOResponseTime : 1.3.6.1.4.1.34774.4.1.21.4.1.13,hwPerfLunAverageReadIOLatency : 1.3.6.1.4.1.34774.4.1.21.4.1.15,hwPerfLunAverageWriteIOLatency : 1.3.6.1.4.1.34774.4.1.21.4.1.16]
Prerequisites
NULL
Supported Metric
| Monitor Name | Metric Name | Metric Display Name | Unit | Description |
|---|---|---|---|---|
| Huawei ISM Storage Performance - Node | huawei_ism_storage_HwPerfNodeTotalIOPS | Huawei ISM Storage Performance Node Total IOPS | IOPS | Monitors the Total IOPS of the node.[ISM-PERFORMANCE-MIB :: hwPerfNodeTotalIOPS : 1.3.6.1.4.1.34774.4.1.21.3.1.5] |
| huawei_ism_storage_HwPerfNodeWriteIOPS | Huawei ISM Storage Performance Node Write IOPS | IOPS | Monitors the Write IOPS of the node.[ISM-PERFORMANCE-MIB :: hwPerfNodeWriteIOPS : 1.3.6.1.4.1.34774.4.1.21.3.1.7] | |
| huawei_ism_storage_HwPerfNodeReadIOPS | Huawei ISM StoragePerformance Node Read IOPS | IOPS | Monitors the Read IOPS of the node.[ISM-PERFORMANCE-MIB :: hwPerfNodeReadIOPS : 1.3.6.1.4.1.34774.4.1.21.3.1.6] | |
| huawei_ism_storage_HwPerfNodeTotalTraffic | Huawei ISM Storage Performance Node Total Traffic | MBps | Monitors the Total bandwidth for the node.[ISM-PERFORMANCE-MIB :: hwPerfNodeTotalTraffic : 1.3.6.1.4.1.34774.4.1.21.3.1.8] | |
| huawei_ism_storage_HwPerfNodeReadTraffic | Huawei ISM Storage Performance Node Read Traffic | MBps | Monitors the Read bandwidth for the node.[ISM-PERFORMANCE-MIB :: hwPerfNodeReadTraffic : 1.3.6.1.4.1.34774.4.1.21.3.1.9] | |
| huawei_ism_storage_HwPerfNodeWriteTraffic | Huawei ISM Storage Performance Node Write Traffic | MBps | Monitors the Write bandwidth for the node.[ISM-PERFORMANCE-MIB :: hwPerfNodeWriteTraffic : 1.3.6.1.4.1.34774.4.1.21.3.1.10] | |
| huawei_ism_storage_HwPerfNodeCPUUsage | Huawei ISM Storage Performance Node CPU Usage | % | Monitors the CPU usage of the node.[ISM-PERFORMANCE-MIB :: hwPerfNodeCPUUsage : 1.3.6.1.4.1.34774.4.1.21.3.1.2] | |
| Huawei Storage ISM Performance - Lun | huawei_ism_storage_HwPerfLunReadIOPS | Huawei ISM Storage Performance Lun Read IOPS | IOPS | Monitors the Current read IOPS of the LUN.[ISM-PERFORMANCE-MIB :: hwPerfLunReadIOPS : 1.3.6.1.4.1.34774.4.1.21.4.1.4] |
| huawei_ism_storage_HwPerfLunAverageIOResponseTime | Huawei ISM Storage Performance Lun Average IO Response Time | microsec | Monitors the Average IO response time.[ISM-PERFORMANCE-MIB :: hwPerfLunAverageIOResponseTime : 1.3.6.1.4.1.34774.4.1.21.4.1.13] | |
| huawei_ism_storage_HwPerfLunTotalTraffic | Huawei ISM Storage Performance Lun Total Traffic | MBps | Monitors the Current total bandwidth for the LUN.[ISM-PERFORMANCE-MIB :: hwPerfLunTotalTraffic : 1.3.6.1.4.1.34774.4.1.21.4.1.6] | |
| huawei_ism_storage_HwPerfLunWriteTraffic | Huawei ISM Storage Performance Lun Write Traffic | MBps | Monitors the Current write bandwidth for the LUN.[ISM-PERFORMANCE-MIB :: hwPerfLunWriteTraffic : 1.3.6.1.4.1.34774.4.1.21.4.1.8] | |
| huawei_ism_storage_HwPerfLunAverageWriteIOLatency | Huawei ISM Storage Performance Lun Average Write IO Latency | microsec | Monitors the Average write IO response time.[ISM-PERFORMANCE-MIB :: hwPerfLunAverageWriteIOLatency : 1.3.6.1.4.1.34774.4.1.21.4.1.16] | |
| huawei_ism_storage_HwPerfLunReadTraffic | Huawei ISM Storage Performance Lun Read Traffic | MBps | Monitors the Current read bandwidth for the LUN.[ISM-PERFORMANCE-MIB :: hwPerfLunReadTraffic : 1.3.6.1.4.1.34774.4.1.21.4.1.7] | |
| huawei_ism_storage_HwPerfLunTotalIOPS | Huawei ISM Storage Performance Lun Total IOPS | IOPS | Monitors the Current IOPS of the LUN.[ISM-PERFORMANCE-MIB :: hwPerfLunTotalIOPS : 1.3.6.1.4.1.34774.4.1.21.4.1.3] | |
| huawei_ism_storage_HwPerfLunAverageReadIOLatency | Huawei ISM Storage Performance Lun Average Read IO Latency | microsec | Monitors the Average read IO response time.[ISM-PERFORMANCE-MIB :: hwPerfLunAverageReadIOLatency : 1.3.6.1.4.1.34774.4.1.21.4.1.15] | |
| huawei_ism_storage_HwPerfLunWriteIOPS | Huawei ISM Storage Performance Lun Write IOPS | IOPS | Monitors the Current write IOPS of the LUN.[ISM-PERFORMANCE-MIB :: hwPerfLunWriteIOPS : 1.3.6.1.4.1.34774.4.1.21.4.1.5] |
Huawei Storage Hardware Statistics
Description
Monitors the Huawei Storage Hardware Statistics like Fan,Power,Controller,BBU,Disk and Enclosure.[HUAWEI-STORAGE-HARDWARE-MIB :: hwInfoFanHealthStatus : 1.3.6.1.4.1.34774.4.1.23.5.4.1.3,hwInfoFanRunningStatus : 1.3.6.1.4.1.34774.4.1.23.5.4.1.4,hwInfoPowerHealthStatus : 1.3.6.1.4.1.34774.4.1.23.5.3.1.3,hwInfoPowerRunningStatus : 1.3.6.1.4.1.34774.4.1.23.5.3.1.4,hwInfoControllerHealthStatus : 1.3.6.1.4.1.34774.4.1.23.5.2.1.2,hwInfoControllerRunningStatus : 1.3.6.1.4.1.34774.4.1.23.5.2.1.3,hwInfoControllerCPUUsage : 1.3.6.1.4.1.34774.4.1.23.5.2.1.8,hwInfoControllerMemoryUsage : 1.3.6.1.4.1.34774.4.1.23.5.2.1.9,hwInfoBBUHealthStatus : 1.3.6.1.4.1.34774.4.1.23.5.5.1.3,hwInfoBBURunningStatus : 1.3.6.1.4.1.34774.4.1.23.5.5.1.4,hwInfoDiskHealthStatus : 1.3.6.1.4.1.34774.4.1.23.5.1.1.2,hwInfoDiskRunningStatus : 1.3.6.1.4.1.34774.4.1.23.5.1.1.3,hwInfoDiskTemperature : 1.3.6.1.4.1.34774.4.1.23.5.1.1.11,hwInfoEnclosureHealthStatus : 1.3.6.1.4.1.34774.4.1.23.5.6.1.4,hwInfoEnclosureRunningStatus : 1.3.6.1.4.1.34774.4.1.23.5.6.1.5,hwInfoEnclosureTemperature : 1.3.6.1.4.1.34774.4.1.23.5.6.1.8]
Prerequisites
NULL
Supported Metric
| Monitor Name | Metric Name | Metric Display Name | Unit | Description |
|---|---|---|---|---|
| Huawei Storage - Power | huawei_storage_HwInfoPowerRunningStatus | Huawei Storage Power Running Status | Monitors the Operating status of a power supply.[HUAWEI-STORAGE-HARDWARE-MIB :: hwInfoPowerRunningStatus : 1.3.6.1.4.1.34774.4.1.23.5.3.1.4] Possible values are : 1 : Normal,2 : Running,3 : Not running,4 : Not existed,5 : Sleep in high temperature,6 : Starting,7 : Power failure rotection,8 : Spin down,9 : Started,10 : Link Up,11 : Link Down,12 : Powering on,13 : Powered off,14 : Pre-copy,15 : Copyback,16 : Reconstruction,17 : Expansion,18 : Unformatted,19 : Formatting,20 : Unmapped,21 : Initial synchronizing,22 : Consistent,23 : Synchronizing,24 : Synchronized,25 : Unsynchronized,26 : Split,27 : Online,28 : Offline,29 : Locked,30 : Enabled,31 : Disabled,32 : Balancing,33 : To be recovered,34 : Interrupted,35 : Invalid,36 : Not start,37 : Queuing,38 : Stopped,39 : Copying,40 : Completed,41 : Paused,42 : Reverse synchronizing,43 : Activated,44 : Restore,45 : Inactive,46 : Idle,47 : Powering off,48 : Charging,49 : Charging completed,50 : Discharging,51 : Upgrading,52 : Power Lost,53 : Initializing,54 : Apply change,55 : Online disable,56 : Offline disable,57 : Online frozen,58 : Offline frozen,59 : Closed,60 : Removing,61 : In service,62 : Out of service,63 : Running normal,64 : Running fail,65 : Running success,66 : Running success,67 : Running failed,68 : Waiting,69 : Canceling,70 : Canceled,71 : About to synchronize,72 : Synchronizing data,73 : Failed to synchronize,74 : Fault,75 : Migrating,76 : Migrated,77 : Activating,78 : Deactivating,79 : Start failed,80 : Stop failed,81 : Decommissioning,82 : Decommissioned,83 : Recommissioning,84 : Replacing node,85 : Scheduling,86 : Pausing,87 : Suspending,88 : Suspended,89 : Overload,90 : To be switch,91 : Switching,92 : To be cleanup,93 : Forced start,94 : Error,95 : Job completed,96 : Partition Migrating,97 : Mount,98 : Umount,99 : INSTALLING,100 : To Be Synchronized,101 : Connecting,102 : Service Switching,103 : Power-on failed,104 : REPAIRING,105 : abnormal,106 : Deleting,107 : Modifying,108 : Running(clearing data),109 : Running(synchronizing data),110 : Standby,111 : STOPPING,112 : RESTORE FAULT,113 : Cut Over,114 : Erasing,115 : Verifying,119 : Creating. | |
| Huawei Storage - Power | huawei_storage_HwInfoPowerHealthStatus | Huawei Storage Power Health Status | Monitors the Health status of a power supply.[HUAWEI-STORAGE-HARDWARE-MIB :: hwInfoPowerHealthStatus : 1.3.6.1.4.1.34774.4.1.23.5.3.1.3] Possible values are : 1: Normal,2 : Fault,3 : Pre-Fail,4 : Partially Broken,5 : Degraded,6 : Bad Sectors Found,7 : Bit Errors Found,8 : Consistent,9 : Inconsistent,10 : Busy,11 : No Input,12 : Low Battery,13 : Single Link Fault,14 : Invalid,15 : Write Protect,16 : single link,17 : No Redundant Link,18 : Offline. | |
| Huawei Storage - Enclosure | huawei_storage_HwInfoEnclosureHealthStatus | Huawei Storage Enclosure Health Status | Monitors the Health status of an enclosure.[HUAWEI-STORAGE-HARDWARE-MIB :: hwInfoEnclosureHealthStatus : 1.3.6.1.4.1.34774.4.1.23.5.6.1.4] Possible values are : 1: Normal,2 : Fault,3 : Pre-Fail,4 : Partially Broken,5 : Degraded,6 : Bad Sectors Found,7 : Bit Errors Found,8 : Consistent,9 : Inconsistent,10 : Busy,11 : No Input,12 : Low Battery,13 : Single Link Fault,14 : Invalid,15 : Write Protect,16 : single link,17 : No Redundant Link,18 : Offline. | |
| huawei_storage_HwInfoEnclosureTemperature | Huawei Storage Enclosure Temperature | Celsius | Monitors the Enclosure temperature.[HUAWEI-STORAGE-HARDWARE-MIB :: hwInfoEnclosureTemperature : 1.3.6.1.4.1.34774.4.1.23.5.6.1.8] | |
| huawei_storage_HwInfoEnclosureRunningStatus | Huawei Storage Enclosure Running Status | Monitors the Operating status of an enclosure.[HUAWEI-STORAGE-HARDWARE-MIB :: hwInfoEnclosureRunningStatus : 1.3.6.1.4.1.34774.4.1.23.5.6.1.5] Possible values are : 1 : Normal,2 : Running,3 : Not running,4 : Not existed,5 : Sleep in high temperature,6 : Starting,7 : Power failure rotection,8 : Spin down,9 : Started,10 : Link Up,11 : Link Down,12 : Powering on,13 : Powered off,14 : Pre-copy,15 : Copyback,16 : Reconstruction,17 : Expansion,18 : Unformatted,19 : Formatting,20 : Unmapped,21 : Initial synchronizing,22 : Consistent,23 : Synchronizing,24 : Synchronized,25 : Unsynchronized,26 : Split,27 : Online,28 : Offline,29 : Locked,30 : Enabled,31 : Disabled,32 : Balancing,33 : To be recovered,34 : Interrupted,35 : Invalid,36 : Not start,37 : Queuing,38 : Stopped,39 : Copying,40 : Completed,41 : Paused,42 : Reverse synchronizing,43 : Activated,44 : Restore,45 : Inactive,46 : Idle,47 : Powering off,48 : Charging,49 : Charging completed,50 : Discharging,51 : Upgrading,52 : Power Lost,53 : Initializing,54 : Apply change,55 : Online disable,56 : Offline disable,57 : Online frozen,58 : Offline frozen,59 : Closed,60 : Removing,61 : In service,62 : Out of service,63 : Running normal,64 : Running fail,65 : Running success,66 : Running success,67 : Running failed,68 : Waiting,69 : Canceling,70 : Canceled,71 : About to synchronize,72 : Synchronizing data,73 : Failed to synchronize,74 : Fault,75 : Migrating,76 : Migrated,77 : Activating,78 : Deactivating,79 : Start failed,80 : Stop failed,81 : Decommissioning,82 : Decommissioned,83 : Recommissioning,84 : Replacing node,85 : Scheduling,86 : Pausing,87 : Suspending,88 : Suspended,89 : Overload,90 : To be switch,91 : Switching,92 : To be cleanup,93 : Forced start,94 : Error,95 : Job completed,96 : Partition Migrating,97 : Mount,98 : Umount,99 : INSTALLING,100 : To Be Synchronized,101 : Connecting,102 : Service Switching,103 : Power-on failed,104 : REPAIRING,105 : abnormal,106 : Deleting,107 : Modifying,108 : Running(clearing data),109 : Running(synchronizing data),110 : Standby,111 : STOPPING,112 : RESTORE FAULT,113 : Cut Over,114 : Erasing,115 : Verifying,119 : Creating. | ||
| Huawei Storage - BBU | huawei_storage_HwInfoBBUHealthStatus | Huawei Storage BBU Health Status | Monitors the Health status of a BBU.[HUAWEI-STORAGE-HARDWARE-MIB :: hwInfoBBUHealthStatus : 1.3.6.1.4.1.34774.4.1.23.5.5.1.3] Possible values are : 1: Normal,2 : Fault,3 : Pre-Fail,4 : Partially Broken,5 : Degraded,6 : Bad Sectors Found,7 : Bit Errors Found,8 : Consistent,9 : Inconsistent,10 : Busy,11 : No Input,12 : Low Battery,13 : Single Link Fault,14 : Invalid,15 : Write Protect,16 : single link,17 : No Redundant Link,18 : Offline. | |
| huawei_storage_HwInfoBBURunningStatus | Huawei Storage BBU Running Status | Monitors the Running status of a BBU.[HUAWEI-STORAGE-HARDWARE-MIB :: hwInfoBBURunningStatus : 1.3.6.1.4.1.34774.4.1.23.5.5.1.4] Possible values are : 1 : Normal,2 : Running,3 : Not running,4 : Not existed,5 : Sleep in high temperature,6 : Starting,7 : Power failure rotection,8 : Spin down,9 : Started,10 : Link Up,11 : Link Down,12 : Powering on,13 : Powered off,14 : Pre-copy,15 : Copyback,16 : Reconstruction,17 : Expansion,18 : Unformatted,19 : Formatting,20 : Unmapped,21 : Initial synchronizing,22 : Consistent,23 : Synchronizing,24 : Synchronized,25 : Unsynchronized,26 : Split,27 : Online,28 : Offline,29 : Locked,30 : Enabled,31 : Disabled,32 : Balancing,33 : To be recovered,34 : Interrupted,35 : Invalid,36 : Not start,37 : Queuing,38 : Stopped,39 : Copying,40 : Completed,41 : Paused,42 : Reverse synchronizing,43 : Activated,44 : Restore,45 : Inactive,46 : Idle,47 : Powering off,48 : Charging,49 : Charging completed,50 : Discharging,51 : Upgrading,52 : Power Lost,53 : Initializing,54 : Apply change,55 : Online disable,56 : Offline disable,57 : Online frozen,58 : Offline frozen,59 : Closed,60 : Removing,61 : In service,62 : Out of service,63 : Running normal,64 : Running fail,65 : Running success,66 : Running success,67 : Running failed,68 : Waiting,69 : Canceling,70 : Canceled,71 : About to synchronize,72 : Synchronizing data,73 : Failed to synchronize,74 : Fault,75 : Migrating,76 : Migrated,77 : Activating,78 : Deactivating,79 : Start failed,80 : Stop failed,81 : Decommissioning,82 : Decommissioned,83 : Recommissioning,84 : Replacing node,85 : Scheduling,86 : Pausing,87 : Suspending,88 : Suspended,89 : Overload,90 : To be switch,91 : Switching,92 : To be cleanup,93 : Forced start,94 : Error,95 : Job completed,96 : Partition Migrating,97 : Mount,98 : Umount,99 : INSTALLING,100 : To Be Synchronized,101 : Connecting,102 : Service Switching,103 : Power-on failed,104 : REPAIRING,105 : abnormal,106 : Deleting,107 : Modifying,108 : Running(clearing data),109 : Running(synchronizing data),110 : Standby,111 : STOPPING,112 : RESTORE FAULT,113 : Cut Over,114 : Erasing,115 : Verifying,119 : Creating. | ||
| Huawei Storage - Controller | huawei_storage_HwInfoControllerRunningStatus | Huawei Storage Controller Running Status | Monitors the Huawei Storage Controller running status.[HUAWEI-STORAGE-HARDWARE-MIB :: hwInfoControllerRunningStatus : 1.3.6.1.4.1.34774.4.1.23.5.2.1.3]. Possible values are : 1 : Normal,2 : Running,3 : Not running,4 : Not existed,5 : Sleep in high temperature,6 : Starting,7 : Power failure rotection,8 : Spin down,9 : Started,10 : Link Up,11 : Link Down,12 : Powering on,13 : Powered off,14 : Pre-copy,15 : Copyback,16 : Reconstruction,17 : Expansion,18 : Unformatted,19 : Formatting,20 : Unmapped,21 : Initial synchronizing,22 : Consistent,23 : Synchronizing,24 : Synchronized,25 : Unsynchronized,26 : Split,27 : Online,28 : Offline,29 : Locked,30 : Enabled,31 : Disabled,32 : Balancing,33 : To be recovered,34 : Interrupted,35 : Invalid,36 : Not start,37 : Queuing,38 : Stopped,39 : Copying,40 : Completed,41 : Paused,42 : Reverse synchronizing,43 : Activated,44 : Restore,45 : Inactive,46 : Idle,47 : Powering off,48 : Charging,49 : Charging completed,50 : Discharging,51 : Upgrading,52 : Power Lost,53 : Initializing,54 : Apply change,55 : Online disable,56 : Offline disable,57 : Online frozen,58 : Offline frozen,59 : Closed,60 : Removing,61 : In service,62 : Out of service,63 : Running normal,64 : Running fail,65 : Running success,66 : Running success,67 : Running failed,68 : Waiting,69 : Canceling,70 : Canceled,71 : About to synchronize,72 : Synchronizing data,73 : Failed to synchronize,74 : Fault,75 : Migrating,76 : Migrated,77 : Activating,78 : Deactivating,79 : Start failed,80 : Stop failed,81 : Decommissioning,82 : Decommissioned,83 : Recommissioning,84 : Replacing node,85 : Scheduling,86 : Pausing,87 : Suspending,88 : Suspended,89 : Overload,90 : To be switch,91 : Switching,92 : To be cleanup,93 : Forced start,94 : Error,95 : Job completed,96 : Partition Migrating,97 : Mount,98 : Umount,99 : INSTALLING,100 : To Be Synchronized,101 : Connecting,102 : Service Switching,103 : Power-on failed,104 : REPAIRING,105 : abnormal,106 : Deleting,107 : Modifying,108 : Running(clearing data),109 : Running(synchronizing data),110 : Standby,111 : STOPPING,112 : RESTORE FAULT,113 : Cut Over,114 : Erasing,115 : Verifying,119 : Creating. | |
| huawei_storage_HwInfoControllerHealthStatus | Huawei Storage Controller Health Status | Monitors the Huawei Storage Controller health status.[HUAWEI-STORAGE-HARDWARE-MIB :: hwInfoControllerHealthStatus : 1.3.6.1.4.1.34774.4.1.23.5.2.1.2] Possible values are : 1: Normal,2 : Fault,3 : Pre-Fail,4 : Partially Broken,5 : Degraded,6 : Bad Sectors Found,7 : Bit Errors Found,8 : Consistent,9 : Inconsistent,10 : Busy,11 : No Input,12 : Low Battery,13 : Single Link Fault,14 : Invalid,15 : Write Protect,16 : single link,17 : No Redundant Link,18 : Offline. | ||
| huawei_storage_HwInfoControllerCPUUsage | Huawei Storage Controller CPU Usage | % | Monitors the CPU usage of a Huawei Storage Controller.[HUAWEI-STORAGE-HARDWARE-MIB :: hwInfoControllerCPUUsage : 1.3.6.1.4.1.34774.4.1.23.5.2.1.8] | |
| huawei_storage_HwInfoControllerMemoryUsage | Huawei Storage Controller Memory Usage | % | Monitors the Memory usage of the operating system in the Huawei Storage controller.[HUAWEI-STORAGE-HARDWARE-MIB :: hwInfoControllerMemoryUsage : 1.3.6.1.4.1.34774.4.1.23.5.2.1.9] | |
| Huawei Storage - Disk | huawei_storage_HwInfoDiskHealthStatus | Huawei Storage Disk Health Status | Monitors the Disk health status.[HUAWEI-STORAGE-HARDWARE-MIB :: hwInfoDiskHealthStatus : 1.3.6.1.4.1.34774.4.1.23.5.1.1.2]. Possible values are : 1: Normal,2 : Fault,3 : Pre-Fail,4 : Partially Broken,5 : Degraded,6 : Bad Sectors Found,7 : Bit Errors Found,8 : Consistent,9 : Inconsistent,10 : Busy,11 : No Input,12 : Low Battery,13 : Single Link Fault,14 : Invalid,15 : Write Protect,16 : single link,17 : No Redundant Link,18 : Offline. | |
| huawei_storage_HwInfoDiskRunningStatus | Huawei Storage Disk Running Status | Monitors the Disk running status.[HUAWEI-STORAGE-HARDWARE-MIB :: hwInfoDiskRunningStatus : 1.3.6.1.4.1.34774.4.1.23.5.1.1.3] Possible values are : 1 : Normal,2 : Running,3 : Not running,4 : Not existed,5 : Sleep in high temperature,6 : Starting,7 : Power failure rotection,8 : Spin down,9 : Started,10 : Link Up,11 : Link Down,12 : Powering on,13 : Powered off,14 : Pre-copy,15 : Copyback,16 : Reconstruction,17 : Expansion,18 : Unformatted,19 : Formatting,20 : Unmapped,21 : Initial synchronizing,22 : Consistent,23 : Synchronizing,24 : Synchronized,25 : Unsynchronized,26 : Split,27 : Online,28 : Offline,29 : Locked,30 : Enabled,31 : Disabled,32 : Balancing,33 : To be recovered,34 : Interrupted,35 : Invalid,36 : Not start,37 : Queuing,38 : Stopped,39 : Copying,40 : Completed,41 : Paused,42 : Reverse synchronizing,43 : Activated,44 : Restore,45 : Inactive,46 : Idle,47 : Powering off,48 : Charging,49 : Charging completed,50 : Discharging,51 : Upgrading,52 : Power Lost,53 : Initializing,54 : Apply change,55 : Online disable,56 : Offline disable,57 : Online frozen,58 : Offline frozen,59 : Closed,60 : Removing,61 : In service,62 : Out of service,63 : Running normal,64 : Running fail,65 : Running success,66 : Running success,67 : Running failed,68 : Waiting,69 : Canceling,70 : Canceled,71 : About to synchronize,72 : Synchronizing data,73 : Failed to synchronize,74 : Fault,75 : Migrating,76 : Migrated,77 : Activating,78 : Deactivating,79 : Start failed,80 : Stop failed,81 : Decommissioning,82 : Decommissioned,83 : Recommissioning,84 : Replacing node,85 : Scheduling,86 : Pausing,87 : Suspending,88 : Suspended,89 : Overload,90 : To be switch,91 : Switching,92 : To be cleanup,93 : Forced start,94 : Error,95 : Job completed,96 : Partition Migrating,97 : Mount,98 : Umount,99 : INSTALLING,100 : To Be Synchronized,101 : Connecting,102 : Service Switching,103 : Power-on failed,104 : REPAIRING,105 : abnormal,106 : Deleting,107 : Modifying,108 : Running(clearing data),109 : Running(synchronizing data),110 : Standby,111 : STOPPING,112 : RESTORE FAULT,113 : Cut Over,114 : Erasing,115 : Verifying,119 : Creating. | ||
| huawei_storage_HwInfoDiskTemperature | Huawei Storage Disk Temperature | Celsius | Monitors the Huawei Storage Disk Temperature.[HUAWEI-STORAGE-HARDWARE-MIB :: hwInfoDiskTemperature : 1.3.6.1.4.1.34774.4.1.23.5.1.1.11] | |
| Huawei Storage - Fan | huawei_storage_HwInfoFanHealthStatus | Huawei Storage Fan Health Status | Monitors the Health status of a fan.[HUAWEI-STORAGE-HARDWARE-MIB :: hwInfoFanHealthStatus : 1.3.6.1.4.1.34774.4.1.23.5.4.1.3] Possible values are : 1: Normal,2 : Fault,3 : Pre-Fail,4 : Partially Broken,5 : Degraded,6 : Bad Sectors Found,7 : Bit Errors Found,8 : Consistent,9 : Inconsistent,10 : Busy,11 : No Input,12 : Low Battery,13 : Single Link Fault,14 : Invalid,15 : Write Protect,16 : single link,17 : No Redundant Link,18 : Offline. | |
| huawei_storage_HwInfoFanRunningStatus | Huawei Storage Fan Running Status | Monitors the Operating status of a fan.[HUAWEI-STORAGE-HARDWARE-MIB :: hwInfoFanRunningStatus : 1.3.6.1.4.1.34774.4.1.23.5.4.1.4] Possible values are : 1 : Normal,2 : Running,3 : Not running,4 : Not existed,5 : Sleep in high temperature,6 : Starting,7 : Power failure rotection,8 : Spin down,9 : Started,10 : Link Up,11 : Link Down,12 : Powering on,13 : Powered off,14 : Pre-copy,15 : Copyback,16 : Reconstruction,17 : Expansion,18 : Unformatted,19 : Formatting,20 : Unmapped,21 : Initial synchronizing,22 : Consistent,23 : Synchronizing,24 : Synchronized,25 : Unsynchronized,26 : Split,27 : Online,28 : Offline,29 : Locked,30 : Enabled,31 : Disabled,32 : Balancing,33 : To be recovered,34 : Interrupted,35 : Invalid,36 : Not start,37 : Queuing,38 : Stopped,39 : Copying,40 : Completed,41 : Paused,42 : Reverse synchronizing,43 : Activated,44 : Restore,45 : Inactive,46 : Idle,47 : Powering off,48 : Charging,49 : Charging completed,50 : Discharging,51 : Upgrading,52 : Power Lost,53 : Initializing,54 : Apply change,55 : Online disable,56 : Offline disable,57 : Online frozen,58 : Offline frozen,59 : Closed,60 : Removing,61 : In service,62 : Out of service,63 : Running normal,64 : Running fail,65 : Running success,66 : Running success,67 : Running failed,68 : Waiting,69 : Canceling,70 : Canceled,71 : About to synchronize,72 : Synchronizing data,73 : Failed to synchronize,74 : Fault,75 : Migrating,76 : Migrated,77 : Activating,78 : Deactivating,79 : Start failed,80 : Stop failed,81 : Decommissioning,82 : Decommissioned,83 : Recommissioning,84 : Replacing node,85 : Scheduling,86 : Pausing,87 : Suspending,88 : Suspended,89 : Overload,90 : To be switch,91 : Switching,92 : To be cleanup,93 : Forced start,94 : Error,95 : Job completed,96 : Partition Migrating,97 : Mount,98 : Umount,99 : INSTALLING,100 : To Be Synchronized,101 : Connecting,102 : Service Switching,103 : Power-on failed,104 : REPAIRING,105 : abnormal,106 : Deleting,107 : Modifying,108 : Running(clearing data),109 : Running(synchronizing data),110 : Standby,111 : STOPPING,112 : RESTORE FAULT,113 : Cut Over,114 : Erasing,115 : Verifying,119 : Creating. |
Huawei Storage Pool Statistics
Description
Monitors the Huawei Storage Pool Statistics like Health Status,Running Status,Total Capacity,Subscribed Capacity,Free Capacity and Storage Pool Capacity Utilization.[HUAWEI-STORAGE-SPACE-MIB :: hwInfoStoragePoolHealthStatus : 1.3.6.1.4.1.34774.4.1.23.4.2.1.5,hwInfoStoragePoolRunningStatus : 1.3.6.1.4.1.34774.4.1.23.4.2.1.6,hwInfoStoragePoolTotalCapacity : 1.3.6.1.4.1.34774.4.1.23.4.2.1.7,hwInfoStoragePoolSubscribedCapacity : 1.3.6.1.4.1.34774.4.1.23.4.2.1.8,hwInfoStoragePoolFreeCapacity : 1.3.6.1.4.1.34774.4.1.23.4.2.1.9]
Prerequisites
NULL
Supported Metric
| Monitor Name | Metric Name | Metric Display Name | Unit | Description |
|---|---|---|---|---|
| Huawei Storage Pool - Statistics | huawei_storage_HwInfoStoragePoolSubscribedCapacity | Huawei Storage Pool Subscribed Capacity | MB | Monitors the Used capacity of a storage pool.[HUAWEI-STORAGE-SPACE-MIB :: hwInfoStoragePoolSubscribedCapacity : 1.3.6.1.4.1.34774.4.1.23.4.2.1.8] |
| huawei_storage_HwInfoStoragePoolTotalCapacity | Huawei Storage Pool Total Capacity | MB | Monitors the Total capacity of a storage pool.[HUAWEI-STORAGE-SPACE-MIB :: hwInfoStoragePoolTotalCapacity : 1.3.6.1.4.1.34774.4.1.23.4.2.1.7] | |
| huawei_storage_StoragePoolCapacityUtilization | Huawei Storage Pool Capacity Utilization | % | Monitors the Huawei Storage Pool Capacity Utilization in percentage. | |
| huawei_storage_HwInfoStoragePoolHealthStatus | Huawei Storage Pool Health Status | Monitors the Health status of a storage pool.[HUAWEI-STORAGE-SPACE-MIB :: hwInfoStoragePoolHealthStatus : 1.3.6.1.4.1.34774.4.1.23.4.2.1.5] Possible values are : 1: Normal,2 : Fault,3 : Pre-Fail,4 : Partially Broken,5 : Degraded,6 : Bad Sectors Found,7 : Bit Errors Found,8 : Consistent,9 : Inconsistent,10 : Busy,11 : No Input,12 : Low Battery,13 : Single Link Fault,14 : Invalid,15 : Write Protect,16 : single link,17 : No Redundant Link,18 : Offline. | ||
| huawei_storage_HwInfoStoragePoolRunningStatus | Huawei Storage Pool Running Status | Monitors the Operating status of a storage pool.[HUAWEI-STORAGE-SPACE-MIB :: hwInfoStoragePoolRunningStatus : 1.3.6.1.4.1.34774.4.1.23.4.2.1.6] Possible values are : 1 : Normal,2 : Running,3 : Not running,4 : Not existed,5 : Sleep in high temperature,6 : Starting,7 : Power failure rotection,8 : Spin down,9 : Started,10 : Link Up,11 : Link Down,12 : Powering on,13 : Powered off,14 : Pre-copy,15 : Copyback,16 : Reconstruction,17 : Expansion,18 : Unformatted,19 : Formatting,20 : Unmapped,21 : Initial synchronizing,22 : Consistent,23 : Synchronizing,24 : Synchronized,25 : Unsynchronized,26 : Split,27 : Online,28 : Offline,29 : Locked,30 : Enabled,31 : Disabled,32 : Balancing,33 : To be recovered,34 : Interrupted,35 : Invalid,36 : Not start,37 : Queuing,38 : Stopped,39 : Copying,40 : Completed,41 : Paused,42 : Reverse synchronizing,43 : Activated,44 : Restore,45 : Inactive,46 : Idle,47 : Powering off,48 : Charging,49 : Charging completed,50 : Discharging,51 : Upgrading,52 : Power Lost,53 : Initializing,54 : Apply change,55 : Online disable,56 : Offline disable,57 : Online frozen,58 : Offline frozen,59 : Closed,60 : Removing,61 : In service,62 : Out of service,63 : Running normal,64 : Running fail,65 : Running success,66 : Running success,67 : Running failed,68 : Waiting,69 : Canceling,70 : Canceled,71 : About to synchronize,72 : Synchronizing data,73 : Failed to synchronize,74 : Fault,75 : Migrating,76 : Migrated,77 : Activating,78 : Deactivating,79 : Start failed,80 : Stop failed,81 : Decommissioning,82 : Decommissioned,83 : Recommissioning,84 : Replacing node,85 : Scheduling,86 : Pausing,87 : Suspending,88 : Suspended,89 : Overload,90 : To be switch,91 : Switching,92 : To be cleanup,93 : Forced start,94 : Error,95 : Job completed,96 : Partition Migrating,97 : Mount,98 : Umount,99 : INSTALLING,100 : To Be Synchronized,101 : Connecting,102 : Service Switching,103 : Power-on failed,104 : REPAIRING,105 : abnormal,106 : Deleting,107 : Modifying,108 : Running(clearing data),109 : Running(synchronizing data),110 : Standby,111 : STOPPING,112 : RESTORE FAULT,113 : Cut Over,114 : Erasing,115 : Verifying,119 : Creating. | ||
| huawei_storage_HwInfoStoragePoolFreeCapacity | Huawei Storage Pool Free Capacity | MB | Monitors the Available capacity of a storage pool.[HUAWEI-STORAGE-SPACE-MIB :: hwInfoStoragePoolFreeCapacity : 1.3.6.1.4.1.34774.4.1.23.4.2.1.9] |
Huawei ISM Storage Statistics
Description
Monitors the Huawei ISM Storage statistics like Storage status,used capacity,total capacity,Lun Capacity and Lun Status.[ISM-STORAGE-SVC-MIB :: status : 1.3.6.1.4.1.34774.4.1.1.3.0,usedCapacity : 1.3.6.1.4.1.34774.4.1.1.4.0,totalCapacity : 1.3.6.1.4.1.34774.4.1.1.5.0,hwStorageLunCapacity : 1.3.6.1.4.1.34774.4.1.19.9.4.1.5,hwStorageLunStatus : 1.3.6.1.4.1.34774.4.1.19.9.4.1.11]
Prerequisites
NULL
Supported Metric
| Monitor Name | Metric Name | Metric Display Name | Unit | Description |
|---|---|---|---|---|
| Huawei ISM Storage - Status | huawei_storage_CapacityUtilization | Huawei ISM Storage Capacity Utilization | % | Monitors the Huawei ISM Storage Capacity Utilization. |
| huawei_storage_UsedCapacity | Huawei ISM Storage Used Capacity | MB | Monitors the Used capacity of the storage device.[ISM-STORAGE-SVC-MIB :: usedCapacity : 1.3.6.1.4.1.34774.4.1.1.4.0] | |
| huawei_storage_Status | Huawei ISM Storage Status | Monitors the System operating status.[ISM-STORAGE-SVC-MIB :: status : 1.3.6.1.4.1.34774.4.1.1.3.0] Possible values are : 1 : Normal,2 : Running,3 : Not running,4 : Not existed,5 : Sleep in high temperature,6 : Starting,7 : Power failure rotection,8 : Spin down,9 : Started,10 : Link Up,11 : Link Down,12 : Powering on,13 : Powered off,14 : Pre-copy,15 : Copyback,16 : Reconstruction,17 : Expansion,18 : Unformatted,19 : Formatting,20 : Unmapped,21 : Initial synchronizing,22 : Consistent,23 : Synchronizing,24 : Synchronized,25 : Unsynchronized,26 : Split,27 : Online,28 : Offline,29 : Locked,30 : Enabled,31 : Disabled,32 : Balancing,33 : To be recovered,34 : Interrupted,35 : Invalid,36 : Not start,37 : Queuing,38 : Stopped,39 : Copying,40 : Completed,41 : Paused,42 : Reverse synchronizing,43 : Activated,44 : Restore,45 : Inactive,46 : Idle,47 : Powering off,48 : Charging,49 : Charging completed,50 : Discharging,51 : Upgrading,52 : Power Lost,53 : Initializing,54 : Apply change,55 : Online disable,56 : Offline disable,57 : Online frozen,58 : Offline frozen,59 : Closed,60 : Removing,61 : In service,62 : Out of service,63 : Running normal,64 : Running fail,65 : Running success,66 : Running success,67 : Running failed,68 : Waiting,69 : Canceling,70 : Canceled,71 : About to synchronize,72 : Synchronizing data,73 : Failed to synchronize,74 : Fault,75 : Migrating,76 : Migrated,77 : Activating,78 : Deactivating,79 : Start failed,80 : Stop failed,81 : Decommissioning,82 : Decommissioned,83 : Recommissioning,84 : Replacing node,85 : Scheduling,86 : Pausing,87 : Suspending,88 : Suspended,89 : Overload,90 : To be switch,91 : Switching,92 : To be cleanup,93 : Forced start,94 : Error,95 : Job completed,96 : Partition Migrating,97 : Mount,98 : Umount,99 : INSTALLING,100 : To Be Synchronized,101 : Connecting,102 : Service Switching,103 : Power-on failed,104 : REPAIRING,105 : abnormal,106 : Deleting,107 : Modifying,108 : Running(clearing data),109 : Running(synchronizing data),110 : Standby,111 : STOPPING,112 : RESTORE FAULT,113 : Cut Over,114 : Erasing,115 : Verifying,119 : Creating. | ||
| huawei_storage_TotalCapacity | Huawei ISM Storage Total Capacity | MB | Monitors the Total capacity of the storage device.[ISM-STORAGE-SVC-MIB :: totalCapacity : 1.3.6.1.4.1.34774.4.1.1.5.0] | |
| Huawei ISM Storage - Lun | huawei_storage_HwStorageLunStatus | Huawei ISM Storage Lun Status | Monitors the Status of the LUN.[ISM-STORAGE-SVC-MIB :: hwStorageLunStatus : 1.3.6.1.4.1.34774.4.1.19.9.4.1.11] Possible values are : 1: normal,2 : fault,3 : notformat,4 : formatting. | |
| huawei_storage_HwStorageLunCapacity | Huawei ISM Storage Lun Capacity | KB | Monitors the Capacity of the LUN.[ISM-STORAGE-SVC-MIB :: hwStorageLunCapacity : 1.3.6.1.4.1.34774.4.1.19.9.4.1.5] |
HyperflexAlarmTemplate
Description
Monitors HyperflexAlarmMonitor metrics
Prerequisites
No prerequisite
Supported Metric
| Monitor Name | Metric Name | Metric Display Name | Unit | Description |
|---|---|---|---|---|
| HyperflexAlarmMonitor | hyperflex_cluster_alarm_HXA-CLU-0012 | Hyperflex Alarm HXA CLU 0012 | NULL | Hyperflex Alarm HXA CLU 0012 |
| hyperflex_cluster_alarm_HXA-CLU-0016 | Hyperflex Alarm HXA CLU 0016 | NULL | Hyperflex Alarm HXA CLU 0016 |
HyperflexClusterEventsTemplate
Description
Monitors HyperflexClusterEventsMonitor metrics
Prerequisites
No prerequisite
Supported Metric
| Monitor Name | Metric Name | Metric Display Name | Unit | Description |
|---|---|---|---|---|
| HyperflexClusterEventsMonitor | hyperflex_cluster_event_HXSshAccessToggleActionSuccess | Hyperflex Event HXSshAccessToggleActionSuccess | NULL | Hyperflex Event HXSshAccessToggleActionSuccess |
| hyperflex_cluster_event_NodeDecommissionedEvent | Hyperflex Event NodeDecommissionedEvent | NULL | Hyperflex Event NodeDecommissionedEvent | |
| hyperflex_cluster_event_ClusterPolicyComplianceDegradedEvent | Hyperflex Event ClusterPolicyComplianceDegradedEvent | NULL | Hyperflex Event ClusterPolicyComplianceDegradedEvent | |
| hyperflex_cluster_event_ClusterAddedEvent | Hyperflex Event ClusterAddedEvent | NULL | Hyperflex Event ClusterAddedEvent | |
| hyperflex_cluster_event_AlarmResetByEvent | Hyperflex Event AlarmResetByEvent | NULL | Hyperflex Event AlarmResetByEvent | |
| hyperflex_cluster_event_ClusterUpgradeCompletedEvent | Hyperflex Event ClusterUpgradeCompletedEvent | NULL | Hyperflex Event ClusterUpgradeCompletedEvent | |
| hyperflex_cluster_event_ClusterReadyEvent | Hyperflex Event ClusterReadyEvent | NULL | Hyperflex Event ClusterReadyEvent | |
| hyperflex_cluster_event_SmartLicenseEvalExpiredEvent | Hyperflex Event SmartLicenseEvalExpiredEvent | NULL | Hyperflex Event SmartLicenseEvalExpiredEvent | |
| hyperflex_cluster_event_NodeUpgradeStartedEvent | Hyperflex Event NodeUpgradeStartedEvent | NULL | Hyperflex Event NodeUpgradeStartedEvent | |
| hyperflex_cluster_event_NodeUpgradeCompletedEvent | Hyperflex Event NodeUpgradeCompletedEvent | NULL | Hyperflex Event NodeUpgradeCompletedEvent | |
| hyperflex_cluster_event_ClusterPolicyComplianceFailedEvent | Hyperflex Event ClusterPolicyComplianceFailedEvent | NULL | Hyperflex Event ClusterPolicyComplianceFailedEvent | |
| hyperflex_cluster_event_ClusterUnhealthyEvent | Hyperflex Event ClusterUnhealthyEvent | NULL | Hyperflex Event ClusterUnhealthyEvent | |
| hyperflex_cluster_event_SmartLicenseOutOfComplianceEvent | Hyperflex Event SmartLicenseOutOfComplianceEvent | NULL | Hyperflex Event SmartLicenseOutOfComplianceEvent | |
| hyperflex_cluster_event_NodeReadyForIOEvent | Hyperflex Event NodeReadyForIOEvent | NULL | Hyperflex Event NodeReadyForIOEvent | |
| hyperflex_cluster_event_AlarmTriggered | Hyperflex Event AlarmTriggered | NULL | Hyperflex Event AlarmTriggered | |
| hyperflex_cluster_event_NodeMaintenanceExitedEvent | Hyperflex Event NodeMaintenanceExitedEvent | NULL | Hyperflex Event NodeMaintenanceExitedEvent | |
| hyperflex_cluster_event_HXLocalUserWarningEvent | Hyperflex Event HXLocalUserWarningEvent | NULL | Hyperflex Event HXLocalUserWarningEvent | |
| hyperflex_cluster_event_VCConnectionUp | Hyperflex Event VCConnectionUp | NULL | Hyperflex Event VCConnectionUp | |
| hyperflex_cluster_event_ClusterHealthNormalEvent | Hyperflex Event ClusterHealthNormalEvent | NULL | Hyperflex Event ClusterHealthNormalEvent | |
| hyperflex_cluster_event_ClusterPolicyComplianceSatisfiedEvent | Hyperflex Event ClusterPolicyComplianceSatisfiedEvent | NULL | Hyperflex Event ClusterPolicyComplianceSatisfiedEvent | |
| hyperflex_cluster_event_NodeMaintenanceEnteredEvent | Hyperflex Event NodeMaintenanceEnteredEvent | NULL | Hyperflex Event NodeMaintenanceEnteredEvent | |
| hyperflex_cluster_event_ClusterPolicyComplianceImprovedEvent | Hyperflex Event ClusterPolicyComplianceImprovedEvent | NULL | Hyperflex Event ClusterPolicyComplianceImprovedEvent | |
| hyperflex_cluster_event_VCConnectionDown | Hyperflex Event VCConnectionDown | NULL | Hyperflex Event VCConnectionDown | |
| hyperflex_cluster_event_ClusterUpgradeStartedEvent | Hyperflex Event ClusterUpgradeStartedEvent | NULL | Hyperflex Event ClusterUpgradeStartedEvent |
HyperflexClusterPerformanceTemplate
Description
Monitors HyperflexClusterPerformanceMonitor metrics
Prerequisites
No prerequisite
Supported Metric
| Monitor Name | Metric Name | Metric Display Name | Unit | Description |
|---|---|---|---|---|
| HyperflexClusterPerformanceMonitor | hyperflex_cluster_Stats_Counters_NFSReads_Rate | Cluster Read IOPS | NULL | Cluster Read IOPS |
| hyperflex_cluster_Stats_Counters_NFSWrites_Count | Cluster Write Latency | NULL | Cluster Write Latency | |
| hyperflex_cluster_Stats_Counters_NFSWrites_Rate | Cluster Write IOPS | NULL | Cluster Write IOPS | |
| hyperflex_cluster_stats_Counters_NFSReads_Bytes | Cluster Read ThroughPut | NULL | Cluster Read ThroughPut | |
| hyperflex_cluster_Stats_Counters_NFSWrites_Bytes | Cluster Write ThroughPut | NULL | Cluster Write ThroughPut | |
| hyperflex_cluster_Stats_Counters_NFSReads_Count | Cluster Read Latency | NULL | Cluster Read Latency |
HyperflexClusterTemplate
Description
Monitors HyperflexClusterMonitor metrics
Prerequisites
No prerequisite
Supported Metric
| Monitor Name | Metric Name | Metric Display Name | Unit | Description |
|---|---|---|---|---|
| HyperflexClusterMonitor | hyperflex_cluster_CompressionSavings | Hyperflex Cluster CompressionSavings | % | Hyperflex Cluster CompressionSavings |
| hyperflex_cluster_TotalSavings | Hyperflex Cluster TotalSavings | % | Hyperflex Cluster TotalSavings | |
| hyperflex_cluster_CapacityUtilization | Hyperflex Cluster CapacityUtilization | % | Hyperflex Cluster CapacityUtilization | |
| hyperflex_cluster_PolicyCompliance | Hyperflex Cluster PolicyCompliance | NULL | Hyperflex Cluster PolicyCompliance | |
| hyperflex_cluster_State | Hyperflex Cluster State | NULL | Hyperflex Cluster State | |
| hyperflex_cluster_UsedCapacity | Hyperflex Cluster UsedCapacity | TB | Hyperflex Cluster UsedCapacity | |
| hyperflex_cluster_FreeCapacity | Hyperflex Cluster FreeCapacity | TB | Hyperflex Cluster FreeCapacity | |
| hyperflex_cluster_SpaceStatus | Hyperflex Cluster SpaceStatus | NULL | Hyperflex Cluster SpaceStatus | |
| hyperflex_cluster_ResiliencyState | Hyperflex Cluster ResiliencyState | NULL | Hyperflex Cluster ResiliencyState | |
| hyperflex_cluster_RawCapacity | Hyperflex Cluster RawCapacity | TB | Hyperflex Cluster RawCapacity | |
| hyperflex_cluster_TotalCapacity | Hyperflex Cluster TotalCapacity | TB | Hyperflex Cluster TotalCapacity | |
| hyperflex_cluster_DeduplicationSavings | Hyperflex Cluster DeduplicationSavings | % | Hyperflex Cluster DeduplicationSavings |
HyperflexControllerVmTemplate
Description
Monitors HyperflexControllerVMMonitor metrics
Prerequisites
No prerequisite
Supported Metric
| Monitor Name | Metric Name | Metric Display Name | Unit | Description |
|---|---|---|---|---|
| hyperflex_cluster_node_controller_vm_Disk_Count | Hyperflex Node controllerVM Disk Count | count | Hyperflex Node controllerVM Disk Count | |
| hyperflex_cluster_node_controller_vm_ConfiguredMemory | Hyperflex Node controllerVM Configured Memory | Bytes | Hyperflex Node controllerVM Configured Memory | |
| hyperflex_cluster_node_controller_vm_State | Hyperflex Node controllerVM State | NULL | Hyperflex Node controllerVM State |
HyperflexDatastoreTemplate
Description
Monitors HyperflexDatastoreMonitor metrics
Prerequisites
No prerequisite
Supported Metric
| Monitor Name | Metric Name | Metric Display Name | Unit | Description |
|---|---|---|---|---|
| HyperflexDatastoreMonitor | hyperflex_cluster_datastore_TotalCapacity | hyperflex Datastore TotalCapacity | TB | hyperflex Datastore TotalCapacity |
| hyperflex_cluster_datastore_UsedCapacity | Hyperflex Datastore UsedCapacity | TB | Hyperflex Datastore UsedCapacity | |
| hyperflex_cluster_datastore_Mirrors | Hyperflex Datastore Mirrors | count | Hyperflex Datastore Mirrors | |
| hyperflex_cluster_datastore_ProvisionedCapacity | Hyperflex Datastore ProvisionedCapacity | TB | Hyperflex Datastore ProvisionedCapacity | |
| hyperflex_cluster_datastore_Status | Hyperflex Datastore Status | NULL | Hyperflex Datastore Status | |
| hyperflex_cluster_datastore_FreeCapacity | Hyperflex Datastore FreeCapacity | TB | -Hyperflex_ Datastore FreeCapacity | |
| hyperflex_cluster_datastore_Num_of_StripesforLargeFiles | Hyperflex Datastore NumofStripesforLargeFiles | count | Hyperflex Datastore NumofStripesforLargeFiles | |
| hyperflex_cluster_datastore_DataBlock_Size | Hyperflex Datastore DataBlock Size | KB | Hyperflex Datastore DataBlock Size | |
| hyperflex_cluster_datastore_Utlization | Hyperflex Datastore Utlization | % | Hyperflex Datastore Utlization | |
| hyperflex_cluster_datastore_UnCompressedUsed | Hyperflex Datastore UnCompressedUsed | KB | Hyperflex Datastore UnCompressedUsed |
HyperflexHostPerformanceTemplate
Description
Monitors HyperflexHostPerformanceMonitor metrics
Prerequisites
No prerequisite
Supported Metric
| Monitor Name | Metric Name | Metric Display Name | Unit | Description |
|---|---|---|---|---|
| HyperflexHostPerformanceMonitor | hyperflex_cluster_node_Stats_Counters_NFSWrites_Rate | Hyperflex Host Write IOPS | NULL | Hyperflex Host Write IOPS |
| hyperflex_cluster_node_Stats_Counters_NFSWrites_Bytes | Hyperflex Host Write ThroughPut | NULL | Hyperflex Host Write ThroughPut | |
| hyperflex_cluster_node_Stats_Counters_NFSReads_Count | Hyperflex Host Read Latency | NULL | Hyperflex Host Read Latency | |
| hyperflex_cluster_node_Stats_Counters_NFSReads_Rate | Hyperflex Host Read IOPS | NULL | Hyperflex Host Read IOPS | |
| hyperflex_cluster_node_Stats_Counters_NFSWrites_Count | Hyperflex Host Write Latency | NULL | Hyperflex Host Write Latency | |
| hyperflex_cluster_node_Stats_Counters_NFSReads_Bytes | Hyperflex Host Read ThroughPut | NULL | Hyperflex Host Read ThroughPut |
HyperflexHostTemplate
Description
Monitors hyperflex host status info. Validated against hyperflex version 4.0.2d-35606.
Prerequisites
No prerequisite
Supported Metric
| Monitor Name | Metric Name | Metric Display Name | Unit | Description |
|---|---|---|---|---|
| HyperflexHostMonitor | hyperflex_cluster_host_Status | Hyperflex Host Status | NULL | hyperflex host status info. 0- OFFLINE,1- ONLINE |
HyperflexNodeDiskTemplate
Description
Monitors HyperflexNodeDiskMonitor metrics
Prerequisites
No prerequisite
Supported Metric
| Monitor Name | Metric Name | Metric Display Name | Unit | Description |
|---|---|---|---|---|
| HyperflexNodeDiskMonitor | hyperflex_cluster_node_Disk_Utilization | Hyperflex Node Disk Utilization | % | Hyperflex Node Disk Utilization |
| hyperflex_cluster_node_Disk_Status | Hyperflex Node Disk Status | NULL | Hyperflex Node Disk Status | |
| hyperflex_cluster_node_Disk_Capacity | Hyperflex Node Disk Capacity | GB | Hyperflex Node Disk Capacity | |
| hyperflex_cluster_node_Disk_Usage | Hyperflex Node Disk Usage | NULL | Hyperflex Node Disk Usage | |
| hyperflex_cluster_node_Disk_UsedCapacity | Hyperflex Node Disk UsedCapacity | GB | Hyperflex Node Disk UsedCapacity | |
| hyperflex_cluster_node_Disk_Type | Hyperflex Node Disk Type | NULL | Hyperflex Node Disk Type | |
| hyperflex_cluster_node_Disk_FreeCapacity | Hyperflex Node Disk FreeCapacity | GB | Hyperflex Node Disk FreeCapacity | |
| hyperflex_cluster_node_Disk_State | Hyperflex Node Disk State | NULL | Hyperflex Node Disk State | |
| hyperflex_cluster_node_Disk_Medium | Hyperflex Node Disk Medium | NULL | Hyperflex Node Disk Medium |
HyperflexVirtualMachineTemplate
Description
Monitors HyperflexVirtualMachineMonitor metrics
Prerequisites
No prerequisite
Supported Metric
| Monitor Name | Metric Name | Metric Display Name | Unit | Description |
|---|---|---|---|---|
| HyperflexVirtualMachineMonitor | hyperflex_cluster_virtualmachine_Storage_FreeCapacity | Hyperflex Virtualmachine Storage FreeCapacity | GB | Hyperflex Virtualmachine Storage FreeCapacity |
| hyperflex_cluster_virtualmachine_Storage_Utlization | Hyperflex Virtualmachine Storage Utlization | % | Hyperflex Virtualmachine Storage Utlization | |
| hyperflex_cluster_virtualmachine_Storage_Capacity | Hyperflex Virtualmachine Storage Capacity | GB | Hyperflex Virtualmachine Storage Capacity | |
| hyperflex_cluster_virtualmachine_Storage_UsedCapacity | Hyperflex Virtualmachine Storage UsedCapacity | GB | Hyperflex Virtualmachine Storage UsedCapacity | |
| hyperflex_cluster_virtualmachine_State | Hyperflex Virtualmachine State | NULL | Hyperflex Virtualmachine State |
Hyperv_Host_Template
Description
monitors hyperv host metrics
Prerequisites
No prerequisite
Supported Metric
| Monitor Name | Metric Name | Metric Display Name | Unit | Description |
|---|---|---|---|---|
| Hyperv_Host_Monitor | hyperv_memory_usage_Total_Physical_Memory_In_GB | Total Physical Memory | GB | |
| hyperv_memory_usage_Virtual_TLB_Pages | Virtual TLB Pages | count | ||
| hyperv_network_statistics_Network_Adapters_Bytes_Sent_Per_Sec | Network Adapters Bytes Sent | Bps | ||
| hyperv_cpu_usage_Idle_CPU_Utilization | Idle CPU Utilization | % | ||
| hyperv_network_statistics_Virtual_Switch_Bytes_Received_Per_Sec | Virtual Switch Bytes Received | Bps | ||
| hyperv_memory_usage_Page_File_Usage | Page File Usage | GB | ||
| hyperv_network_statistics_Virtual_Switch_Bytes_Sent_Per_Sec | Virtual Switch Bytes Sent | Bps | ||
| hyperv_memory_usage_Virtual_Memory_In_GB | Virtual Memory | GB | ||
| hyperv_cpu_usage_Hypervisor_CPU_Utilization | Hypervisor CPU Utilization | % | ||
| hyperv_cpu_usage_Total_CPU_Utilization | Total CPU Utilization | % | ||
| hyperv_system_services_Virtual_System_Management_Service | Hyperv Virtual System Management Service | NULL | Hyperv Virtual System Management Service | |
| hyperv_network_statistics_Virtual_Switch_Packets_Per_Sec | Virtual Switch Total Packets | packets/sec | ||
| hyperv_network_statistics_Network_Adapters_Bytes_Received_Per_Sec | Network Adapters Bytes Received | Bps | ||
| hyperv_network_statistics_Network_Adapters_Packets_Sent_Per_Sec | Network Adapters Packets Sent | packets/sec | ||
| hyperv_network_statistics_Network_Adapters_Bytes_Total_Per_Sec | Network Adapters Total Bytes | Bps | ||
| hyperv_network_statistics_Network_Adapters_Packets_Per_Sec | Network Adapter Packets Per Sec | packets/sec | ||
| hyperv_network_statistics_Legacy_Network_Adapters_Bytes_Received_Per_Sec | Legacy Network Adapters Bytes Received | Bps | ||
| hyperv_memory_usage_Total_Remote_Physical_Pages | Total Remote Physical Pages | count | ||
| hyperv_network_statistics_Legacy_Network_Adapters_Bytes_Sent_Per_Sec | Legacy Network Adapters Bytes Sent | Bps | ||
| hyperv_system_services_Networking_Management_Service | Hyperv Networking Management Service | NULL | Hyperv Networking Management Service | |
| hyperv_memory_usage_Available_MBytes | Available MBytes | MB | ||
| hyperv_network_statistics_Virtual_Switch_Packets_Sent_Per_Sec | Virtual Switch Packets Sent | packets/sec | ||
| hyperv_system_services_Image_Management_Service | Hyperv Image Management Service | NULL | Hyperv Image Management Service | |
| hyperv_cpu_usage_Guest_CPU_Utilization | Guest CPU Utilization | % | ||
| hyperv_network_statistics_Legacy_Network_Adapters_Bytes_Dropped | Legacy Network Adapters Bytes Dropped | Bps | ||
| hyperv_network_statistics_Legacy_Network_Adapters_Frames_Sent_Per_Sec | Legacy Network Adapters Frames Sent | NULL | ||
| hyperv_memory_usage_SwapMemoryUsage_In_GB | Swap Memory Usage | GB | ||
| hyperv_network_statistics_Virtual_Switch_Packets_Received_Per_Sec | Virtual Switch Packets Received | packets/sec | ||
| hyperv_memory_usage_Deposited_Pages | Deposited Pages | count | ||
| hyperv_network_statistics_Network_Adapters_Packets_Received_Per_Sec | Network Adapters Packets Received | packets/sec | ||
| hyperv_network_statistics_Virtual_Switch_Bytes_Per_Sec | Virtual Switch Bytes Per Sec | Bps |
Hyperv_Storage_Disk_Template
Description
Monitors hyperv storage disk metrics
Prerequisites
No prerequisite
Supported Metric
| Monitor Name | Metric Name | Metric Display Name | Unit | Description |
|---|---|---|---|---|
| Hyperv_Storage_Disk_Monitor | hyperv_storage_statistics_Logical_Disk_Transfer_Per_Sec | Logical Disk Transfer | NULL | |
| hyperv_storage_disk_Utilization | Storage Disk Utilization | % | The percentage utilization of disk | |
| hyperv_storage_statistics_Physical_Disk_Bytes_Per_Sec | Physical Disk Bytes Per Sec | Bps | ||
| hyperv_storage_disk_Healthy_Status | Storage Disk Healthy Status | NULL | Disk healthy status | |
| hyperv_storage_statistics_Logical_Disk_Bytes_Per_Sec | Logical Disk Bytes Per Sec | Bps | ||
| hyperv_storage_statistics_Physical_Disk_Queue_Length | Physical Disk Queue Length | NULL | ||
| hyperv_storage_statistics_Physical_Disk_Transfer_Per_Sec | Physical Disk Transfer | NULL | ||
| hyperv_storage_statistics_Logical_Disk_Queue_Length | Logical Disk Queue Length | NULL | ||
| hyperv_storage_disk_Operational_Status | Storage Disk Operational Status | NULL | Disk operational status |
Infoblox
Description
Monitors CPU utilization,memory utilization,dns statistics,dhcp statistics,ddns statistics,grid status,replication status,global services status and DHCP subnet usage of infoblox appliance.
Prerequisites
No prerequisite
Supported Metric
| Monitor Name | Metric Name | Metric Display Name | Unit | Description |
|---|---|---|---|---|
| Host System Uptime | system.uptime | System Uptime | s | The amount of time since this host was last initialized.[OID - 1.3.6.1.2.1.25.1.1.0] |
| Infoblox Appliance Performance Monitoring | ib.system.cpu.usage | CPU Usage | % | Provides current average CPU usage.[OID: 1.3.6.1.4.1.7779.3.1.1.2.1.8.1.1.0] |
| ib.system.mem.usage | Memory Usage | % | Provides current Memory usage.[OID: 1.3.6.1.4.1.7779.3.1.1.2.1.8.2.1.0] | |
| ib.cpu.temperature | Infoblox CPU Temperature | C | Provides the temperature of the Infoblox CPU.[OID: 1.3.6.1.4.1.7779.3.1.1.2.1.1] | |
| ib.member.grid.status | Grid status | Provides the current member status (either Active or Passive) if there are several Infoblox appliances put together in a grid (= acting as one Infoblox but highly available).[OIDs: 1.3.6.1.4.1.7779.3.1.1.2.1.13.0] | ||
| ib.dns.security.invalidport.5min | Last 5min DNS Responses to Invalid Port | Provides number of DNS responses to invalid ports during the last 5 minutes.[OID: 1.3.6.1.4.1.7779.3.1.1.2.1.3.1.4.1.2.0] | ||
| ib.dns.security.invalidtxid.5min | Last 5min Invalid TXID DNS Responses Count | Provides number of DNS responses with an invalid TXID during the last 5 minutes.[OID: 1.3.6.1.4.1.7779.3.1.1.2.1.3.1.4.2.2.0] | ||
| ib.dns.zonetransfer.count | Zone Transfer Count | Total number of successful zone transfers from an Infoblox primary or secondary DNS server to a DNS client,since the DNS service was last restarted. Note that this counter tracks the number of successful full zone transfers (AXFRs) and incremental zone transfers (IXFRs).[OID: 1.3.6.1.4.1.7779.3.1.1.3.1.4.0] | ||
| ib.dns.nonauthoritative.avglatency.5min | Incoming DNS Queries Non-Authoritative Reply Average Latency | ms | Average Latencies (in microseconds) for incoming DNS queries during the last 5 minutes where the reply was non authoritative.[OIDs: 1.3.6.1.4.1.7779.3.1.1.2.1.3.1.2.2.1.0,1.3.6.1.4.1.7779.3.1.1.2.1.3.1.2.2.2.0] | |
| ib.dns.authoritative.avglatency.5min | Incoming DNS Queries Authoritative Reply Average Latency | ms | Provides average Latencies (in microseconds) for incoming DNS queries during the last 5 minutes where the reply was authoritative.[OIDs: 1.3.6.1.4.1.7779.3.1.1.2.1.3.1.3.2.1.0,1.3.6.1.4.1.7779.3.1.1.2.1.3.1.3.2.2.0] | |
| ib.dns.summary.success | DNS Success Responses Summary | psec | Provides success DNS responses summary per second. | |
| ib.dns.summary.nxrrset | NxRRset DNS Queries Summary | psec | Provides number of DNS queries summary (per second) received for non-existent record. | |
| ib.dns.summary.nxdomain | NxDomain DNS Queries Summary | psec | Provides number of DNS queries summary (per second) received for non-existent domain. | |
| ib.dns.summary.failure | Failed DNS Queries Summary | psec | Provides number of Failed queries summary (per second). | |
| ib.ddns.update.success | Successful DDNS Updates | psec | Provides number of successful dynamic DNS updates per second.[OID: 1.3.6.1.4.1.7779.3.1.1.3.1.3.1.0] | |
| ib.ddns.update.failures | Failed DDNS Updates | psec | Provides number of failure dynamic DNS updates per second.[OID: 1.3.6.1.4.1.7779.3.1.1.3.1.3.2.0] | |
| ib.ddns.update.rejects | Rejected DDNS Updates | psec | Provides number of dynamic DNS update rejects per second may be due to permission failure.[OID: 1.3.6.1.4.1.7779.3.1.1.3.1.3.3.0] | |
| ib.ddns.update.prerequisite.rejects | Prerequisite Failed DDNS Rejected Updates | psec | Provides number of dynamic DNS update rejects per second due to prerequisite failure.[OID: 1.3.6.1.4.1.7779.3.1.1.3.1.3.4.0] | |
| ib.dhcp.requests.received | Received DHCP Requests | psec | Provides number of dhcp requests received per second.[OID: 1.3.6.1.4.1.7779.3.1.1.4.1.3.2.0] | |
| ib.dhcp.offers.sent | DHCP Offers Sent | psec | Provides number of dhcp offers sent per second.[OID: 1.3.6.1.4.1.7779.3.1.1.4.1.3.4.0] | |
| ib.dhcp.releases.received | Received DHCP Releases | psec | Provides number of dhcp releases received per second.[OID: 1.3.6.1.4.1.7779.3.1.1.4.1.3.3.0] | |
| ib.dhcp.acks.sent | DHCP Acks Sent | psec | Provides number of DHCP acknowledgements sent per second.[OID: 1.3.6.1.4.1.7779.3.1.1.4.1.3.5.0] | |
| ib.dhcp.nacks.sent | DHCP Nacks Sent | psec | Provides number of DHCP negative acknowledgements sent per second.[OID: 1.3.6.1.4.1.7779.3.1.1.4.1.3.6.0] | |
| ib.dhcp.declines.received | Received DHCP Declines | psec | Provides number of DHCP declines received per second.[OID: 1.3.6.1.4.1.7779.3.1.1.4.1.3.7.0] | |
| ib.dhcp.discovers.received | Received DHCP Discovery Messages | psec | Monitors the number of discovery messages received per second.[OID: 1.3.6.1.4.1.7779.3.1.1.4.1.3.1] | |
| ib.dhcp.informs.received | Received DHCP Informs | psec | Monitors the number of informs received per second.[OID: 1.3.6.1.4.1.7779.3.1.1.4.1.3.8] | |
| ib.dhcp.others.received | Other DHCP Messages | psec | Monitors the number of other messages received per second.[OID: 1.3.6.1.4.1.7779.3.1.1.4.1.3.9] | |
| ib.dns.hitratio | DNS Hit Ratio | Monitors the dns hit ratio.[OID: 1.3.6.1.4.1.7779.3.1.1.3.1.5] | ||
| Infoblox DHCP Subnet Usage | ib.dhcp.subnet.usage | DHCP Subnet Used Percentage | % | Provides percentage of dynamic DHCP address for subnet leased out at this time. Fixed addresses are always counted as leased for this calculation if the fixed addresses are within ranges of leases.[OIDs: 1.3.6.1.4.1.7779.3.1.1.4.1.1.1.1,1.3.6.1.4.1.7779.3.1.1.4.1.1.1.2,1.3.6.1.4.1.7779.3.1.1.4.1.1.1.3] |
| Infoblox Physical Node1 Temperature | ib.node1.temperature | Infoblox Node1 Temperature | C | Monitors the Infoblox Node1 temperature.[OID: 1.3.6.1.4.1.7779.3.1.1.2.1.10.1.1,1.3.6.1.4.1.7779.3.1.1.2.1.10.1.3] |
| Infoblox Physical Node2 Temperature | ib.node2.temperature | Infoblox Node2 Temperature | C | Monitors the Infoblox Node2 temperatures.[OID: 1.3.6.1.4.1.7779.3.1.1.2.1.11.1.1,1.3.6.1.4.1.7779.3.1.1.2.1.11.1.3] |
| Infoblox Replication Status | ib.node.replication.status | Node Replication Status | Provides the current status of replication between Infoblox appliances (if Primary and Secondary are configured). Does not make sense on a standalone Infoblox appliance. Replication status can only be checked if this appliance is "Active" in the grid.[OIDs: 1.3.6.1.4.1.7779.3.1.1.2.1.2.1.1,1.3.6.1.4.1.7779.3.1.1.2.1.2.1.2,1.3.6.1.4.1.7779.3.1.1.2.1.13,1.3.6.1.4.1.7779.3.1.1.2.1.2.1.4] | |
| ib.node.queuesize.frommaster | Sent Queue Size From Master | Monitors the sent queue size from master.[OID: 1.3.6.1.4.1.7779.3.1.1.2.1.2.1.3] | ||
| ib.node.queuesize.tomaster | Receive Queue Size To Master | Monitors the receive queue size to master.[OID: 1.3.6.1.4.1.7779.3.1.1.2.1.2.1.5] | ||
| Infoblox Services Status | ib.service.status | Infoblox Service Status | Monitors Infoblox services status. Possible status values are working(1),warning(2),failed(3),inactive(4),unknown(5).[OIDs: 1.3.6.1.4.1.7779.3.1.1.2.1.9.1.1,1.3.6.1.4.1.7779.3.1.1.2.1.9.1.2,1.3.6.1.4.1.7779.3.1.1.2.1.9.1.3] | |
| ib.service.name | Infoblox Service Name | Gives the names for infoblox services. Possible service names are dhcp(1),dns(2),ntp(3),radius(4),tftp(5),http-file-dist(6),ftp(7),bloxtools-move(8),bloxtools(9),node-status(10),disk-usage(11),enet-lan(12),enet-lan2(13),enet-ha(14),enet-mgmt(15),lcd(16),memory(17),replication(18),db-object(19),raid-summary(20),raid-disk1(21),raid-disk2(22),raid-disk3(23),raid-disk4(24),fan1(25),fan2(26),fan3(27),power-supply(28),ntp-sync(29),cpu1-temp(30),cpu2-temp(31),sys-temp(32),raid-battery(33),cpu-usage(34),ospf(35),bgp(36).[OID: 1.3.6.1.4.1.7779.3.1.1.2.1.9.1.1] |
Infortrend SAN
Description
Template to monitor Infortrend SAN parameters like Total Cache Blocks,Dirty Cache Blocks,Current Sensor reading,Fan Status,Fan RPM,HDD Status,HDD Reads,HDD Writes,Failed Drive Count,Online Drive Count,Reads,Status,Writes,Redundant Controller Status,Temperature,Voltage Sensor Value. Validated on Infortrend ES S12F-G1842 sysObjectID : 1.3.6.1.4.1.1714.1.1
Prerequisites
No prerequisite
Supported Metric
| Monitor Name | Metric Name | Metric Display Name | Unit | Description |
|---|---|---|---|---|
| Infortrend - Cache Blocks | infortrend.cache.blocks.dirty | Dirty Cache Blocks | count | It monitors the number of dirty cache blocks.[IFT-SNMP-MIB::cacheDirty:1.3.6.1.4.1.1714.1.1.1.2.4.0]. |
| infortrend.cache.blocks.total | Total Cache Blocks | count | It monitors the total number of cache blocks.[IFT-SNMP-MIB::cacheTotal:1.3.6.1.4.1.1714.1.1.1.2.3.0]. | |
| Infortrend - Current Sensor | infortrend.current.sensor.reading | Current | mA | It monitors the infortrend current in Milliamps.[IFT-SNMP-MIB::luDevValue:1.3.6.1.4.1.1714.1.1.9.1.9,luDevValueUnit:1.3.6.1.4.1.1714.1.1.9.1.10]. |
| Infortrend - Fan | infortrend.fan.status | Fan Status | It monitors the fan status. Possible values are 0:Normal,1:Lowest speed,2:Second lowest speed,3:Third lowest speed,4:Intermediate speed,5:Third highest speed,6:Second highest speed,7: Highest speed.[IFT-SNMP-MIB::luDevValue:1.3.6.1.4.1.1714.1.1.9.1.9,luDevValueUnit:1.3.6.1.4.1.1714.1.1.9.1.10]. | |
| infortrend.fan.rpm | Fan RPM | rpm | It monitors the fan RPM.[IFT-SNMP-MIB::luDevValue:1.3.6.1.4.1.1714.1.1.9.1.9,luDevValueUnit:1.3.6.1.4.1.1714.1.1.9.1.10]. | |
| Infortrend - Hard Disk Drive | infortrend.hdd.status | HDD Status | It monitors the hard disk drive status.Possible values are 0 : New Drive,1 : On-Line Drive,2 : Used Drive,3 : Spare Drive,4 : Drive Initialization in Progress,5 : Drive Rebuild in Progress,6 : Add Drive to Logical Drive in Progress,9 : Global Spare Drive,17 : Drive is in process of Cloning another Drive,18 : Drive is a valid Clone of another Drive,19 : Drive is in process of Copying from another Drive(for Copy/Replace LD Expansion function),63 : Drive Absent,252 : Missing Global Spare Drive,253 : Missing Spare Drive,254 : Missing Drive,255 : Failed Drive.[IFT-SNMP-MIB::hddStatus:1.3.6.1.4.1.1714.1.1.6.1.11]. | |
| infortrend.hdd.reads | HDD Reads | MBps | It monitors the drive read statistic in MB/S.[IFT-SNMP-MIB::hddReadStatistic:1.3.6.1.4.1.1714.1.1.6.1.18]. | |
| infortrend.hdd.writes | HDD Writes | MBps | It monitors the drive write statistic in MB/S.[IFT-SNMP-MIB::hddWriteStatistic:1.3.6.1.4.1.1714.1.1.6.1.19]. | |
| Infortrend - Logical Drive | infortrend.logical.drive.writes | Logical Drive Writes | MBps | It monitors the logical drive write statistic in MB/S.[IFT-SNMP-MIB::ldWriteStatistic:1.3.6.1.4.1.1714.1.1.2.1.13]. |
| infortrend.logical.drive.online.hard.drive.count | Logical Drive Online Hard Drive Count | count | It monitors the on-line hard drive count on logical drive.[IFT-SNMP-MIB::ldOnlineDrvCnt:1.3.6.1.4.1.1714.1.1.2.1.9]. | |
| infortrend.logical.drive.status | Logical Drive Status | It monitors the logical drive status. Possible values are 0 : Good,1 : Rebuilding,2 : Initializing,3 : Degraded,4 : Dead,5 : Invalid,6 : Incomplete,7 : Drive Missing.[IFT-SNMP-MIB::ldStatus:1.3.6.1.4.1.1714.1.1.2.1.6]. | ||
| infortrend.logical.drive.failed.hard.drive.count | Logical Drive Failed Hard Drive Count | count | It monitors the failed hard drive count on logical drive.[IFT-SNMP-MIB::ldFailedDrvCnt:1.3.6.1.4.1.1714.1.1.2.1.11]. | |
| infortrend.logical.drive.reads | Logical Drive Reads | MBps | It monitors the logical drive read statistic in MB/S.[IFT-SNMP-MIB::ldReadStatistic:1.3.6.1.4.1.1714.1.1.2.1.12]. | |
| Infortrend - Redundant Controller Status | infortrend.redundant.controller.status | Redundant Controller Status | It monitors the redundant controller status. Possible values are 0 - Inactive,1 - Scanning,17 - Detected,18 - Enabled,63 - Controller Failed.[IFT-SNMP-MIB::redCtlrStatus:1.3.6.1.4.1.1714.1.1.1.6.4.0]. | |
| Infortrend - Temperature | infortrend.temperature.sensor.reading | Temperature | Celsius | It monitors the temperature in Degreed C.[IFT-SNMP-MIB::luDevValue:1.3.6.1.4.1.1714.1.1.9.1.9,luDevValueUnit:1.3.6.1.4.1.1714.1.1.9.1.10]. |
| Infortrend - Voltage Sensor | infortrend.voltage.sensor.reading | Voltage | mV | It monitors the Infortrend voltage sensor reading in Millivolt.[IFT-SNMP-MIB::luDevValue:1.3.6.1.4.1.1714.1.1.9.1.9,luDevValueUnit:1.3.6.1.4.1.1714.1.1.9.1.10]. |
Interface Group Status
Description
Monitors the interface operational status. This monitor is applicable only when you want a consolidated alert if more than 1 interface goes down.[OIDs: 1.3.6.1.2.1.2.2.1.2,1.3.6.1.2.1.31.1.1.1.1 and 1.3.6.1.2.1.2.2.1.8]
Prerequisites
No prerequisite
Supported Metric
| Monitor Name | Metric Name | Metric Display Name | Unit | Description |
|---|---|---|---|---|
| Interface Group Status | network.interface.up.count | Interfaces Up Count | Monitors the interface operational status. This monitor is applicable only when you want a consolidated alert if more than 1 interface goes down.[OIDs: 1.3.6.1.2.1.2.2.1.2,1.3.6.1.2.1.31.1.1.1.1 and 1.3.6.1.2.1.2.2.1.8] |
Interface Operational Status
Description
Monitors the Interface Status only when interface admin status is Up.
Prerequisites
No prerequisite
Supported Metric
| Monitor Name | Metric Name | Metric Display Name | Unit | Description |
|---|---|---|---|---|
| SNMP Interface - 32-bit Counter | network.interface.status | Interface Status | This metric represents the status of the interface based on the values derived from ifAdminStatus and ifOperStatus. It generates alerts if interface operational status is not in Up or Dormant state even interface admin status is Up.[OID: ifOperStatus-1.3.6.1.2.1.2.2.1.8; ifAdminStatus-1.3.6.1.2.1.2.2.1.7] |
ISIS Adjacency State
Description
Template to monitor the adjacent state of Intermediate System.[ISIS-MIB::isisISAdjState::1.3.6.1.3.37.1.5.1.1.2,isisISAdjIPAddressType : 1.3.6.1.3.37.1.5.3.1.2,isisISAdjIPAddress : 1.3.6.1.3.37.1.5.3.1.3]
Prerequisites
No prerequisite
Supported Metric
| Monitor Name | Metric Name | Metric Display Name | Unit | Description |
|---|---|---|---|---|
| ISIS Adjacent State | isis_adj_state | ISIS IS Adjacent State | It monitors the adjacent state of an intermediate system. |
Ivanti Pulse Secure Performance Statistics
Description
Monitors the Pulse Secure Performance statistics like CPU,Memory,SWAP and Disk utilization and user statistics like Signed In Web Users,Ive Concurrent Users,Cluster Concurrent Users,log file full percentage and the blade temperature.[PULSESECURE-PSG-MIB :: iveCpuUtil : 1.3.6.1.4.1.12532.10.0,iveMemoryUtil : 1.3.6.1.4.1.12532.11.0,iveSwapUtil : 1.3.6.1.4.1.12532.24.0,diskFullPercent : 1.3.6.1.4.1.12532.25.0,signedInWebUsers : 1.3.6.1.4.1.12532.2.0,iveConcurrentUsers : 1.3.6.1.4.1.12532.12.0,clusterConcurrentUsers : 1.3.6.1.4.1.12532.13.0,logFullPercent : 1.3.6.1.4.1.12532.1.0,iveTemperature : 1.3.6.1.4.1.12532.42.0]
Prerequisites
No prerequisite
Supported Metric
| Monitor Name | Metric Name | Metric Display Name | Unit | Description |
|---|---|---|---|---|
| Ivanti Pulse Secure - SSL VPN Appliance Monitor | pulse_secure_LogFullPercent | Pulse Secure Log Full Percentage | % | Monitors the Pulse Secure Log File Full Percentage.[PULSESECURE-PSG-MIB :: logFullPercent : 1.3.6.1.4.1.12532.1.0] |
| pulse_secure_IveTemperature | Pulse Secure Ive Temperature | C | Monitors the Pulse Secure Ive Temperature.[PULSESECURE-PSG-MIB :: iveTemperature : 1.3.6.1.4.1.12532.42.0] | |
| Ivanti Pulse Secure - System Performance | pulse_secure_DiskFullPercent | Pulse Secure Disk Full Percentage | % | Monitors the Pulse Secure Disk Full Percentage.[PULSESECURE-PSG-MIB :: diskFullPercent : 1.3.6.1.4.1.12532.25.0] |
| pulse_secure_IveMemoryUtil | Pulse Secure Ive Memory Utilization | % | Monitors the Pulse Secure Memory Utilization.[PULSESECURE-PSG-MIB :: iveMemoryUtil : 1.3.6.1.4.1.12532.11.0] | |
| pulse_secure_IveCpuUtil | Pulse Secure Ive Cpu Utilization | % | Monitors the Pulse Secure CPU Utilization.[PULSESECURE-PSG-MIB :: iveCpuUtil : 1.3.6.1.4.1.12532.10.0] | |
| pulse_secure_IveSwapUtil | Pulse Secure Ive Swap Utilization | % | Monitors the Pulse Secure Swap Utilization.[PULSESECURE-PSG-MIB :: iveSwapUtil : 1.3.6.1.4.1.12532.24.0] | |
| Ivanti Pulse Secure - User Statistics | pulse_secure_SignedInWebUsers | Pulse Secure Signed In Web Users | Monitors the Pulse Secure Signed In Web Users.[PULSESECURE-PSG-MIB :: signedInWebUsers : 1.3.6.1.4.1.12532.2.0] | |
| pulse_secure_ClusterConcurrentUsers | Pulse Secure Cluster Concurrent Users | Monitors the Pulse Secure Cluster Concurrent Users.[PULSESECURE-PSG-MIB :: clusterConcurrentUsers : 1.3.6.1.4.1.12532.13.0] | ||
| pulse_secure_IveConcurrentUsers | Pulse Secure Ive Concurrent Users | Monitors the Pulse Secure Ive Concurrent Users.[PULSESECURE-PSG-MIB :: iveConcurrentUsers : 1.3.6.1.4.1.12532.12.0] |
Jetty Jvm Template
Description
Jetty Jvm Template
Prerequisites
No prerequisite
Supported Metric
| Monitor Name | Metric Name | Metric Display Name | Unit | Description |
|---|---|---|---|---|
| Jetty Jvm Monitor | jetty.jvm.thread.count | Jetty Jvm Thread Count | count | Displays the number of active threads in the system. |
| jetty.jvm.thread.peakcount | Jetty Jvm Thread Peak Count | count | Peak number of threads running in the JVM since it started. | |
| jetty.jvm.totalstartedthread.count | Jetty Jvm TotalStarted Thread Count | count | Displays the number of threads marked as daemons in the system. | |
| jetty.jvm.non_heap_memory_committed | Jetty Jvm Committed Non Heap Memory | Bytes | The total Java non-heap memory committed to be used. | |
| jetty.jvm.non_heap_memory_init | Jetty Jvm Non Heap Memory Init | Bytes | The initial Java non-heap memory allocated. | |
| jetty.jvm.non_heap_memory_used | Jetty Jvm Used Non Heap Memory | Bytes | The total Java non-heap memory used. | |
| jetty.jvm.non_heap_memory_max | Jetty Jvm Max Non Heap Memory | Bytes | The maximum Java non-heap memory available. | |
| jetty.jvm.memorypool.edenspace.peak_usage_used | Jetty Jvm Memory Pool Edenspace Peak Usage Used | KB | Displays the peak usage of edenspace in kilo bytes | |
| jetty.jvm.memorypool.metaspace.peak_usage_init | Jetty Jvm Memory Pool Metaspace Peak Usage Init | KB | Displays the initial peak usage of metaspace in kilo bytes | |
| jetty.jvm.memorypool.metaspace.peak_usage_used | Jetty Jvm Memory Pool Metaspace Peak Usage Used | KB | Displays the peak usage of metaspace in kilo bytes | |
| jetty.jvm.memorypool.metaspace.peak_usage_max | Jetty Jvm Memorypool MetaSpace Peak Usage Max | KB | Displays the maximum peak usage of metaspace in kilo bytes | |
| jetty.jvm.memorypool.metaspace.peak_usage_committed | Jetty Jvm Memory Pool MetaSpace Peak Usage Committed | KB | The total metaspace memory committed to be used | |
| jetty.jvm.memorypool.survivorspace.peak_usage_used | Jetty Jvm Memory Pool Survivorspace Peak Usage Used | KB | Displays the peak usage of survivorspace in kilo bytes | |
| jetty.jvm.memorypool.survivorspace.peak_usage_init | Jetty Jvm Memory Pool Survivorspace Peak Usage Init | KB | Displays the initial peak usage max of survivorspace in kilo bytes | |
| jetty.jvm.memorypool.survivorspace.peak_usage_max | Jetty Jvm Memory Pool SurvivorsSpace Peak Usage Max | KB | Displays the peak maximum usage of survivorspace in kilo bytes | |
| jetty.jvm.memorypool.survivorspace.peak_usage_committed | Jetty Jvm Memory Pool Survivor Space Peak Usage Committed | KB | The total survivorspace memory committed to be used | |
| jetty.jvm.memorypool.tenuredgen.peak_usage | Jetty Jvm Memory Pool Tenuredgen Peak Usage | KB | Displays the peak usage of tenuredgen in kilo bytes | |
| jetty.jvm.memorypool.tenuredgen.peak_usage.init | Jetty Jvm Memory Pool Tenuredgen Peak Usage Init | KB | Displays the initial peak usage max of tenuredgen in kilo bytes | |
| jetty.jvm.memorypool.tenuredgen.peak_usage.max | KB | Displays the peak maximum usage of tenuredgen in kilo bytes | ||
| jetty.jvm.memorypool.tenuredgen.peak_usage_committed | Jetty Jvm Memory Pool Tenuredgen Peak Usage Committed | KB | The total tenuredgen memory committed to be used | |
| jetty.jvm.daemonthread.count | Jetty Jvm DeamonThread Count | count | Displays the number of threads marked as daemons in the system. | |
| jetty.jvm.heap_memory_used | Jetty Jvm Used Heap Memory | Bytes | The total Java heap memory used. | |
| jetty.jvm.heap_memory_committed | Jetty Jvm Committed Heap Memory | Bytes | The total Java heap memory committed to be used. | |
| jetty.jvm.heap_memory_init | Jetty Jvm Heap Memory Init | Bytes | The initial Java heap memory allocated. | |
| jetty.jvm.heap_memory_max | Jetty Jvm Max Heap Memory | Bytes | The maximum Java heap memory available. | |
| jetty.jvm.memorypool.codecache.peak_usage_used | Jetty Jvm Memorypool Codecache peak Usage Used | KB | Displays the peak usage of code cache in kilo bytes | |
| jetty.jvm.memorypool.codecache.peak_usage_init | Jetty Jvm Memorypool Codecache Peak Usage Init | KB | Displays the initial peak usage max of code cache in kilo bytes | |
| jetty.jvm.memorypool.codecache.peak_usage_committed | Jetty Jvm Memorypool Codecache Peak Usage Committed | KB | The total codecache memory committed to be used | |
| jetty.jvm.memorypool.edenspace.peak_usage_max | Jetty Jvm Memory Pool Edenspace peak Usage Max | KB | Displays the maximum peak usage max of edenspace in kilo bytes | |
| jetty.jvm.memorypool.edenspace.peak_usage_init | Jetty Jvm Memory Pool EdenSpace Peak Usage Init | KB | Displays the initial peak usage of edenspace in kilo bytes | |
| jetty.jvm.memorypool.edenspace.peak_usage_committed | Jetty Jvm Memory Pool Edenspace Peak usage Committed | KB | The total edenspace memory committed to be used. | |
| jetty.jvm.gc.collection.count | Jetty Jvm Gc Collection Count | count | The number of garbage collections that have ocurred. | |
| jetty.jvm.gc.thread.count | Jetty Jvm Gc Thread Count | count | The total number of garbage collections that have occurred. | |
| jetty.jvm.memorypool.codecache.peak_usage_maximum | Jetty Jvm Max Memory Pool CodeCache Peak Usage | KB | Displays the maximum peak usage of code cache in kilo bytes |
Jetty Template
Description
Jetty Template
Prerequisites
No prerequisite
Supported Metric
| Monitor Name | Metric Name | Metric Display Name | Unit | Description |
|---|---|---|---|---|
| Jetty Monitor | jetty.sessionhandler.sessions.created | Jetty Sessionhandler Sessions Created | count | Number of sessions created by this node |
| jetty.defaultsessioncache.sessionscurrent | Jetty Defaultsessioncache Sessionscurrent | count | The DefaultSessionCache holds sessions in memory..current sessions in cache | |
| jetty.threadpool.minthreads | Jetty ThreadPool Min Threads | count | minimum number of threads in the pool | |
| jetty.sessionhandler.sessiontime.max | Jetty Sessionhandler Sessiontime Max | s | SessionHandler cleans up expired sessions...maximum amount of time sessions have remained active (in s) | |
| jetty.threadpool.threads | Jetty ThreadPool Threads | count | Number of threads in the pool | |
| jetty.threadpool.lowonthreads | Jetty ThreadPool Lowonthreads | NULL | Thread pool is low on threads | |
| jetty.threadpool.stoptimeout | Jetty ThreadPool Stoptimeout | ms | The stop timeout in milliseconds | |
| jetty.defaultsessioncache.sessionstotal | Jetty Defaultsessioncache Sessionstotal | count | Total sessions in cache | |
| jetty.threadpool.busythreads | Jetty ThreadPool Busythreads | count | Number of busy threads in the pool | |
| jetty.threadpool.idlethreads | Jetty ThreadPool Idlethreads | count | Number of idle threads in the pool | |
| jetty.threadpool.reservedthreads | Jetty ThreadPool Reserved Threads | count | The number of reserved threads in the pool | |
| jetty.sessionhandler.sessionstimecstddev | Jetty Sessionhandler Sessiontimecstddev | s | Standard deviation a session remained valid (in s) | |
| jetty.threadpool.lowthreadsthreshold | Jetty ThreadPool Lowthreadsthreshold | count | Threshold at which the pool is low on threads | |
| jetty.sessionhandler.sessionstime.mean | Jetty Sessionhandler Sessiontime Mean | s | Mean time sessions remain valid (in s) | |
| jetty.threadpool.queuesize | Jetty ThreadPool Queuesize | count | Number of jobs queued waiting for a thread | |
| jetty.defaultsessioncache.sessionsmax | Jetty Defaultsessioncache Sessionsmax | count | Max sessions in cache | |
| jetty.threadpool.detaileddump | Jetty ThreadPool Detaileddump | NULL | Reports additional details in the dump | |
| jetty.threadpool.maxthreads | Jetty ThreadPool Max Threads | count | Maximum number of threads in the pool | |
| jetty.sessionhandler.sessiontime.total | Jetty Sessionhandler Sessiontime Total | s | Total time sessions have remained valid | |
| jetty.threadpool.daemon | Jetty ThreadPool Daemon | NULL | Thread pool uses daemon threads |
JIRA JVM MonitorTemplate
Description
JIRA Jvm Template
Prerequisites
No prerequisite
Supported Metric
| Monitor Name | Metric Name | Metric Display Name | Unit | Description |
|---|---|---|---|---|
| JIRA JVM Monitor | jira.jvm.thread.count | JIRA JVM Thread Count | count | Displays the number of active threads in the system. |
| jira.jvm.thread.peakcount | JIRA JVM Thread PeakCount | count | Peak number of threads running in the JVM since it started. | |
| jira.jvm.totalstartedthread.count | JIRA JVM TotalStarted Thread Count | count | Displays the number of threads marked as daemons in the system. | |
| jira.jvm.non_heap_memory_committed | JIRA JVM Non Heap Memory Committed | Bytes | The total Java non-heap memory committed to be used. | |
| jira.jvm.non_heap_memory_init | JIRA JVM Non Heap Memory init | Bytes | The initial Java non-heap memory allocated. | |
| jira.jvm.non_heap_memory_used | JIRA JVM Non Heap Memory Used | Bytes | The total Java non-heap memory used. | |
| jira.jvm.non_heap_memory_max | JIRA JVM Max Non Heap Memory | Bytes | The maximum Java non-heap memory available. | |
| jira.jvm.memorypool.edenspace.peak_usage_used | JIRA JVM Memory EdenSpace Usage Used | KB | Displays the peak usage of edenspace in kilo bytes | |
| jira.jvm.memorypool.metaspace.peak_usage_init | JIRA JVM Memory Metaspace Peak Usuage Init | KB | Displays the initial peak usage of metaspace in kilo bytes | |
| jira.jvm.memorypool.metaspace.peak_usage_used | JIRA JVM Memory Metasoace Peak Usuage Used | KB | Displays the peak usage of metaspace in kilo bytes. | |
| jira.jvm.memorypool.metaspace.peak_usage_max | JIRA JVM Memory Metaspace Peak Usauge Max | KB | Displays the maximum peak usage of metaspace in kilo bytes. | |
| jira.jvm.memorypool.metaspace.peak_usage_committed | JIRA JVM Memorypool Metaspace Peak Usage Committed | KB | The total metaspace memory committed to be used. | |
| jira.jvm.memorypool.survivorspace.peak_usage_used | JIRA JVM Memorypool Survivorspace Peak Usage Used | KB | Displays the peak usage of survivorspace in kilo bytes. | |
| jira.jvm.memorypool.survivorspace.peak_usage_init | JIRA JVM Memorypool Survivorspace Peak Usage Init | KB | Displays the initial peak usage max of survivorspace in kilo bytes. | |
| jira.jvm.memorypool.survivorspace.peak_usage_max | JIRA JVM Memorypool Survivorspace Peak Usage Max | KB | Displays the peak maximum usage of survivorspace in kilo bytes. | |
| jira.jvm.memorypool.survivorspace.peak_usage_committed | JIRA JVM Memory Survivorspace Peak Usage Commit | KB | The total survivorspace memory committed to be used. | |
| jira.jvm.memorypool.tenuredgen.peak_usage | JIRA JVM Memorypool Tenuredgen Peak Usage | KB | Displays the peak usage of tenuredgen in kilo bytes. | |
| jira.jvm.memorypool.tenuredgen.peak_usage.init | JIRA JVM Memorypool Tenuredgen Peak Usage Init | KB | Displays the initial peak usage max of tenuredgen in kilo bytes. | |
| jira.jvm.memorypool.tenuredgen.peak_usage.max | JIRA JVM Memorypool Max Tenuredgen Peak Usage | KB | Displays the peak maximum usage of tenuredgen in kilo bytes. | |
| jira.jvm.memorypool.tenuredgen.peak_usage_committed | JIRA JVM Memorypool Committed Tenuredgen Peak Usage | KB | The total tenuredgen memory committed to be used. | |
| jira.jvm.daemonthread.count | JIRA JVM DeamonThread Count | count | Displays the number of threads marked as daemons in the system. | |
| jira.jvm.heap_memory_used | JIRA JVM Heap Memory Used | Bytes | The total Java heap memory used. | |
| jira.jvm.heap_memory_committed | JIRA JVM Heap Memory Committed | Bytes | The total Java heap memory committed to be used. | |
| jira.jvm.heap_memory_init | JIRA JVM Heap Memory Init | Bytes | The initial Java heap memory allocated. | |
| jira.jvm.heap_memory_max | JIRA JVM Max Heap Memory | Bytes | The maximum Java heap memory available. | |
| jira.jvm.memorypool.codecache.peak_usage_used | JIRA JVM MemoryPool Codecache Peak Used | KB | Displays the peak usage of code cache in kilo bytes. | |
| jira.jvm.memorypool.codecache.peak_usage_init | JIRA JVM MemoryPool Codecache Usuage Init | KB | Displays the initial peak usage max of code cache in kilo bytes. | |
| jira.jvm.memorypool.codecache.peak_usage_max | JIRA JVM MemoryPool Codecache Usuage Max | KB< /td> | Displays the maximum peak usage of code cache in kilo bytes. | |
| jira.jvm.memorypool.codecache.peak_usage_committed | JIRA JVM MemoryPool Codecache Usuage Committed | KB | The total codecache memory committed to be used. | |
| jira.jvm.memorypool.edenspace.peak_usage_max | JIRA JVM Memory EdenSpacePeak Max Usage | KB | Displays the maximum peak usage max of edenspace in kilo bytes. | |
| jira.jvm.memorypool.edenspace.peak_usage_init | JIRA JVM MemoryPool EdenSpace Peak Usuage Init | KB | Displays the initial peak usage of edenspace in kilo bytes. | |
| jira.jvm.memorypool.edenspace.peak_usage_committed | JIRA JVM Memory Pool EdenSpace Peak Usuage Committed | KB | The total edenspace memory committed to be used. | |
| jira.jvm.gc.collection.count | JIRA JVM Collection Count | count | The number of garbage collections that have ocurred. | |
| jira.jvm.gc.thread.count | JIRA JVM Thread Count | count | The total number of garbage collections that have occurred. |
JIRA JVM Template
Description
JIRA JVM Template
Prerequisites
No prerequisite
Supported Metric
| Monitor Name | Metric Name | Metric Display Name | Unit | Description |
|---|---|---|---|---|
| JIRA JVM Monitor | jira.jvm.thread.count | JIRA JVM Thread Count | count | Displays the number of active threads in the system. |
| jira.jvm.thread.peakcount | JIRA JVM Thread PeakCount | count | Peak number of threads running in the JVM since it started. | |
| jira.jvm.totalstartedthread.count | JIRA JVM TotalStarted Thread Count | count | Displays the number of threads marked as daemons in the system. | |
| jira.jvm.non_heap_memory_committed | JIRA JVM Non Heap Memory Committed | Bytes | The total Java non-heap memory committed to be used. | |
| jira.jvm.non_heap_memory_init | JIRA JVM Non Heap Memory init | Bytes | The initial Java non-heap memory allocated. | |
| jira.jvm.non_heap_memory_used | JIRA JVM Non Heap Memory Used | Bytes | The total Java non-heap memory used. | |
| jira.jvm.non_heap_memory_max | JIRA JVM Max Non Heap Memory | Bytes | The maximum Java non-heap memory available. | |
| jira.jvm.memorypool.edenspace.peak_usage_used | JIRA JVM Memory EdenSpace Usage Used | KB | Displays the peak usage of edenspace in kilo bytes | |
| jira.jvm.memorypool.metaspace.peak_usage_init | JIRA JVM Memory Metaspace Peak Usuage Init | KB | Displays the initial peak usage of metaspace in kilo bytes | |
| jira.jvm.memorypool.metaspace.peak_usage_used | JIRA JVM Memory Metasoace Peak Usuage Used | KB | Displays the peak usage of metaspace in kilo bytes | |
| jira.jvm.memorypool.metaspace.peak_usage_max | JIRA JVM Memory Metaspace Peak Usauge Max | KB | Displays the maximum peak usage of metaspace in kilo bytes | |
| jira.jvm.memorypool.metaspace.peak_usage_committed | JIRA JVM Memorypool Metaspace Peak Usage Committed | KB | The total metaspace memory committed to be used | |
| jira.jvm.memorypool.survivorspace.peak_usage_used | JIRA JVM Memorypool Survivorspace Peak Usage Used | KB | Displays the peak usage of survivorspace in kilo bytes | |
| jira.jvm.memorypool.survivorspace.peak_usage_init | JIRA JVM Memorypool Survivorspace Peak Usage Init | KB | Displays the initial peak usage max of survivorspace in kilo bytes | |
| jira.jvm.memorypool.survivorspace.peak_usage_max | JIRA JVM Memorypool Survivorspace Peak Usage Max | KB | Displays the peak maximum usage of survivorspace in kilo bytes | |
| jira.jvm.memorypool.survivorspace.peak_usage_committed | JIRA JVM Memory Survivorspace Peak Usage Commit | KB | The total survivorspace memory committed to be used | |
| jira.jvm.memorypool.tenuredgen.peak_usage | JIRA JVM Memorypool Tenuredgen Peak Usage | KB | Displays the peak usage of tenuredgen in kilo bytes | |
| jira.jvm.memorypool.tenuredgen.peak_usage.init | JIRA JVM Memorypool Tenuredgen Peak Usage Init | KB | Displays the initial peak usage max of tenuredgen in kilo bytes | |
| jira.jvm.memorypool.tenuredgen.peak_usage.max | JIRA JVM Memorypool Max Tenuredgen Peak Usage | KB | Displays the peak maximum usage of tenuredgen in kilo bytes | |
| jira.jvm.memorypool.tenuredgen.peak_usage_committed | JIRA JVM Memorypool Committed Tenuredgen Peak Usage | KB | The total tenuredgen memory committed to be used |
JIRA Template
Description
JIRA Template
Prerequisites
No prerequisite
Supported Metric
| Monitor Name | Metric Name | Metric Display Name | Unit | Description |
|---|---|---|---|---|
| JIRA Monitor | jira.quicksearch.concurrent.search | Jira QuickSearch Concurrent Search | count | QuickSearch Concurrent Search |
| jira.web.requests.invocation.count | Jira Web Requests Invocation Count | count | Web Requests | |
| jira.web.requests.total.elapsed.time | Jira Web Requests Total Elapsed Time | ms | Web Requests Total Elapsed Time | |
| jira.issue.search.count | Jira Issue Search Count | count | Issue Search Count | |
| jira.issue.updated.count | Jira Issue Updated Count | count | Issue Updated Count | |
| jira.issue.worklogged.count | Jira Issue WorkLogged Count | count | Issue WorkLogged Count | |
| jira.dashboard.view.count | JIRA Dashboard View Count | count | Dashboard View Count | |
| jira.db.conns.invocation.count | Jira DB Conns Invocation Count | count | DB Conns Invocation Count | |
| jira.db.conns.total.elapsed.time | Jira DB Conns Total Elapsed Time | ms | DB Conns Total Elapsed Time | |
| jira.db.conns.borrowed | Jira DB Conns Borrowed | count | DB Conns Borrowed | |
| jira.db.conns.time.to.borrow | Jira DB Conns Time To Borrow | ms | DB Conns Time To Borrow | |
| jira.db.reads.invocation.count | Jira DB Reads Invocation Count | count | DB Reads Invocation Count | |
| jira.db.reads.total.elapsed.time | Jira DB Reads Total Elapsed Time | ms | DB Reads Total Elapsed Time | |
| jira.db.writes.invocation.count | Jira DB Writes Invocation Count | count | DB Writes Invocation Count | |
| jira.db.writes.total.elapsed.time | Jira DB Writes Total Elapsed Time | ms | DB Writes Total Elapsed Time | |
| jira.entity.attachments.total | Jira Entity Attachments Total | count | Entity Attachments Total | |
| jira.entity.components.total | Jira Entity Components Total | count | Entity Components Total | |
| jira.entity.customfields.total | Jira Entity CustomFields Total | count | Entity CustomFields Total | |
| jira.entity.filters.total | Jira Entity Filters Total | count | Entity Filters Total | |
| jira.entity.groups.total | Jira Entity Groups Total | count | Entity Groups Total | |
| jira.entity.issues.total | Jira Entity Issues Total | count | Entity Issues Total | |
| jira.entity.users.total | Jira Entity Users Total | count | Entity Users Total | |
| jira.entity.versions.total | Jira Entity Versions Total | count | Entity Versions Total | |
| jira.issue.assigned.count | Jira Issue Assigned Count | count | Issue Assigned Count | |
| jira.issue.created.count | Jira Issue Created Count | count | Issue Created Count | |
| jira.issue.link.count | Jira Issue Link Count | count | Issue Link Count |
JVM Basic Template
Description
JVM-Uptime, JVM.GC.collection_count, JVM.GC.collection_time, JVM.Mem.heap_committed, JVM.Mem.heap_used, JVM.Mem.non_heap_committed, JVM.Mem.non_heap_used, JVM.Threads, JVM.OpenFDs, jvm.sys.load.average
Prerequisites
No prerequisite
Supported Metric
| Monitor Name | Metric Name | Metric Display Name | Unit | Description |
|---|---|---|---|---|
| JMX Basic | jvm.uptime | JVM Uptime in Millisecond | ms | JVM Uptime in Millisecond |
| jvm.gc.collection_count | JVM Garbage Objects Count | Number of garbage objects collected | ||
| jvm.gc.collection_time | JVM Garbage Collection Time | ms | Time taken in Milliseconds for collection of the garbage objects. | |
| jvm.mem.heap_committed | JVM Heap Memory Committed | GB | Heap memory committed (in MB) for the server | |
| jvm.mem.heap_used | JVM Heap Memory Used | GB | Heap memory usage (in MB) of the server | |
| jvm.mem.non_heap_committed | JVM non heap memory committed | GB | Non-heap Memory committed in MB | |
| jvm.mem.non_heap_used | JVM non heap memory used | GB | Non-heap memory usage (in MB) of the server | |
| jvm.threads | JVM Thread Count | Number of threads | ||
| jvm.open.fds | JVM Open File Descriptors Count | Number of Open file descriptors of the server | ||
| jvm.sys.load.average | JVM System Load Average | JVM System Load Average |
JVM Basic Template - v2
Description
JVM-Uptime, JVM.GC.collection_count, JVM.GC.collection_time, JVM.Mem.heap_committed, JVM.Mem.heap_used, JVM.Mem.non_heap_committed, JVM.Mem.non_heap_used,JVM.Threads, JVM.OpenFDs, jvm.sys.load.average
Prerequisites
No prerequisite
Supported Metric
| Monitor Name | Metric Name | Metric Display Name | Unit | Description |
|---|---|---|---|---|
| JVM Basic Template - V2 | jvm.uptime | JVM Uptime in Millisecond | ms | JVM Uptime in Millisecond |
| jvm.gc.collection_count | JVM Garbage Objects Count | Number of garbage objects collected | ||
| jvm.gc.collection_time | JVM Garbage Collection Time | ms | Time taken in Milliseconds for collection of the garbage objects. | |
| jvm.mem.heap_committed | JVM Heap Memory Committed | GB | Heap memory committed (in MB) for the server | |
| jvm.mem.heap_used | JVM Heap Memory Used | GB | Heap memory usage (in MB) of the server | |
| jvm.mem.non_heap_committed | JVM non heap memory committed | GB | Non-heap Memory committed in MB | |
| jvm.mem.non_heap_used | JVM non heap memory used | GB | Non-heap memory usage (in MB) of the server | |
| jvm.threads | JVM Thread Count | Number of threads | ||
| jvm.open.fds | JVM Open File Descriptors Count | Number of Open file descriptors of the server | ||
| jvm.sys.load.average | JVM System Load Average | JVM System Load Average |
Kemp Load Balancer - G2
Description
Applicable on the Kemp Load Balancer. Monitors the HA state, RS statistics, Total RS active connections, RS State, VS State.
Prerequisites
No prerequisite
Supported Metric
| Monitor Name | Metric Name | Metric Display Name | Unit | Description |
|---|---|---|---|---|
| Kemp LB HA State | b100.ha.state | HA State | Monitors the current state of HA on current machine. Possible values are 0- none,1- master, 2- standby, 3- passive. [ OID: 1.3.6.1.4.1.12196.13.0.9.0] | |
| Kemp LB Real Server Total Stats | total.rs.active.connection | Total RS Active Connection | Monitors the number of active connection for this real server. [OIDs: 1.3.6.1.4.1.12196.12.8.1.2, 1.3.6.1.4.1.12196.12.8.1.8] | |
| total.rs.out.bytes | Total RS Out Bytes | Bps | Monitors the total number of outgoing bytes from this real server. [OIDs: 1.3.6.1.4.1.12196.12.8.1.2, 1.3.6.1.4.1.12196.12.8.1.7] | |
| total.rs.in.bytes | Total RS In Bytes | Bps | Monitors the total number of incoming bytes from this real server. [OID: 1.3.6.1.4.1.12196.12.8.1.2, 1.3.6.1.4.1.12196.12.8.1.6] | |
| total.rs.connections | Total RS Connections | psec | Monitors the total number of connections for this real server. [OIDs: 1.3.6.1.4.1.12196.12.8.1.2, 1.3.6.1.4.1.12196.12.8.1.3] | |
| Kemp LB RS Active Connections | rs.active.connections | RS Active Connections | Monitors the number of active connection for this real server. [OIDs: 1.3.6.1.4.1.12196.12.2.1.11, 1.3.6.1.4.1.12196.12.2.1.17] | |
| Kemp LB RS State | b100.rs.state | B100 RS State | Monitors the current state of real server. Possible values are 1- inService, 2- outOfService, 4- disabled. [OIDs: 1.3.6.1.4.1.12196.13.2.1.2, 1.3.6.1.4.1.12196.13.2.1.8] | |
| b100.vs.state | B100 VS State | Monitors the state of virtual server. Possible status values are 1- inService, 2- outOfService, 4- disabled, 5- sorry, 6- redirect, 7- errormsg. [OIDs: 1.3.6.1.4.1.12196.13.1.1.2, 1.3.6.1.4.1.12196.13.1.1.14] |
Korenix Jetnet4508V2 Switch - Port Statistics
Description
Template to monitor Korenix Jetnet4508V2 (sysObjectID : 1.3.6.1.4.1.24062.2.2.17) Switch port statistics like Rx bad packets, Rx abort packets, Tx bad packets, Packet collision.
Prerequisites
No prerequisite
Supported Metric
| Monitor Name | Metric Name | Metric Display Name | Unit | Description |
|---|---|---|---|---|
| Korenix Jetnet4508V2 Switch - Port Statistics | korenix_Jetnet4508V2_PortRxAbortPackets | Port Rx Abort Packets | packet/min | It monitors the count of abort frames when receive, which is the total number of discarded and filtered frames.[Jetnet4508V2.MIB::swPortStatRXAbortPkt:1.3.6.1.4.1.24062.2.2.17.11.2.1.1.7]. |
| korenix_Jetnet4508V2_PortTxBadPackets | Port Tx Bad Packets | packet/min | It monitors the count of FCSErr frames when transmit.[Jetnet4508V2.MIB::swPortStatTXBadPkt:1.3.6.1.4.1.24062.2.2.17.11.2.1.1.9]. | |
| korenix_Jetnet4508V2_PortPacketCollision | Port Packet Collision | packet/min | It monitors the count of collision.[Jetnet4508V2.MIB::swPortStatPacketCollision:1.3.6.1.4.1.24062.2.2.17.11.2.1.1.10]. | |
| korenix_Jetnet4508V2_PortRxBadPackets | Port Rx Bad Packets | packet/min | It monitors the count of bad frames received, which is the total number of undersize, fragment, oversize, jabber, RxErr and FCSErr frames. [Jetnet4508V2.MIB::swPortStatRXBadPkt:1.3.6.1.4.1.24062.2.2.17.11.2.1.1.6]. |
Korenix Jetnet5010G Switch - Hardware Status
Description
Template to monitor Korenix Jetnet5010G (sysObjectID : 1.3.6.1.4.1.24062.2.2.1) Switch hardware status parameters like LED power1 status, power2 status, DI1 status, DI2 status, DO1 status, DO2 status, RM status.
Prerequisites
No prerequisite
Supported Metric
| Monitor Name | Metric Name | Metric Display Name | Unit | Description |
|---|---|---|---|---|
| Korenix Jetnet5010G Switch - Hardware Status | korenix_Jetnet5010G_LedPower1Status | LED Power1 Status | It monitors the status of Power 1 LED. Possible values are on(1), blinkNormal(2), blinkFast(3), off(4). [Jetnet5010G.MIB::ledPower1Status:1.3.6.1.4.1.24062.2.2.1.11.6.1.1.2]. | |
| korenix_Jetnet5010G_LedDI2Status | LED DI2 Status | It monitors the status of DI2 LED. Possible values are on(1), blinkNormal(2), blinkFast(3), off(4). [Jetnet5010G.MIB::ledDI2Status:1.3.6.1.4.1.24062.2.2.1.11.6.1.1.5]. | ||
| korenix_Jetnet5010G_LedDI1Status | LED DI1 Status | It monitors the status of DI1 LED. Possible values are on(1), blinkNormal(2), blinkFast(3), off(4). [Jetnet5010G.MIB::ledDI1Status:1.3.6.1.4.1.24062.2.2.1.11.6.1.1.4]. | ||
| korenix_Jetnet5010G_LedRMStatus | LED RM Status | It monitors the status of RM LED. Possible values are on(1), blinkNormal(2), blinkFast(3), off(4). [Jetnet5010G.MIB::ledRMStatus:1.3.6.1.4.1.24062.2.2.1.11.6.1.1.8]. | ||
| korenix_Jetnet5010G_LedDO1Status | LED DO1 Status | It monitors the status of DO1 LED. Possible values are on(1), blinkNormal(2), blinkFast(3), off(4). [Jetnet5010G.MIB::ledDO1Status:1.3.6.1.4.1.24062.2.2.1.11.6.1.1.6]. | ||
| korenix_Jetnet5010G_LedDO2Status | LED DO2 Status | It monitors the status of DO2 LED. Possible values are on(1), blinkNormal(2), blinkFast(3), off(4). [Jetnet5010G.MIB::ledDO2Status:1.3.6.1.4.1.24062.2.2.1.11.6.1.1.7]. | ||
| korenix_Jetnet5010G_LedPower2Status | LED Power2 Status | It monitors the status of Power 2 LED. Possible values are on(1), blinkNormal(2), blinkFast(3), off(4). [Jetnet5010G.MIB::ledPower2Status:1.3.6.1.4.1.24062.2.2.1.11.6.1.1.3]. |
Korenix Jetnet5010G Switch - Port SFP
Description
Template to monitor Korenix Jetnet5010G (sysObjectID : 1.3.6.1.4.1.24062.2.2.1) Switch SFP parameters like Temperature Current, Tx Power Current, Rx Power Current.
Prerequisites
No prerequisite
Supported Metric
| Monitor Name | Metric Name | Metric Display Name | Unit | Description |
|---|---|---|---|---|
| Korenix Jetnet5010G Switch - Port SFP | korenix_Jetnet5010G_PortSfpDdmTxPower | Port SFP Ddm Tx Power | dBm | It monitors the current SFP transmitted power of port.[Jetnet5010G.MIB::portSfpDdmTxPowerCurrent:1.3.6.1.4.1.24062.2.2.1.3.2.2.1.7]. |
| korenix_Jetnet5010G_PortSfpDdmRxPower | Port SFP Ddm Rx Power | dBm | It monitors the current SFP received power of port.[Jetnet5010G.MIB::portSfpDdmRxPowerCurrent:1.3.6.1.4.1.24062.2.2.1.3.2.2.1.9]. | |
| korenix_Jetnet5010G_PortSfpDdmTemperature | Port SFP Ddm Temperature | Celsius | It monitors the current SFP temperature of port. [Jetnet5010G.MIB::portSfpDdmTempatureCurrent:1.3.6.1.4.1.24062.2.2.1.3.2.2.1.5]. |
Korenix Jetnet5010G Switch - Port Statistics
Description
Template to monitor Korenix Jetnet5010G (sysObjectID : 1.3.6.1.4.1.24062.2.2.1) Switch port statistics like Rx bad packets, Rx abort packets, Tx bad packets, Packet collision.
Prerequisites
No prerequisite
Supported Metric
| Monitor Name | Metric Name | Metric Display Name | Unit | Description |
|---|---|---|---|---|
| Korenix Jetnet5010G Switch - Port Statistics | korenix_Jetnet5010G_PortRxBadPackets | Port Rx Bad Packets | packet/min | It monitors the count of bad frames received, which is the total number of undersize, fragment, oversize, jabber, RxErr and FCSErr frames. [Jetnet5010G.MIB::swPortStatRXBadPkt:1.3.6.1.4.1.24062.2.2.1.11.2.1.1.6]. |
| korenix_Jetnet5010G_PortPacketCollision | Port Packet Collision | packet/min | It monitors the count of collision.[Jetnet5010G.MIB::swPortStatPacketCollision:1.3.6.1.4.1.24062.2.2.1.11.2.1.1.10]. | |
| korenix_Jetnet5010G_PortTxBadPackets | Port Tx Bad Packets | packet/min | It monitors the count of FCSErr frames when transmit.[Jetnet5010G.MIB::swPortStatTXBadPkt:1.3.6.1.4.1.24062.2.2.1.11.2.1.1.9]. | |
| korenix_Jetnet5010G_PortRxAbortPackets | Port Rx Abort Packets | packet/min | It monitors the count of abort frames when receive, which is the total number of discarded and filtered frames.[Jetnet5010G.MIB::swPortStatRXAbortPkt:1.3.6.1.4.1.24062.2.2.1.11.2.1.1.7]. |
Korenix Jetnet5310G Switch - Hardware Status
Description
Template to monitor Korenix Jetnet5310G (sysObjectID : 1.3.6.1.4.1.24062.2.3.9) Switch hardware status parameters like LED power1 status, power2 status, DI1 status, DO1 status, ready status, RM status, RF status.
Prerequisites
No prerequisite
Supported Metric
| Monitor Name | Metric Name | Metric Display Name | Unit | Description |
|---|---|---|---|---|
| Korenix Jetnet5310G Switch - Hardware Status | korenix_Jetnet5310G_LedRFStatus | LED RF Status | It monitors the status of RF LED. Possible values are on(1), blinkNormal(2), blinkFast(3), off(4). [Jetnet5310G.MIB::ledRFStatus:1.3.6.1.4.1.24062.2.3.9.12.6.1.1.8]. | |
| korenix_Jetnet5310G_LedRMStatus | LED RM Status | It monitors the status of RM LED. Possible values are on(1), blinkNormal(2), blinkFast(3), off(4). [Jetnet5310G.MIB::ledRMStatus:1.3.6.1.4.1.24062.2.3.9.12.6.1.1.7]. | ||
| korenix_Jetnet5310G_LedDO1Status | LED DO1 Status | It monitors the status of DO1 LED. Possible values are on(1), blinkNormal(2), blinkFast(3), off(4). [Jetnet5310G.MIB::ledDO1Status:1.3.6.1.4.1.24062.2.3.9.12.6.1.1.5]. | ||
| korenix_Jetnet5310G_LedPower2Status | LED Power2 Status | It monitors the status of Power 2 LED. Possible values are on(1), blinkNormal(2), blinkFast(3), off(4). [Jetnet5310G.MIB::ledPower2Status:1.3.6.1.4.1.24062.2.3.9.12.6.1.1.3]. | ||
| korenix_Jetnet5310G_LedDI1Status | LED DI1 Status | It monitors the status of DI1 LED. Possible values are on(1), blinkNormal(2), blinkFast(3), off(4). [Jetnet5310G.MIB::ledDI1Status:1.3.6.1.4.1.24062.2.3.9.12.6.1.1.4]. | ||
| korenix_Jetnet5310G_LedPower1Status | LED Power1 Status | It monitors the status of Power 1 LED. Possible values are on(1), blinkNormal(2), blinkFast(3), off(4). [Jetnet5310G.MIB::ledPower1Status:1.3.6.1.4.1.24062.2.3.9.12.6.1.1.2]. | ||
| korenix_Jetnet5310G_LedReadyStatus | LED Ready Status | It monitors the status of System Ready LED. Possible values are on(1), blinkNormal(2), blinkFast(3), off(4). [Jetnet5310G.MIB::ledRDYStatus:1.3.6.1.4.1.24062.2.3.9.12.6.1.1.6]. |
Korenix Jetnet5310G Switch - Port SFP
Description
Template to monitor Korenix Jetnet5310G (sysObjectID : 1.3.6.1.4.1.24062.2.3.9) Switch SFP parameters like Temperature Current, Tx Power Current, Rx Power Current.
Prerequisites
No prerequisite
Supported Metric
| Monitor Name | Metric Name | Metric Display Name | Unit | Description |
|---|---|---|---|---|
| Korenix Jetnet5310G Switch - Port SFP | korenix_Jetnet5310G_PortSfpDdmTemperature | Port SFP Ddm Temperature | Celsius | It monitors the current SFP temperature of port. [Jetnet5310G.MIB::portSfpDdmTempatureCurrent:1.3.6.1.4.1.24062.2.3.9.3.2.2.1.5]. |
| korenix_Jetnet5310G_PortSfpDdmRxPower | Port SFP Ddm Rx Power | dBm | It monitors the current SFP received power of port.[Jetnet5310G.MIB::portSfpDdmRxPowerCurrent:1.3.6.1.4.1.24062.2.3.9.3.2.2.1.9]. | |
| korenix_Jetnet5310G_PortSfpDdmTxPower | Port SFP Ddm Tx Power | dBm | It monitors the current SFP transmitted power of port.[Jetnet5310G.MIB::portSfpDdmTxPowerCurrent:1.3.6.1.4.1.24062.2.3.9.3.2.2.1.7]. |
Korenix Jetnet5310G Switch - Port Statistics
Description
Template to monitor Korenix Jetnet5310G (sysObjectID : 1.3.6.1.4.1.24062.2.3.9) Switch port statistics like Rx bad packets, Rx abort packets, Tx bad packets, Packet collision.
Prerequisites
No prerequisite
Supported Metric
| Monitor Name | Metric Name | Metric Display Name | Unit | Description |
|---|---|---|---|---|
| Korenix Jetnet5310G Switch - Port Statistics | korenix_Jetnet5310G_PortPacketCollision | Port Packet Collision | packet/min | It monitors the count of collision.[Jetnet5310G.MIB::swPortStatPacketCollision:1.3.6.1.4.1.24062.2.3.9.12.2.1.1.10]. |
| korenix_Jetnet5310G_PortRxAbortPackets | Port Rx Abort Packets | packet/min | It monitors the count of abort frames when receive, which is the total number of discarded and filtered frames.[Jetnet5310G.MIB::swPortStatRXAbortPkt:1.3.6.1.4.1.24062.2.3.9.12.2.1.1.7]. | |
| korenix_Jetnet5310G_PortRxBadPackets | Port Rx Bad Packets | packet/min | It monitors the count of bad frames received, which is the total number of undersize, fragment, oversize, jabber, RxErr and FCSErr frames. [Jetnet5310G.MIB::swPortStatRXBadPkt:1.3.6.1.4.1.24062.2.3.9.12.2.1.1.6]. | |
| korenix_Jetnet5310G_PortTxBadPackets | Port Tx Bad Packets | packet/min | It monitors the count of FCSErr frames when transmit.[Jetnet5310G.MIB::swPortStatTXBadPkt:1.3.6.1.4.1.24062.2.3.9.12.2.1.1.9]. |
Korenix Jetnet6059G Switch - Hardware Status
Description
Template to monitor Korenix Jetnet6059G (sysObjectID : 1.3.6.1.4.1.24062.2.4.1) Switch hardware status parameters like LED power1 status, power2 status, DI1 status, DO1 status, ready status, RM status, RF status.
Prerequisites
No prerequisite
Supported Metric
| Monitor Name | Metric Name | Metric Display Name | Unit | Description |
|---|---|---|---|---|
| Korenix Jetnet6059G Switch - Hardware Status | korenix_Jetnet6059G_LedPower1Status | LED Power1 Status | It monitors the status of Power 1 LED. Possible values are on(1), blinkNormal(2), blinkFast(3), off(4). [Jetnet6059G.MIB::ledPower1Status:1.3.6.1.4.1.24062.2.4.1.11.6.1.1.2]. | |
| korenix_Jetnet6059G_LedPower2Status | LED Power2 Status | It monitors the status of Power 2 LED. Possible values are on(1), blinkNormal(2), blinkFast(3), off(4). [Jetnet6059G.MIB::ledPower2Status:1.3.6.1.4.1.24062.2.4.1.11.6.1.1.3]. | ||
| korenix_Jetnet6059G_LedRFStatus | LED RF Status | It monitors the status of RF LED. Possible values are on(1), blinkNormal(2), blinkFast(3), off(4). [Jetnet6059G.MIB::ledRFStatus:1.3.6.1.4.1.24062.2.4.1.11.6.1.1.8]. | ||
| korenix_Jetnet6059G_LedDI1Status | LED DI1 Status | It monitors the status of DI1 LED. Possible values are on(1), blinkNormal(2), blinkFast(3), off(4). [Jetnet6059G.MIB::ledDI1Status:1.3.6.1.4.1.24062.2.4.1.11.6.1.1.4]. | ||
| korenix_Jetnet6059G_LedReadyStatus | LED Ready Status | It monitors the status of System Ready LED. Possible values are on(1), blinkNormal(2), blinkFast(3), off(4). [Jetnet6059G.MIB::ledRDYStatus:1.3.6.1.4.1.24062.2.4.1.11.6.1.1.6]. | ||
| korenix_Jetnet6059G_LedDO1Status | LED DO1 Status | It monitors the status of DO1 LED. Possible values are on(1), blinkNormal(2), blinkFast(3), off(4). [Jetnet6059G.MIB::ledDO1Status:1.3.6.1.4.1.24062.2.4.1.11.6.1.1.5]. | ||
| korenix_Jetnet6059G_LedRMStatus | LED RM Status | It monitors the status of RM LED. Possible values are on(1), blinkNormal(2), blinkFast(3), off(4). [Jetnet6059G.MIB::ledRMStatus:1.3.6.1.4.1.24062.2.4.1.11.6.1.1.7]. |
Korenix Jetnet6059G Switch - Port SFP
Description
Template to monitor Korenix Jetnet6059G (sysObjectID : 1.3.6.1.4.1.24062.2.4.1) Switch SFP parameters like Temperature Current, Tx Power Current, Rx Power Current.
Prerequisites
No prerequisite
Supported Metric
| Monitor Name | Metric Name | Metric Display Name | Unit | Description |
|---|---|---|---|---|
| Korenix Jetnet6059G Switch - Port SFP | korenix_Jetnet6059G_PortSfpDdmTxPower | Port SFP Ddm Tx Power | dBm | It monitors the current SFP transmitted power of port.[Jetnet6059G.MIB::portSfpDdmTxPowerCurrent:1.3.6.1.4.1.24062.2.4.1.3.2.2.1.7]. |
| korenix_Jetnet6059G_PortSfpDdmRxPower | Port SFP Ddm Rx Power | dBm | It monitors the current SFP received power of port.[Jetnet6059G.MIB::portSfpDdmRxPowerCurrent:1.3.6.1.4.1.24062.2.4.1.3.2.2.1.9]. | |
| korenix_Jetnet6059G_PortSfpDdmTemperature | Port SFP Ddm Temperature | Celsius | It monitors the current SFP temperature of port. [Jetnet6059G.MIB::portSfpDdmTempatureCurrent:1.3.6.1.4.1.24062.2.4.1.3.2.2.1.5]. |
Korenix Jetnet6059G Switch - Port Statistics
Description
Template to monitor Korenix Jetnet6059G (sysObjectID : 1.3.6.1.4.1.24062.2.4.1) Switch port statistics like Rx bad packets, Rx abort packets, Tx bad packets, Packet collision.
Prerequisites
No prerequisite
Supported Metric
| Monitor Name | Metric Name | Metric Display Name | Unit | Description |
|---|---|---|---|---|
| Korenix Jetnet6059G Switch - Port Statistics | korenix_Jetnet6059G_PortTxBadPackets | Port Tx Bad Packets | packet/min | It monitors the count of FCSErr frames when transmit.[Jetnet6059G.MIB::swPortStatTXBadPkt:1.3.6.1.4.1.24062.2.4.1.11.2.1.1.9]. |
| korenix_Jetnet6059G_PortRxBadPackets | Port Rx Bad Packets | packet/min | It monitors the count of bad frames received, which is the total number of undersize, fragment, oversize, jabber, RxErr and FCSErr frames. [Jetnet6059G.MIB::swPortStatRXBadPkt:1.3.6.1.4.1.24062.2.4.1.11.2.1.1.6]. | |
| korenix_Jetnet6059G_PortRxAbortPackets | Port Rx Abort Packets | packet/min | It monitors the count of abort frames when receive, which is the total number of discarded and filtered frames.[Jetnet6059G.MIB::swPortStatRXAbortPkt:1.3.6.1.4.1.24062.2.4.1.11.2.1.1.7]. | |
| korenix_Jetnet6059G_PortPacketCollision | Port Packet Collision | packet/min | It monitors the count of collision.[Jetnet6059G.MIB::swPortStatPacketCollision:1.3.6.1.4.1.24062.2.4.1.11.2.1.1.10]. |
Korenix JetNet Switch - Device Power Status
Description
Monitors the Korenix JetNet Switch Device Power Status. Validated on the Korenix JetNet Switch, Model : JetNet5210GP-2C, SysObjectOID : 1.3.6.1.4.1.24062.2.100.60. [ BeSystemInfo-MIB :: devicePowerStatus : 1.3.6.1.4.1.24062.2.100.60.1.3.2.1.3 ].
Prerequisites
Device must have support for BeSystemInfo-MIB.
Supported Metric
| Monitor Name | Metric Name | Metric Display Name | Unit | Description |
|---|---|---|---|---|
| Korenix JetNet Switch - Device Power Status | korenix_jetnet_device_power_Status | Korenix JetNet Device Power Status | Monitors the Korenix JetNet Device Power Status . [ BeSystemInfo-MIB :: devicePowerStatus : 1.3.6.1.4.1.24062.2.100.60.1.3.2.1.3 ]. Possible Values are 0 : online, 1 : offline |
Korenix Jetnet Switch - Port PoE
Description
Monitors the Korenix Jetnet Switch PoE Global Admin Metrics like Power Consumption Total, Voltage, Status, and PoE Port-Specific Metrics like Status, Current, Power Consumption, SFP Ddm Metrics like Temperature, Tx Power, Rx Power and Tx Bias Current. Validated on the Korenix JetNet Switch, Model : JetNet5210GP-2C, SysObjectOID : 1.3.6.1.4.1.24062.2.100.60. [ BePoe-MIB :: fsPoeGlobalAdminTotalPowerConsumed : 1.3.6.1.4.1.24062.2.100.60.3.1.4, fsPoeGlobalAdminInputVoltage : 1.3.6.1.4.1.24062.2.100.60.3.1.3 , fsPoeGlobalAdminStatus : 1.3.6.1.4.1.24062.2.100.60.3.1.1, fsPoePortStatus : 1.3.6.1.4.1.24062.2.100.60.3.1.5.1.4, fsPoePortPowerCurrent : 1.3.6.1.4.1.24062.2.100.60.3.1.5.1.8, fsPoePortPowerConsumption : 1.3.6.1.4.1.24062.2.100.60.3.1.5.1.9 ].
Prerequisites
Device must have support for BePoe-MIB.
Supported Metric
| Monitor Name | Metric Name | Metric Display Name | Unit | Description |
|---|---|---|---|---|
| Korenix JetNet Switch - PoE Global Stats | korenix_jetnet_poe_global_power_consumption_Total | Korenix JetNet PoE Global Power Consumption Total | Watts | Monitors the Korenix JetNet PoE Global Admin Power Consumption Total. [ BePoe-MIB :: fsPoeGlobalAdminTotalPowerConsumed : 1.3.6.1.4.1.24062.2.100.60.3.1.4.0 ]. |
| Korenix JetNet Switch - PoE Global Stats | korenix_jetnet_poe_global_input_Voltage | v | Monitors the Korenix JetNet PoE Global Admin Input Voltage. [ BePoe-MIB :: fsPoeGlobalAdminInputVoltage : 1.3.6.1.4.1.24062.2.100.60.3.1.3.0 ]. | |
| korenix_jetnet_poe_global_Status | Korenix JetNet PoE Global Admin Status | Monitors the Korenix JetNet PoE Global Admin Status. [ BePoe-MIB :: fsPoeGlobalAdminStatus : 1.3.6.1.4.1.24062.2.100.60.3.1.1.0 ]. Possible Values are 1 : start, 2 : shutdown | ||
| Korenix Jetnet Switch - PoE Port Stats | korenix_jetnet_interface_poe_Status | Korenix JetNet Interface PoE Status | Monitors the Korenix JetNet Interface PoE Status. [ BePoe-MIB :: fsPoePortStatus : 1.3.6.1.4.1.24062.2.100.60.3.1.5.1.4 ]. Possible Values are 1: disable, 2: searching, 3: deliveringPower, 4: powFault, 5: poeTest, 6: poeOtherFault, 7: poeOverload. | |
| korenix_jetnet_interface_poe_power_Current | Korenix JetNet Interface PoE Power Current | mA | Monitors the Korenix JetNet Interface PoE Power Current. [ BePoe-MIB :: fsPoePortPowerCurrent : 1.3.6.1.4.1.24062.2.100.60.3.1.5.1.8 ]. | |
| korenix_jetnet_interface_poe_power_Consumption | Korenix JetNet Interface PoE Power Consumption | W | Monitors the Korenix JetNet Interface PoE Power Consumption. [ BePoe-MIB :: fsPoePortPowerConsumption : 1.3.6.1.4.1.24062.2.100.60.3.1.5.1.9 ]. |
Korenix Jetnet Switch - Port SFP
Description
Monitors the Korenix Jetnet Switch SFP Ddm Metrics like Temperature, Tx Power, Rx Power and Tx Bias Current. Validated on the Korenix JetNet Device, Model : JetNet5210GP-2C, SysObjectOID : 1.3.6.1.4.1.24062.2.100.60. [ BeSFP-MIB :: ddmTemperatureCurrent : 1.3.6.1.4.1.24062.2.100.60.2.2.1.1.2, ddmTxPowerCurrent :: 1.3.6.1.4.1.24062.2.100.60.2.2.1.1.12, ddmRxPowerCurrent : 1.3.6.1.4.1.24062.2.100.60.2.2.1.1.17, ddmTxBiasCurrent : 1.3.6.1.4.1.24062.2.100.60.2.2.1.1.7 ].
Prerequisites
Device must have support for BeSFP-MIB.
Supported Metric
| Monitor Name | Metric Name | Metric Display Name | Unit | Description |
|---|---|---|---|---|
| Korenix Jetnet Switch - SFP Port DDM Stats | korenix_jetnet_interface_sfp_ddm_Temperature | Korenix JetNet SFP Ddm Temperature | Celsius | Monitors the Korenix JetNet SFP Ddm Temperature Current. [ BeSFP-MIB :: ddmTemperatureCurrent : 1.3.6.1.4.1.24062.2.100.60.2.2.1.1.2 ]. |
| korenix_jetnet_interface_sfp_ddm_tx_Power | Korenix JetNet SFP Ddm Tx Power | dBm | Monitors the Korenix JetNet SFP Ddm Tx Power. [ BeSFP-MIB :: ddmTxPowerCurrent :: 1.3.6.1.4.1.24062.2.100.60.2.2.1.1.12 ]. | |
| korenix_jetnet_interface_sfp_ddm_rx_Power | Korenix JetNet SFP Ddm Rx Rower | dBm | Monitos the Korenix JetNet SFP Ddm Tx Rower. [ BeSFP-MIB :: ddmRxPowerCurrent : 1.3.6.1.4.1.24062.2.100.60.2.2.1.1.17]. | |
| korenix_jetnet_interface_sfp_ddm_tx_BiasCurrent | Korenix JetNet SFP Ddm Tx Bias Current | mA | Monitos the Korenix JetNet SFP Ddm Tx Bias Current. [ BeSFP-MIB :: ddmTxBiasCurrent : 1.3.6.1.4.1.24062.2.100.60.2.2.1.1.7 ]. |
Liebert - PDU
Description
Template to monitor Liebert PDU parameters like system status,power source neutral current,receptacle branch real power,receptacle branch apparent power, receptacle branch electrical current (SysObjId:1.3.6.1.4.1.476.1.42)
Prerequisites
LIEBERT-GP-PDU-MIB
Supported Metric
| Monitor Name | Metric Name | Metric Display Name | Unit | Description |
|---|---|---|---|---|
| Liebert PDU Receptacle Branch | liebert.pdu.receptacle.branch.real.power | PDU Receptacle Branch Real Power | W | It gives the line-to-neutral measurement of the Real Power [LIEBERT-GP-PDU-MIB :: lgpPduRbEntryPwr - 1.3.6.1.4.1.476.1.42.3.8.40.20.1.115] |
| liebert.pdu.receptacle.branch.apparent.power | PDU Receptacle Branch Apparent Power(VoltAmp) | It gives the line-to-neutral measurement of the Apparent Power(VoltAmp) [LIEBERT-GP-PDU-MIB :: lgpPduRbEntryAp - 1.3.6.1.4.1.476.1.42.3.8.40.20.1.120] | ||
| liebert.pdu.receptacle.branch.electrical.current | PDU Receptacle Branch Electrical Current(Amp-AC-RMS) | It gives the line-to-neutral measurement of the Electrical Current measured in Amperes RMS (Root Mean Squared) [LIEBERT-GP-PDU-MIB :: lgpPduRbEntryEcHundredths - 1.3.6.1.4.1.476.1.42.3.8.40.20.1.130] | Liebert PDU Power Source | liebert.pdu.powersource.neutral.current | PDU Powersource Neutral Current(Amp-AC-RMS) | It measures the neutral current at the PDU's power source in Amperes RMS (Root Mean Squared) [LIEBERT-GP-PDU-MIB :: lgpPduPsEntryEcNeutral - 1.3.6.1.4.1.476.1.42.3.8.30.20.1.70] |
| Liebert PDU System Health | liebert.pdu.system.status | PDU System Status | It monitors the PDU system status[LIEBERT-GP-PDU-MIB :: lgpPduEntrySysStatus -1.3.6.1.4.1.476.1.42.3.8.20.1.25] |
Liebert - System Health
Description
Template to monitors Liebert system health parameters like Dehumidifying State, Heating State, Cooling Capacity, Cooling State, Humidifying State, System State, humidity value and temperature value. [Validated on Liebert IS-UNITY-DP Communications Card. SysObjId: 1.3.6.1.4.1.476.1.42]
Prerequisites
Device should support LIEBERT-GP-ENVIRONMENTAL-MIB OIDs
Supported Metric
| Monitor Name | Metric Name | Metric Display Name | Unit | Description |
|---|---|---|---|---|
| Liebert Environmental Humidity | vertiv.liebert.humidity.value | Humidity Measurment | % | It monitors the measured humidity value. Units: percent Relative Humidity. [LIEBERT-GP-ENVIRONMENTAL-MIB::lgpEnvHumidityMeasurementRel - 1.3.6.1.4.1.476.1.42.3.4.2.2.3.1.3, lgpEnvHumidityDescrRel - 1.3.6.1.4.1.476.1.42.3.4.2.2.3.1.2] |
| Liebert Environmental States | vertiv.liebert.system.state | System State | It monitors the present state of the Liebert system. Possible state values are 1: on, 2: off, 3: standby. [LIEBERT-GP-ENVIRONMENTAL-MIB::lgpEnvStateSystem - 1.3.6.1.4.1.476.1.42.3.4.3.1.0] | |
| vertiv.liebert.cooling.state | Cooling State | It monitors the present state of the cooling subsystem. Possible state values are 1:On, 2:Off. [LIEBERT-GP-ENVIRONMENTAL-MIB::lgpEnvStateCooling - 1.3.6.1.4.1.476.1.42.3.4.3.2.0] | ||
| vertiv.liebert.heating.state | Heating State | It monitors the present state of the heating subsystem. Possible state values are 1:On, 2:Off. [LIEBERT-GP-ENVIRONMENTAL-MIB::lgpEnvStateHeating - 1.3.6.1.4.1.476.1.42.3.4.3.3.0] | ||
| vertiv.liebert.humidifier.state | Humidifying State | It monitors the present state of the humidifier subsystem. Possible state values are 1: on, 2: off. [LIEBERT-GP-ENVIRONMENTAL-MIB::lgpEnvStateHumidifying 1.3.6.1.4.1.476.1.42.3.4.3.4.0] | ||
| vertiv.liebert.dehumidifier.state | Dehumidifying State | It monitors the present state of the dehumidifier subsystem. Possible state values are 1:on, 2:off. [LIEBERT-GP-ENVIRONMENTAL-MIB::lgpEnvStateDehumidifying - 1.3.6.1.4.1.476.1.42.3.4.3.5.0] | ||
| vertiv.liebert.cooling.capacity | Cooling Capacity | % | It monitors the percentage of the cooling capacity presently in use. [LIEBERT-GP-ENVIRONMENTAL-MIB::lgpEnvStateCoolingCapacity - 1.3.6.1.4.1.476.1.42.3.4.3.9.0] | |
| Liebert Environmental Temperature | vertiv.liebert.temperature.value | Temp Measurement F | F | It monitors the measured temperature value. Units: degrees Fahrenheit. [LIEBERT-GP-ENVIRONMENTAL-MIB::lgpEnvTemperatureDescrDegF - 1.3.6.1.4.1.476.1.42.3.4.1.2.3.1.2lgpEnvTemperatureMeasurementDegF - 1.3.6.1.4.1.476.1.42.3.4.1.2.3.1.3] |
Lighttpd Performance Template
Description
Lighttpd Performance Template
Prerequisites
No prerequisite
Supported Metric
| Monitor Name | Metric Name | Metric Display Name | Unit | Description |
|---|---|---|---|---|
| Lighttpd Performance Monitor | lighttpd.uptime | Lighttpd Uptime | s | The amount of time the server has been up and running. |
| lighttpd.busy.workers | Lighttpd Busy Workers | count | The number of active connections. | |
| lighttpd.idle.workers | Lighttpd Idle Workers | count | The number of idle connections. | |
| lighttpd.totalkbytes | Lighttpd TotalBytes | count | The number of bytes sent and received since start. | |
| lighttpd.totalaccesses | Lighttpd Total Accesses | count | The number of hits since start. |
LM Sensors
Description
Monitors Temperature, Fan Speed and Voltages with LM sensors on Linux hosts.
Prerequisites
No prerequisite
Supported Metric
| Monitor Name | Metric Name | Metric Display Name | Unit | Description |
|---|---|---|---|---|
| LM Sensors Fan Speeds | lm.fan.sensor.value | LM Sensors Fans | rpm | Provides the rotation speed of the fan in RPM. [OIDs: 1.3.6.1.4.1.2021.13.16.3.1.2, 1.3.6.1.4.1.2021.13.16.3.1.3] |
| LM Sensors Miscellaneous | lm.misc.sensor.value | MISC Sensor Value | Provides the value of miscellaneous sensor. [OIDs: 1.3.6.1.4.1.2021.13.16.5.1.2, 1.3.6.1.4.1.2021.13.16.5.1.3] | |
| LM Sensors Temperatures | lm.temp.sensor.value | LM Sensors Temperatures | C | Provides the temperature on this sensor in degree Centigrade. [OIDs: 1.3.6.1.4.1.2021.13.16.2.1.2, 1.3.6.1.4.1.2021.13.16.2.1.3] |
| LM Sensors Voltages | lm.voltage.sensor.value | LM Sensors Voltages | mV | Provides the voltage in mV. [OIDs: 1.3.6.1.4.1.2021.13.16.4.1.2, 1.3.6.1.4.1.2021.13.16.4.1.3] |
Mcafee Email Gateway (MEG) - Hardware
Description
Template to monitor Mcafee Gateway system hardware parameters like Temperature State, Voltage State, Power Supplies State, Cooling State, Other Modules State, Up State, Bridge State, Raid State.
Prerequisites
No prerequisite
Supported Metric
| Monitor Name | Metric Name | Metric Display Name | Unit | Description |
|---|---|---|---|---|
| Mcafee Email Gateway - Hardware | mcafee_gateway_hardware_CoolingState | Mcafee Gateway Hardware Cooling State | Monitors the health of the Cooling Sensors [MCAFEE-MEG-MIB :: hardware-cooling-state : 1.3.6.1.4.1.1230.2.4.1.2.3.2.4.0] Possible values are healthy(0), operational-but-requires-attention(1), end-of-life-reached(3), near-end-of-life(4), corrupt-dats(5), corrupt-configuration(6), requires-immediate-attention(7), critical(8), unknown-state(9), disabled(10), not-applicable(11). | |
| mcafee_gateway_hardware_UpsState | Mcafee Gateway Hardware Ups State | Monitors the health of the UPS [MCAFEE-MEG-MIB :: ups-state : 1.3.6.1.4.1.1230.2.4.1.2.3.2.6.0] Possible values are healthy(0), operational-but-requires-attention(1), end-of-life-reached(3), near-end-of-life(4), corrupt-dats(5), corrupt-configuration(6), requires-immediate-attention(7), critical(8), unknown-state(9), disabled(10), not-applicable(11). | ||
| mcafee_gateway_hardware_PowerSuppliesState | Mcafee Gateway Hardware Power Supplies State | Monitors the health of the Power Supplies Sensors [MCAFEE-MEG-MIB :: hardware-power-supplies-state : 1.3.6.1.4.1.1230.2.4.1.2.3.2.3.0]nPossible values are healthy(0), operational-but-requires-attention(1), end-of-life-reached(3), near-end-of-life(4), corrupt-dats(5), corrupt-configuration(6), requires-immediate-attention(7), critical(8), unknown-state(9), disabled(10), not-applicable(11). | ||
| mcafee_gateway_hardware_VoltageState | Mcafee Gateway Hardware Voltage State | Monitors the health of the voltage Sensors [MCAFEE-MEG-MIB :: hardware-voltage-state : 1.3.6.1.4.1.1230.2.4.1.2.3.2.2.0] Possible values are healthy(0), operational-but-requires-attention(1), end-of-life-reached(3), near-end-of-life(4), corrupt-dats(5), corrupt-configuration(6), requires-immediate-attention(7), critical(8), unknown-state(9), disabled(10), not-applicable(11) | ||
| mcafee_gateway_hardware_BridgeState | Mcafee Gateway Hardware Bridge State | Monitors the health of bridge mode [MCAFEE-MEG-MIB :: bridge-state : 1.3.6.1.4.1.1230.2.4.1.2.3.2.7.0] Possible values are healthy(0), operational-but-requires-attention(1), end-of-life-reached(3), near-end-of-life(4), corrupt-dats(5), corrupt-configuration(6), requires-immediate-attention(7), critical(8), unknown-state(9), disabled(10), not-applicable(11). | ||
| mcafee_gateway_hardware_OtherModulesState | Mcafee Gateway Hardware Other Modules State | Monitors the health of Other Hardware Sensors [MCAFEE-MEG-MIB :: hardware-other-modules-state : 1.3.6.1.4.1.1230.2.4.1.2.3.2.5.0] Possible values are healthy(0), operational-but-requires-attention(1), end-of-life-reached(3), near-end-of-life(4), corrupt-dats(5), corrupt-configuration(6), requires-immediate-attention(7), critical(8), unknown-state(9), disabled(10), not-applicable(11). | ||
| mcafee_gateway_hardware_RaidState | Mcafee Gateway Hardware Raid State | Monitors the health of the RAID/Disk System [MCAFEE-MEG-MIB :: raid-state : 1.3.6.1.4.1.1230.2.4.1.2.3.2.8.0] Possible values are healthy(0), operational-but-requires-attention(1), end-of-life-reached(3), near-end-of-life(4), corrupt-dats(5), corrupt-configuration(6), requires-immediate-attention(7), critical(8), unknown-state(9), disabled(10), not-applicable(11). | ||
| mcafee_gateway_hardware_TemperatureState | Mcafee Gateway Hardware Temperature State | Monitors the health of the temperature Sensors[MCAFEE-MEG-MIB :: hardware-temperature-state : 1.3.6.1.4.1.1230.2.4.1.2.3.2.1.0] Possible values are healthy(0), operational-but-requires-attention(1), end-of-life-reached(3), near-end-of-life(4), corrupt-dats(5), corrupt-configuration(6), requires-immediate-attention(7), critical(8), unknown-state(9), disabled(10), not-applicable(11) |
Mcafee Email Gateway (MEG) - Pop3
Description
Template to monitor pop3 statistics like Pop3 Blocked Connections, Pop3 Neat Scan Result Detection Packers Scanner, Pop3 Neat Scan Result Detection Pups Scanner, Pop3 Neat Scan Result Detection Virus Scanner, Pop3 Conn Messages, Pop3 State, Pop3 Total Bytes, Pop3 Total Connections, Pop3 Detect Total.
Prerequisites
No prerequisite
Supported Metric
| Monitor Name | Metric Name | Metric Display Name | Unit | Description |
|---|---|---|---|---|
| Mcafee Email Gateway - Pop3 | mcafee_gateway_pop3_ConnMessages | Mcafee Gateway Pop3 Conn Messages | count | Monitors the total number of e-mail messages [MCAFEE-MEG-MIB :: pop3-conn-messages : 1.3.6.1.4.1.1230.2.4.1.2.5.2.1.0] |
| mcafee_gateway_pop3_NeatScanResultDetectionPackersScanner | Mcafee Gateway Pop3 Neat Scan Result Detection Packers Scanner | count | Monitors the total number of packers detected by the McAfee AV engine [MCAFEE-MEG-MIB :: pop3-neat-scanresult-detection-packers-scanner-mcafee : 1.3.6.1.4.1.1230.2.4.1.2.5.3.10.1.1.0] | |
| mcafee_gateway_pop3_NeatScanresultDetectionPupsScanner | Mcafee Gateway Pop3 Neat Scan Result Detection Pups Scanner | count | Monitors the total number of PUPs detected by the McAfee AV engine [MCAFEE-MEG-MIB :: pop3-neat-scanresult-detection-pups-scanner-mcafee : 1.3.6.1.4.1.1230.2.4.1.2.5.3.9.1.1.0] | |
| mcafee_gateway_pop3_BlockedConnections | Mcafee Gateway Pop3 Blocked Connections | count | Monitors the connections that have been blocked [MCAFEE-MEG-MIB :: pop3-BlockedConnections : 1.3.6.1.4.1.1230.2.4.1.2.5.1.3.0] | |
| mcafee_gateway_pop3_TotalConnections | Mcafee Gateway Pop3 Total Connections | count | Monitors the total connections used [MCAFEE-MEG-MIB :: pop3-TotalConnections : 1.3.6.1.4.1.1230.2.4.1.2.5.1.2.0] | |
| mcafee_gateway_pop3_NeatScanresultDetectionVirusScanner | Mcafee Gateway Pop3 Neat Scan Result Detection Virus Scanner | count | monitors the total number of viruses detected by the McAfee AV engine [MCAFEE-MEG-MIB :: pop3-neat-scanresult-detection-virus-scanner-mcafee : 1.3.6.1.4.1.1230.2.4.1.2.5.3.8.1.1.0] | |
| mcafee_gateway_pop3_DetectTotal | Mcafee Gateway Pop3 Detect Total | count | Monitors the number of total detections [MCAFEE-MEG-MIB :: pop3-detect-total : 1.3.6.1.4.1.1230.2.4.1.2.5.3.1.0] | |
| mcafee_gateway_pop3_State | Mcafee Gateway Pop3 State | Monitors the health of the POP3 protocol [MCAFEE-MEG-MIB :: pop3-state : 1.3.6.1.4.1.1230.2.4.1.2.3.4.8.0], Possible values are healthy(0), operational-but-requires-attention(1), end-of-life-reached(3), near-end-of-life(4), corrupt-dats(5), corrupt-configuration(6), requires-immediate-attention(7), critical(8), unknown-state(9), disabled(10), not-applicable(11). | ||
| mcafee_gateway_pop3_TotalBytes | Mcafee Gateway Pop3 Total Bytes | count | Monitors the total data transferred through a proxy [MCAFEE-MEG-MIB :: pop3-TotalBytes : 1.3.6.1.4.1.1230.2.4.1.2.5.1.1.0] |
Mcafee Email Gateway (MEG) - SMTP
Description
Template to monitor SMTP parameters like Smtp State, Smtp Blocked Connections, Smtp Compliancy In, Smtp Compliancy Out, Smtp Detect Content Total, Smtp Detect Directory Harvest, Smtp Detect DKim, Smtp Detect Packers Scanner Mcafee, Smtp Detect Pups In Scanner Mcafee, Smtp Detect Virus In Scanner Mcafee, Smtp Detect Virus Out Scanner Mcafee, Smtp Detect Pups Out Scanner Mcafee, Smtp Messages In, Smtp Messages Out, Smtp Detect Packers, Smtp Blocked Phish In, Smtp Blocked Phish Out, Smtp Blocked Pups In ,Smtp Blocked Pups Out, Smtp Blocked Rbl In, Smtp Blocked Rbl Out, Smtp Blocked Sender Connection Total Out, Smtp Blocked Spam Out, Smtp Blocked Spam In, Smtp Blocked Threshold Exceeded In, Smtp Total Bytes, Smtp Total Connections, Smtp Blocked Virus In, Smtp Blocked Virus Out, Smtp Detect Virus.
Prerequisites
No prerequisite
Supported Metric
| Monitor Name | Metric Name | Metric Display Name | Unit | Description |
|---|---|---|---|---|
| Mcafee Email Gateway - SMTP | mcafee_gateway_smtp_DetectVirusOutScannerMcafee | Mcafee Gateway Smtp Detect Virus Out Scanner | count | Monitors the number of Outbound viruses detected by the McAfee AV engine [MCAFEE-MEG-MIB :: smtp-detect-virus-out-scanner-mcafee : 1.3.6.1.4.1.1230.2.4.1.2.4.5.28.1.1.0] |
| mcafee_gateway_smtp_BlockedPupsIn | Mcafee Gateway Smtp Blocked Pups In | count | Monitors the number of inbound potentially unwanted program blocked [MCAFEE-MEG-MIB :: smtp-blocked-pups-in : 1.3.6.1.4.1.1230.2.4.1.2.4.6.47.0] | |
| mcafee_gateway_smtp_DetectDkim | Mcafee Gateway Smtp Detect DKim | count | Monitors the total number of DKIM based detections [MCAFEE-MEG-MIB :: smtp-detect-dkim : 1.3.6.1.4.1.1230.2.4.1.2.4.3.15.0] | |
| mcafee_gateway_smtp_BlockedSenderConnectionTotalOut | Mcafee Gateway Smtp Blocked Sender Connection Total Out | count | Monitors the total number of blocked outbound e-mail messages due to sender/connection checks [MCAFEE-MEG-MIB :: smtp-blocked-sender-connection-total-out : 1.3.6.1.4.1.1230.2.4.1.2.4.7.23.0] | |
| mcafee_gateway_smtp_DetectVirusInScannerMcafee | Mcafee Gateway Smtp Detect Virus In Scanner | count | Monitors the number of Inbound viruses detected by the McAfee AV engine [MCAFEE-MEG-MIB :: smtp-detect-virus-in-scanner-mcafee : 1.3.6.1.4.1.1230.2.4.1.2.4.4.28.1.1.0] | |
| mcafee_gateway_smtp_BlockedPupsOut | Mcafee Gateway Smtp Blocked Pups Out | count | Monitors the number of outbound potentially unwanted program blocked [MCAFEE-MEG-MIB :: smtp-blocked-pups-out : 1.3.6.1.4.1.1230.2.4.1.2.4.7.47.0] | |
| mcafee_gateway_smtp_BlockedSpamOut | Mcafee Gateway Smtp Blocked Spam Out | count | Monitors the number of outbound spam blocked by SpamKiller [MCAFEE-MEG-MIB :: smtp-blocked-spam-out : 1.3.6.1.4.1.1230.2.4.1.2.4.7.38.0] | |
| mcafee_gateway_smtp_BlockedPhishOut | Mcafee Gateway Smtp Blocked Phish Out | count | Monitors the number of outbound phish blocked by SpamKiller [MCAFEE-MEG-MIB :: smtp-blocked-phish-out : 1.3.6.1.4.1.1230.2.4.1.2.4.7.39.0] | |
| mcafee_gateway_smtp_DetectDirectoryHarvest | Mcafee Gateway Smtp Detect Directory Harvest | count | Monitors the total number of Directoy Harvest based detections [MCAFEE-MEG-MIB :: smtp-detect-directory-harvest : 1.3.6.1.4.1.1230.2.4.1.2.4.3.11.0] | |
| mcafee_gateway_smtp_MessagesIn | Mcafee Gateway Smtp Messages In | count | Monitors the number of Inbound e-mail messages [MCAFEE-MEG-MIB :: smtp-messages-in : 1.3.6.1.4.1.1230.2.4.1.2.4.6.1.0] | |
| mcafee_gateway_smtp_TotalConnections | Mcafee Gateway Smtp Total Connections | count | Monitors the total connections used [MCAFEE-MEG-MIB :: smtp-TotalConnections : 1.3.6.1.4.1.1230.2.4.1.2.4.1.2.0] | |
| mcafee_gateway_smtp_BlockedSpamIn | Mcafee Gateway Smtp Blocked Spam In | count | Monitors the number of inbound spam blocked by SpamKiller [MCAFEE-MEG-MIB :: smtp-blocked-spam-in : 1.3.6.1.4.1.1230.2.4.1.2.4.6.38.0] | |
| mcafee_gateway_smtp_BlockedThresholdExceededIn | Mcafee Gateway Smtp Blocked Threshold Exceeded In | count | Monitors the total number of inbound emails rejected for exceeding the cumulative threshold score (sum of all cumulative rejects) [MCAFEE-MEG-MIB :: smtp-blocked-threshold-exceeded-in : 1.3.6.1.4.1.1230.2.4.1.2.4.6.49.0] | |
| mcafee_gateway_smtp_CompliancyIn | Mcafee Gateway Smtp Compliancy In | count | Monitors the number of inbound Compliance blocked [MCAFEE-MEG-MIB :: smtp-blocked-compliancy-in : 1.3.6.1.4.1.1230.2.4.1.2.4.6.43.0] | |
| mcafee_gateway_smtp_BlockedPhishIn | Mcafee Gateway Smtp Blocked Phish In | count | Monitors the number of inbound phish blocked by SpamKiller [MCAFEE-MEG-MIB :: smtp-blocked-phish-in : 1.3.6.1.4.1.1230.2.4.1.2.4.6.39.0] | |
| mcafee_gateway_smtp_State | Mcafee Gateway Smtp State | Monitors the health of the SMTP protocol [MCAFEE-MEG-MIB :: smtp-state : 1.3.6.1.4.1.1230.2.4.1.2.3.4.7.0] Possible values are healthy(0) , operational-but-requires-attention(1) , end-of-life-reached(3) , near-end-of-life(4) , corrupt-dats(5) , corrupt-configuration(6) , requires-immediate-attention(7) , critical(8) , unknown-state(9) , disabled(10) , not-applicable(11) . | ||
| mcafee_gateway_smtp_TotalBytes | Mcafee Gateway Smtp Total Bytes | count | Monitors the total data transferred through a proxy [MCAFEE-MEG-MIB :: smtp-TotalBytes : 1.3.6.1.4.1.1230.2.4.1.2.4.1.1.0] | |
| mcafee_gateway_smtp_DetectVirus | Mcafee Gateway Smtp Detect Virus | count | Monitors the total number of viruses detected [MCAFEE-MEG-MIB :: smtp-detect-virus : 1.3.6.1.4.1.1230.2.4.1.2.4.3.28.0] | |
| mcafee_gateway_smtp_DetectPackersScannerMcafee | Mcafee Gateway Smtp Detect Packers Scanner Mcafee | count | Monitors the total number of packers detected by the McAfee AV [MCAFEE-MEG-MIB :: smtp-detect-packers-scanner-mcafee : 1.3.6.1.4.1.1230.2.4.1.2.4.3.30.1.1.0] | |
| mcafee_gateway_smtp_BlockedVirusOut | Mcafee Gateway Smtp Blocked Virus Out | count | Monitors the number of outbound viruses blocked [MCAFEE-MEG-MIB :: smtp-blocked-virus-out : 1.3.6.1.4.1.1230.2.4.1.2.4.7.46.0] | |
| mcafee_gateway_smtp_DetectContentTotal | Mcafee Gateway Smtp Detect Content Total | count | Monitors the total number of Content detections [MCAFEE-MEG-MIB :: smtp-detect-content-total : 1.3.6.1.4.1.1230.2.4.1.2.4.3.12.0] | |
| mcafee_gateway_smtp_BlockedConnections | Mcafee Gateway Smtp Blocked Connections | count | Monitors the connections that have been blocked [MCAFEE-MEG-MIB :: smtp-BlockedConnections : 1.3.6.1.4.1.1230.2.4.1.2.4.1.3.0] | |
| mcafee_gateway_smtp_MessagesOut | Mcafee Gateway Smtp Messages Out | count | Monitors the number of Outbound e-mail messages [MCAFEE-MEG-MIB :: smtp-messages-out : 1.3.6.1.4.1.1230.2.4.1.2.4.7.1.0] | |
| mcafee_gateway_smtp_CompliancyOut | Mcafee Gateway Smtp Compliancy Out | count | Monitors the number of outbound Compliance blocked [MCAFEE-MEG-MIB :: smtp-blocked-compliancy-out : 1.3.6.1.4.1.1230.2.4.1.2.4.7.43.0] | |
| mcafee_gateway_smtp_BlockedVirusIn | Mcafee Gateway Smtp Blocked Virus In | count | Monitors the number of inbound viruses blocked [MCAFEE-MEG-MIB :: smtp-blocked-virus-in : 1.3.6.1.4.1.1230.2.4.1.2.4.6.46.0] | |
| mcafee_gateway_smtp_BlockedRblOut | Mcafee Gateway Smtp Blocked Rbl Out | count | Monitors the total number of blocked outbound e-mail messages due to RBL checks [MCAFEE-MEG-MIB :: smtp-blocked-rbl-out : 1.3.6.1.4.1.1230.2.4.1.2.4.7.25.0] | |
| mcafee_gateway_smtp_DetectPackers | Mcafee Gateway Smtp Detect Packers | count | Monitors the total number of packers detected [MCAFEE-MEG-MIB :: smtp-detect-packers : 1.3.6.1.4.1.1230.2.4.1.2.4.3.30.0] | |
| mcafee_gateway_smtp_BlockedRblIn | Mcafee Gateway Smtp Blocked Rbl In | count | Monitors the total number of blocked inbound e-mail messages due to RBL checks [MCAFEE-MEG-MIB :: smtp-blocked-rbl-in : 1.3.6.1.4.1.1230.2.4.1.2.4.6.25.0] | |
| mcafee_gateway_smtp_DetectPupsInScannerMcafee | Mcafee Gateway Smtp Detect Pups In Scanner Mcafee | count | Monitors the number of PUPs detected from outside by the McAfee AV engine [MCAFEE-MEG-MIB :: smtp-detect-pups-in-scanner-mcafee : 1.3.6.1.4.1.1230.2.4.1.2.4.4.29.1.1.0] | |
| mcafee_gateway_smtp_DetectPupsOutScannerMcafee | Mcafee Gateway Smtp Detect Pups Out Scanner | count | Monitors the number of PUPs detected from inside by the McAfee AV engine [MCAFEE-MEG-MIB :: smtp-detect-pups-out-scanner-mcafee : 1.3.6.1.4.1.1230.2.4.1.2.4.5.29.1.1.0] |
Mcafee Email Gateway (MEG) - System
Description
Template to monitor Mcafee Gateway system parameters like Uptime , Cpu Busy , Memory Percent Used , Memory Free , Memory Total , Memory Swap Percent Used , Fs Deferred Percent Dused , Fs Deferred Dfree , Fs Deferred Dtotal , Fs Deferred Percent Iused , Fs Deferred Ifree , Fs Deferred Itotal , Fs Quarantine Percent Dused , Fs Quarantine Dfree , Fs Quarantine Dtotal , Fs Quarantine Percent Iused , Fs Quarantine Ifree , Fs Quarantine Itotal , Fs Scandir Percent Dused , Fs Scandir Dfree , Fs Scandir Dtotal , Fs Scandir Percent Iused , Fs Scandir Ifree , Fs Scandir Itotal , Fs Logs Percent Dused , Fs Logs Dfree , Fs Logs Dtotal , Fs Logs Percent Iused , Fs Logs Ifree , Fs Logs Itotal , Fs VarPercent Dused , Fs Var Dfree , Fs Var Dtotal , Fs Var Percent Iused , Fs Var Ifree , Fs Var Itotal , Fs Wk Percent Dused , Fs Wk Dfree , Fs Wk Dtotal , Fs Wk Percent Iused , Fs Wk Ifree , FsWk Itotal
Prerequisites
No prerequisite
Supported Metric
| Monitor Name | Metric Name | Metric Display Name | Unit | Description |
|---|---|---|---|---|
| Mcafee Email Gateway - System | mcafee_gateway_system_FsScandirIfree | Mcafee Gateway System Fs Scandir Ifree | KB | Monitors the scandir partition files free [MCAFEE-MEG-MIB :: fs-scandir-ifree : 1.3.6.1.4.1.1230.2.4.1.2.3.1.27.0] |
| mcafee_gateway_system_FsLogsPercentDused | Mcafee Gateway System Fs Logs Percent Dused | % | Monitors the percentage of used disk space on Logging partition [MCAFEE-MEG-MIB :: fs-logs-percent-dused : 1.3.6.1.4.1.1230.2.4.1.2.3.1.29.0] | |
| mcafee_gateway_system_FsScandirPercentDused | Mcafee Gateway System_Fs Scandir Percent Dused | % | Monitors the percentage of used disk space on Scandir partition [MCAFEE-MEG-MIB :: fs-scandir-percent-dused : 1.3.6.1.4.1.1230.2.4.1.2.3.1.23.0] | |
| mcafee_gateway_system_FsDeferredPercentIused | Mcafee Gateway System Fs Deferred Percent Iused | % | Monitors the percentage of files used on Deferred partition [MCAFEE-MEG-MIB :: fs-deferred-percent-iused : 1.3.6.1.4.1.1230.2.4.1.2.3.1.14.0] | |
| mcafee_gateway_system_MemPercentUsed | Mcafee Gateway System Mem Percent Used | % | Displays the percentage of the processor memory usage [MCAFEE-MEG-MIB :: mem-percent-used : 1.3.6.1.4.1.1230.2.4.1.2.3.1.4.0] | |
| mcafee_gateway_system_MemSwapPercentUsed | Mcafee Gateway System Mem Swap Percent Used | % | Displays the percentage of processor memory swap usage [MCAFEE-MEG-MIB :: mem-swap-percent-used : 1.3.6.1.4.1.1230.2.4.1.2.3.1.9.0] | |
| mcafee_gateway_system_FsLogsItotal | Mcafee Gateway System Fs Logs Itotal | KB | Monitors the logging partition total files [MCAFEE-MEG-MIB :: fs-logs-itotal : 1.3.6.1.4.1.1230.2.4.1.2.3.1.34.0] | |
| mcafee_gateway_system_FsVarPercentIused | Mcafee Gateway System Fs Var Percent Iused | % | Monitors the percentage of files used on VAR partition [MCAFEE-MEG-MIB :: fs-var-percent-iused : 1.3.6.1.4.1.1230.2.4.1.2.3.1.38.0] | |
| mcafee_gateway_system_FsWkPercentIused | Mcafee Gateway System Fs Wk Percent Iused | % | Monitors the percentage of files used on Working partition [MCAFEE-MEG-MIB :: fs-wk-percent-iused : 1.3.6.1.4.1.1230.2.4.1.2.3.1.44.0] | |
| mcafee_gateway_system_FsDeferredItotal | Mcafee Gateway System Fs Deferred Itotal | KB | Monitors the deferred partition total files [MCAFEE-MEG-MIB :: fs-deferred-itotal : 1.3.6.1.4.1.1230.2.4.1.2.3.1.16.0] | |
| mcafee_gateway_system_FsQuarantinePercentIused | Mcafee Gateway System Fs Quarantine Percent Iused | % | Monitors the percentage of used free on Quarantine partition [MCAFEE-MEG-MIB :: fs-quarantine-percent-iused : 1.3.6.1.4.1.1230.2.4.1.2.3.1.20.0] | |
| mcafee_gateway_system_FsWkIfree | Mcafee Gateway System Fs Wk Ifree | KB | Monitors the working partition files free [MCAFEE-MEG-MIB :: fs-wk-ifree : 1.3.6.1.4.1.1230.2.4.1.2.3.1.45.0] | |
| mcafee_gateway_system_FsQuarantinePercentDused | Mcafee Gateway System Fs Quarantine Percent Dused | % | Monitors the percentage of used disk space on quarantine partition [MCAFEE-MEG-MIB :: fs-quarantine-percent-dused : 1.3.6.1.4.1.1230.2.4.1.2.3.1.17.0] | |
| mcafee_gateway_system_FsVarDtotal | Mcafee Gateway System Fs Var Dtotal | KB | Monitors the VAR partition total disk space [MCAFEE-MEG-MIB :: fs-var-dtotal : 1.3.6.1.4.1.1230.2.4.1.2.3.1.37.0] | |
| mcafee_gateway_system_FsDeferredDfree | Mcafee Gateway System Fs Deferred Dfree | KB | Monitors the deferred partition free disk space [MCAFEE-MEG-MIB :: fs-deferred-dfree : 1.3.6.1.4.1.1230.2.4.1.2.3.1.12.0] | |
| mcafee_gateway_system_FsScandirDtotal | Mcafee Gateway System Fs Scandir Dtotal | KB | Monitors the scandir partition total disk space [MCAFEE-MEG-MIB :: fs-scandir-dtotal : 1.3.6.1.4.1.1230.2.4.1.2.3.1.25.0] | |
| mcafee_gateway_system_MemCached | Mcafee Gateway System Mem Cached | KB | Displays the processor memory cache [MCAFEE-MEG-MIB :: mem-cached : 1.3.6.1.4.1.1230.2.4.1.2.3.1.8.0] | |
| mcafee_gateway_system_FsQuarantineIfree | Mcafee Gateway System Fs Quarantine Ifree | KB | Monitors the quarantine partition files free [MCAFEE-MEG-MIB :: fs-quarantine-ifree : 1.3.6.1.4.1.1230.2.4.1.2.3.1.21.0] | |
| mcafee_gateway_system_FsVarDfree | Mcafee Gateway System Fs Var Dfree | KB | Monitors the VAR partition free disk space [MCAFEE-MEG-MIB :: fs-var-dfree : 1.3.6.1.4.1.1230.2.4.1.2.3.1.36.0] | |
| mcafee_gateway_system_FsLogsDtotal | Mcafee Gateway System Fs Logs Dtotal | KB | Monitors the logging partition total disk space [MCAFEE-MEG-MIB :: fs-logs-dtotal : 1.3.6.1.4.1.1230.2.4.1.2.3.1.31.0] | |
| mcafee_gateway_system_FsDeferredDtotal | Mcafee Gateway System Fs Deferred Dtotal | KB | Monitors the deferred partition total disk space [MCAFEE-MEG-MIB :: fs-deferred-dtotal : 1.3.6.1.4.1.1230.2.4.1.2.3.1.13.0] | |
| mcafee_gateway_system_FsQuarantineItotal | Mcafee Gateway System Fs Quarantine Itotal | KB | Monitors the quarantine partition total files [MCAFEE-MEG-MIB :: fs-quarantine-itotal : 1.3.6.1.4.1.1230.2.4.1.2.3.1.22.0] | |
| mcafee_gateway_system_FsLogsDfree | Mcafee Gateway System Fs Logs Dfree | KB | Monitors the logging partition free disk space [MCAFEE-MEG-MIB :: fs-logs-dfree : 1.3.6.1.4.1.1230.2.4.1.2.3.1.30.0] | |
| mcafee_gateway_system_FsScandirDfree | Mcafee Gateway System Fs Scandir Dfree | KB | Monitors the scandir partition free disk space [MCAFEE-MEG-MIB :: fs-scandir-dfree : 1.3.6.1.4.1.1230.2.4.1.2.3.1.24.0] | |
| mcafee_gateway_system_FsScandirItotal | Mcafee Gateway System Fs Scandir Itotal | KB | Monitors the scandir partition total files [MCAFEE-MEG-MIB :: fs-scandir-itotal : 1.3.6.1.4.1.1230.2.4.1.2.3.1.28.0] | |
| mcafee_gateway_system_CpuBusy | Mcafee Gateway System Cpu Busy | % | Monitors the overall usage of one or more processors [MCAFEE-MEG-MIB :: cpu-busy : 1.3.6.1.4.1.1230.2.4.1.2.3.1.3.0] | |
| mcafee_gateway_system_FsQuarantineDfree | Mcafee Gateway System Fs Quarantine Dfree | KB | Monitors the quarantine partition free disk space [MCAFEE-MEG-MIB : fs-quarantine-dfree : 1.3.6.1.4.1.1230.2.4.1.2.3.1.18.0] | |
| mcafee_gateway_system_FsDeferredPercentDused | Mcafee Gateway System Fs Deferred Percent Dused | % | Monitors the percentage of used disk space on deferred partition [MCAFEE-MEG-MIB :: fs-deferred-percent-dused : 1.3.6.1.4.1.1230.2.4.1.2.3.1.11.0] | |
| mcafee_gateway_system_MemFree | Mcafee Gateway System Mem Free | KB | Displays the processor memory free [MCAFEE-MEG-MIB :: mem-free : 1.3.6.1.4.1.1230.2.4.1.2.3.1.7.0] | |
| mcafee_gateway_system_FsQuarantineDtotal | Mcafee Gateway System Fs Quarantine Dtotal | KB | Monitors the quarantine partition total disk space [MCAFEE-MEG-MIB :: fs-quarantine-dtotal : 1.3.6.1.4.1.1230.2.4.1.2.3.1.19.0] | |
| mcafee_gateway_system_FsWkDtotal | Mcafee Gateway System Fs Wk Dtotal | KB | Monitors the working partition total disk space [MCAFEE-MEG-MIB :: fs-wk-dtotal : 1.3.6.1.4.1.1230.2.4.1.2.3.1.43.0] | |
| mcafee_gateway_system_FsLogsPercentIused | Mcafee Gateway System Fs Logs Percent Iused | % | Monitors the percentage of files used on Logging partition [MCAFEE-MEG-MIB :: fs-logs-percent-iused : 1.3.6.1.4.1.1230.2.4.1.2.3.1.32.0] | |
| mcafee_gateway_system_FsDeferredIfree | Mcafee Gateway System Fs Deferred Ifree | KB | Monitors the deferred partition files free [MCAFEE-MEG-MIB :: fs-deferred-ifree : 1.3.6.1.4.1.1230.2.4.1.2.3.1.15.0] | |
| mcafee_gateway_system_FsLogsIfree | Mcafee Gateway System Fs Logs Ifree | KB | Monitors the logging partition files free [MCAFEE-MEG-MIB :: fs-logs-ifree : 1.3.6.1.4.1.1230.2.4.1.2.3.1.33.0] | |
| mcafee_gateway_system_FsWkPercentDused | Mcafee Gateway System Fs Wk Percent Dused | % | Monitors the percentage of used disk space on Working partition [MCAFEE-MEG-MIB :: fs-wk-percent-dused : 1.3.6.1.4.1.1230.2.4.1.2.3.1.41.0] | |
| mcafee_gateway_system_FsScandirPercentIused | Mcafee Gateway System Fs Scandir Percent Iused | % | Monitors the percentage of files used on Scandir partition [MCAFEE-MEG-MIB :: fs-scandir-percent-iused : 1.3.6.1.4.1.1230.2.4.1.2.3.1.26.0] | |
| mcafee_gateway_system_FsWkItotal | Mcafee Gateway System FsWk Itotal | KB | Monitors the working partition total files [MCAFEE-MEG-MIB :: fs-wk-itotal : 1.3.6.1.4.1.1230.2.4.1.2.3.1.46.0] | |
| mcafee_gateway_system_FsVarPercentDused | Mcafee Gateway System_Fs VarPercent Dused | % | Monitors the percentage of used disk space on VAR partition [fs-var-percent-dused : fs-var-percent-dused : 1.3.6.1.4.1.1230.2.4.1.2.3.1.35.0] | |
| mcafee_gateway_system_FsWkDfree | Mcafee Gateway System Fs Wk Dfree | KB | Monitors the working partition free disk space [MCAFEE-MEG-MIB :: fs-wk-dfree : 1.3.6.1.4.1.1230.2.4.1.2.3.1.42.0] | |
| mcafee_gateway_system_FsVarIfree | Mcafee Gateway System Fs Var Ifree | KB | Monitors the VAR partition files free [MCAFEE-MEG-MIB :: fs-var-ifree : 1.3.6.1.4.1.1230.2.4.1.2.3.1.39.0] | |
| mcafee_gateway_system_FsVarItotal | Mcafee Gateway System Fs Var Itotal | KB | Monitors the VAR partition total files [MCAFEE-MEG-MIB :: fs-var-itotal : 1.3.6.1.4.1.1230.2.4.1.2.3.1.40.0] |
Mcafee NSP
Description
Monitors McAfee NSP (Network Security Platform) sensor health, performance statistics, chassis modules (fan, power, temperature) status and sensor packets count that have been sent/received with bad CRC on interface ports.
Prerequisites
No prerequisite
Supported Metric
| Monitor Name | Metric Name | Metric Display Name | Unit | Description |
|---|---|---|---|---|
| McAfee NSP Sensor Monitoring | mcafee.nsp.sensor.avg.tcp.and.udp.flows | NSP Sensor TCP and UDP Flows Average Utilization | % | Gives the average percentage of the used TCP and UDP flows across all PEs. [OID: 1.3.6.1.4.1.8962.2.1.3.1.1.6.1.1.2] |
| mcafee.nsp.sensor.avg.ip.fragment.flows | NSP Sensor IP Fragment Flows Average Utilization | % | Gives the average percentage of the used IP Fragment flows across all PEs. [OID: 1.3.6.1.4.1.8962.2.1.3.1.1.6.1.3.2] | |
| mcafee.nsp.sensor.avg.icmp.flow | NSP Sensor ICMP Flows Average Utilization | % | Gives average percentage of the used ICMP flows across all PEs. [OID: 1.3.6.1.4.1.8962.2.1.3.1.1.6.1.5.2] | |
| mcafee.nsp.sensor.avg.ssl.flow | NSP Sensor SSL Flows Average Utilization | % | Gives the average percentage of the used SSL flows across all PEs. [OID: 1.3.6.1.4.1.8962.2.1.3.1.1.6.1.7.2] | |
| mcafee.nsp.sensor.avg.fragment.reassembly.buffer | NSP Sensor Fragment Reassembly Buffers Average Utilization | % | Gives the average percentage of the used fragment reassembly buffers across all PEs. [OID: 1.3.6.1.4.1.8962.2.1.3.1.1.6.1.9.2] | |
| mcafee.nsp.sensor.avg.packet.buffer | NSP Sensor Packet Buffers Average Utilization | % | Gives the average percentage of the used packet buffers across all PEs. [OID: 1.3.6.1.4.1.8962.2.1.3.1.1.6.1.11.2] | |
| mcafee.nsp.sensor.avg.attack.marker.nodes | NSP Sensor Attack Marker Nodes Average Utilization | % | Gives the average percentage of the used attack marker nodes across all PEs. [OID: 1.3.6.1.4.1.8962.2.1.3.1.1.6.1.13.2] | |
| mcafee.nsp.sensor.avg.shell.marker.nodes | NSP Sensor Shell Marker Nodes Average Utilization | % | Gives the average percentage of the used shell marker nodes across all PEs. [OID: 1.3.6.1.4.1.8962.2.1.3.1.1.6.1.15.2] | |
| mcafee.nsp.primary.power.supply.status | NSP Primary Power Supply Status | Gives the present state of the primary power supply. Possible values are not-present (0), present-operational (1), present-nonoperational (2). | ||
| mcafee.nsp.secondary.power.supply.status | NSP Secondary Power Supply Status | Gives the present status of the secondary power supply. Possible values are not-present (0), present-operational (1), present-nonoperational (2). [OID: 1.3.6.1.4.1.8962.2.1.2.1.7.4.0] | ||
| mcafee.nsp.fan.status | NSP Sensor Fan Status | Gives the present state of the fan status. Possible values are normal (0), abnormal (1). [OID: 1.3.6.1.4.1.8962.2.1.2.1.7.2.0] | ||
| mcafee.nsp.temperature.status | NSP Sensor Temperature Status | Gives the present state of the temperature status. Possible values are normal (0), abnormal (1). [OID: 1.3.6.1.4.1.8962.2.1.2.1.7.1.0] | ||
| mcafee.nsp.sensor.avg.load | NSP Sensor Average Load | % | Provides average percentage utilization of the sensor processors. [OID: 1.3.6.1.4.1.8962.2.1.3.1.1.5.1.1.2] | |
| mcafee.nsp.number.of.malwares.blocked | NSP Blocked Malwares Count | Provides number of malwares blocked. [OID: 1.3.6.1.4.1.8962.2.1.3.1.1.8.1.5.2] | ||
| mcafee.nsp.malware.protocol.error | NSP Malware Protocol Errors Count | Provides protocol errors count. Nameserver returned malformed reply is called protocol error. [OID: 1.3.6.1.4.1.8962.2.1.3.1.1.8.1.10.2] | ||
| mcafee.nsp.malware.out.of.memory.error | NSP Malware Out of Memory Errors Count | Provides out of memory errors count while processing request. [OID: 1.3.6.1.4.1.8962.2.1.3.1.1.8.1.13.2] | ||
| mcafee.nsp.sensor.health | NSP Sensor Health Status | Provides the health of the sensor. uninitialized means that the sensor does not have signatures hence does not detect attacks. Possible values are bad (0), good (1), uninitialized(2). [OID: 1.3.6.1.4.1.8962.2.1.2.1.1.13.0] | ||
| mcafee.nsp.sensor.crcerror.pkts.out | NSP Sensor Bad CRC Packets Sent Count | Provides total count of packets that have been sent with bad CRC. [OID: 1.3.6.1.4.1.8962.2.1.3.1.1.3.1.12.2] | ||
| mcafee.nsp.sensor.crcerror.pkts.in | NSP Sensor Bad CRC Packets Received Count | Provides total count of packets that have been received with bad CRC. [OID: 1.3.6.1.4.1.8962.2.1.3.1.1.3.1.6.2] |
McAfee Web Gateway Performance Check - G2
Description
This template assesses the overall performance of McAfee Web Gateway installed on a Linux/Unix based computer.
Prerequisites
No prerequisite
Supported Metric
| Monitor Name | Metric Name | Metric Display Name | Unit | Description |
|---|---|---|---|---|
| McAfee Web Gateway Performance Check | mcafee.http.traffic.clienttoproxy | HTTP - Client to Proxy | It monitors the change in number of bytes transferred from client to proxy using the HTTP protocol. [OID:1.3.6.1.4.1.1230.2.7.2.2.3 ] | |
| mcafee.http.traffic.proxytoclient | HTTP - Proxy to Client | This monitors the change in no.of bytes transferred from Proxy to Client using HTTP protocol. [OID: 1.3.6.1.4.1.1230.2.7.2.2.5] | ||
| mcafee.https.traffic.clienttoproxy | HTTPS - Client to Proxy | Monitors the Change in number of bytes transferred from client(s) to proxy using the HTTPS protocol. [OID: 1.3.6.1.4.1.1230.2.7.2.3.3] | ||
| mcafee.https.traffic.proxytoserver | HTTPS - Proxy to Server | Monitors the change in number of bytes transferred from proxy to server(s) and proxy using the HTTPS protocol. [OID: ] | ||
| mcafee.cpu.load | CPU Utilization | % | Current overall CPU usage in percent. [OID: 1.3.6.1.4.1.1230.2.7.2.5.1] | |
| mcafee.connected.sockets | Network sockets in use by the proxy | Number of open network sockets in use by the proxy. [OID: 1.3.6.1.4.1.1230.2.7.2.5.3] | ||
| mcafee.ftp.traffic.clienttoproxy | FTP - Client to Proxy | Monitors the change in number of bytes transferred from Client to Proxy using FTP protocol. [OID: 1.3.6.1.4.1.1230.2.7.2.4.2] | ||
| mcafee.ftp.traffic.proxytoclient | FTP - Proxy to Client | Monitors the change in number of bytes transferred from proxy to client(s) using the FTP protocol. [OID: 1.3.6.1.4.1.1230.2.7.2.4.4] | ||
| mcafee.ftp.traffic.proxytoserver | FTP - Proxy to Server | Monitors the change in Number of bytes transferred from proxy to server(s) using the FTP protocol. [OID: 1.3.6.1.4.1.1230.2.7.2.4.5] | ||
| mcafee.ftp.traffic.servertoproxy | FTP - Server to Proxy | Monitors the change in number of bytes transferred from server(s) to proxy using the FTP protocol. [OID: 1.3.6.1.4.1.1230.2.7.2.4.3] | ||
| mcafee.http.traffic.proxytoserver | HTTP - Proxy to Server | Monitors the change in number of bytes transferred from proxy to server(s) using the HTTP protocol. [OID: 1.3.6.1.4.1.1230.2.7.2.2.6] | ||
| mcafee.http.traffic.servertoproxy | HTTP - Server to Proxy | Monitors the change in number of bytes transferred from server to proxy using the HTTP protocol. [OID: 1.3.6.1.4.1.1230.2.7.2.2.4 ] | ||
| mcafee.https.traffic.servertoproxy | HTTPS - Server to Proxy | Monitors the change in number of bytes transferred from server(s) to proxy using the HTTPS protocol. [OID: 1.3.6.1.4.1.1230.2.7.2.3.4 ] | ||
| mcafee.numberof.antimalware.blocked.connections | No.of Anti-Malware Blocked Connections | Monitors the change in number of connections blocked by Anti-Malware. [OID: 1.3.6.1.4.1.1230.2.7.2.1.4 ] | ||
| mcafee.numberof.blocked.connections | No.of Blocked Connections | Monitors the Change in number of blocked connections. [OID: 1.3.6.1.4.1.1230.2.7.2.1.5] | ||
| mcafee.connected.clients | No.of currently connected clients | Monitors the number of currently connected clients. [OID: 1.3.6.1.4.1.1230.2.7.2.5.2] | ||
| mcafee.ftp.traffic.between.proxyandserver | FTP - proxy and server | Monitors the change in number of bytes transmitted between proxy and server(s) using the FTP protocol. [OID: 1.3.6.1.4.1.1230.2.7.2.4.1] | ||
| mcafee.http.traffic.between.proxyandserver | HTTP - proxy and server | Monitors the change in number of bytes transferred between proxy and server(s) using the HTTP protocol. [OID: 1.3.6.1.4.1.1230.2.7.2.2.2] | ||
| mcafee.https.traffic.between.proxyandserver | HTTPS - proxy and server | Monitors the change in number of bytes transferred between proxy and server(s) using the HTTPS protocol. [OID: 1.3.6.1.4.1.1230.2.7.2.3.2] | ||
| mcafee.https.traffic.proxytoclient | HTTPS - Proxy to Client | Monitors the change in number of bytes transferred from proxy to client(s) and proxy using the HTTPS protocol. [OID: 1.3.6.1.4.1.1230.2.7.2.3.5] | ||
| mcafee.numberof.detected.infections | No.of Detected Infections | Monitors the change in number of infections detected by the McAfee Gateway Antimalware Engine. [OID: 1.3.6.1.4.1.1230.2.7.2.1.2] | ||
| mcafee.numberof.http.requests | No.of HTTP Requests | Monitors the change in number of HTTP Requests. [OID: 1.3.6.1.4.1.1230.2.7.2.2.1] | ||
| mcafee.numberof.https.requests | No.of HTTPS Requests | Monitors the change in number of HTTPS requests. [OID: 1.3.6.1.4.1.1230.2.7.2.3.1] | ||
| mcafee.numberof.mediafilter.blocked.connections | No.of Media Filter Blocked Connections | Monitors the change in number of connections that have been blocked by the Media-Type filter. [OID: 1.3.6.1.4.1.1230.2.7.2.1.6] | ||
| mcafee.numberof.notblocked.connections | No.of Not Blocked Connections | Monitors the change in number of Not Blocked Connections. [OID: 1.3.6.1.4.1.1230.2.7.2.1.3] | ||
| mcafee.numberof.urlfilter.blocked.connections | No.of URL Filter Blocked Connections | Monitors the change in the number of connections that have been blocked by the URL filter. [OID: 1.3.6.1.4.1.1230.2.7.2.1.7] | ||
| mcafee.numberof.urlfilter.detected.categories | No.of URL Filter Detected Categories | Monitors the change in number of categories detected by the URL filter. [OID: 1.3.6.1.4.1.1230.2.7.2.1.9] |
Mellonox Voltaire InfiniBand SMA Monitors
Description
[Using SMA-MIB.mib] It monitors the Voltaire InfiniBand Subnet Management Agent (SMA) System Module attributes like sysModuleState, sysModuleTempValue, sysModuleTempState, sysModuleRate, sysModulePowerConsumption and also monitors the state of a remote action. Tested on MellanoxVoltaire-4036E-Infiniband [SysObjID: 1.3.6.1.4.1.5206.1.24].
Prerequisites
No prerequisite
Supported Metric
| Monitor Name | Metric Name | Metric Display Name | Unit | Description |
|---|---|---|---|---|
| Voltaire InfiniBand SMA Remote Action State | vol.infiniband.sma.remote.state | Remote Action State | Querries the state of a remote action. [OIDs: 1.3.6.1.4.1.5206.2.7.0, 1.3.6.1.4.1.5206.2.8.0, 1.3.6.1.4.1.5206.2.9.0] | |
| Voltaire InfiniBand SMA System Module Monitors | vol.infiniband.sma.sys.module.state | Module State | State of the module. Possible values "1=>notPresent, 2=>ok, 3=>fault, 4=>dcFault, 5=>acFault, 6=>unknown, 7=>io-fault". [OID: 1.3.6.1.4.1.5206.3.29.1.6] | |
| vol.infiniband.sma.sys.module.temp.value | Module Temperature | C | A module holds multiple heat sensors. This metric holds the maximum temperature measured across the module. [OID: 1.3.6.1.4.1.5206.3.29.1.7] | |
| vol.infiniband.sma.sys.module.temp.state | Module Temperature Status | State of module according to temperature. Possible values are "1: alarm, 2: warning, 3: normal, 4: sensorFault, 5: notAvalible". [OID: 1.3.6.1.4.1.5206.3.29.1.8] | ||
| vol.infiniband.sma.sys.module.power.usage | Module Power Usage | W | The system DC power consumption is Watt. [OID: 1.3.6.1.4.1.5206.3.29.1.12] | |
| vol.infiniband.sma.sys.module.fan.rate | Module Fan Rate | The fan rate of the module. [OID: 1.3.6.1.4.1.5206.3.29.1.11] |
Memcached Availability and Connections
Note
This template will be deprecated soon.Description
Template to monitor the Memcached Availability and Connections attributes like Bytes, Current connections, Current items, Threads, Total items, Uptime.
Prerequisites
No prerequisite
Supported Metric
| Monitor Name | Metric Name | Metric Display Name | Unit | Description |
|---|---|---|---|---|
| Memcached Availability and Connections | memcache.threads | Memcache Threads | NULL | Number of threads used by the current Memcached server process. |
| memcache.total_items | Memcache Total Items | NULL | Total number of items stored by this server since it started. | |
| memcache.uptimes | Memcache Uptime | s | Number of seconds this server has been running. | |
| memcache.bytes | Memcache Bytes | Bytes | Current number of bytes used by this server to store items. | |
| memcache.curr_connections | Memcache Current Connections | NULL | Number of open connections to this server. | |
| memcache.curr_items | Memcache Current Items | NULL | Current number of items stored by the server. |
Memcached Inventory
Note
This template will be deprecated soon.Description
Template to monitor the Memcached Inventory attributes like Memcache slabs get hits rate Memcache slabs command set rate, Memcache Slabs Delete Hits Rate, Memcache Slabs Incr Hits Rate, Memcache Slabs Decrease Hits Rate, Memcache Slabs CAS Hits Rate, Memcache slabs CAS Bad Value Rate, Memcache Slabs Touch Hits Rate, Memcache Slabs Used Chunks Rate, Memcache Slabs Chunk Size, Memcache Slabs Chunks Per Page, Memcache Slabs Total Pages, Memcache Slabs Total Chunks, Memcache Slabs Used Chunks, Memcache Slabs Free Chunks, Memcache Slabs Free Chunks End, Memcache Slabs Memory Requested, Memcache Slabs Active Slabs, Memcache Slabs Total Memory Allocated.
Prerequisites
No prerequisite
Supported Metric
| Monitor Name | Metric Name | Metric Display Name | Unit | Description |
|---|---|---|---|---|
| Memcached Inventory | memcache.slabs.cas_badval_rate | Memcache slabs CAS Bad Value Rate | s | Rate at which CAS commands failed to modify a value due to a bad CAS id |
| memcache.slabs.chunk_size | Memcache Slabs Chunk Size | Bytes | The amount of space each chunk uses | |
| memcache.slabs.decr_hits_rate | Memcache Slabs Decrease Hits Rate | s | Rate at which decrease commands modified this slab class | |
| memcache.slabs.cas_hits_rate | Memcache Slabs CAS Hits Rate | s | Rate at which CAS commands modified this slab class | |
| memcache.slabs.delete_hits_rate | Memcache Slabs Delete Hits Rate | s | Rate at which delete commands succeeded in this slab class | |
| memcache.slabs.used_chunks | Memcache Slabs Used Chunks | NULL | How many chunks have been allocated to items | |
| memcache.slabs.touch_hits_rate | Memcache Slabs Touch Hits Rate | s | Rate of touches serviced by this slab class | |
| memcache.slabs.total_mallocated | Memcache Slabs Total Memory Allocated | Bytes | Total amount of memory allocated to slab pages | |
| memcache.slabs.total_pages | Memcache Slabs Total Pages | NULL | Total number of pages allocated to the slab class | |
| memcache.slabs.free_chunks | Memcache Slabs Free Chunks | NULL | Chunks not yet allocated to items or freed via delete | |
| memcache.slabs.free_chunks_end | Memcache Slabs Free Chunks End | NULL | Number of free chunks at the end of the last allocated page | |
| memcache.slabs.incr_hits_rate | Memcache Slabs Incr Hits Rate | s | Rate at which incrs commands modified this slab class | |
| memcache.slabs.cmd_set_rate | Memcache Slabs Command Set Rate | s | Rate at which set requests stored data in this slab class | |
| memcache.slabs.used_chunks_rate | Memcache Slabs Used Chunks Rate | s | Rate at which chunks have been allocated to items | |
| memcache.slabs.total_chunks | Memcache Slabs Total Chunks | NULL | Total number of chunks allocated to the slab class | |
| memcache.slabs.get_hits_rate | Memcache Slabs Get Hits Rate | s | Rate at which get requests were serviced by this slab class | |
| memcache.slabs.active_slabs | Memcache Slabs Active Slabs | NULL | Total number of slab classes allocated | |
| memcache.slabs.mem_requested | Memcache Slabs Memory Requested | Bytes | Number of bytes requested to be stored in this slab | |
| memcache.slabs.chunks_per_page | Memcache Slabs Chunks Per Page | NULL | How many chunks exist within one page |
Memcached Performance
Note
This template will be deprecated soon.Description
Template to monitor the Memcached Performance attributes like Bytes read rate, Bytes written rate, Cas Badval Rate, Cas Hit Rate, Cas Misses Rate, Command Flush Rate, Command Get Rate, Command Put Rate, Connection Structures, Delete Hits Rate, Delete Misses Rate, Evictions Rate, Fill Percentage, Get Hit Percentage, Get Hits Rate, Get Misses Rate, Listen Disabled Number Rate, Rusage System Rate, Rusage User Rate, Total Connections Rate, Items Evicted Rate, Items Evicted Nonzero Rate, Items Expired Unfected Rate, Items Evicted Unfetched Rate, Items Out of Memory Rate, Items Tailrepairs Rate, Items Reclaimed Rate, Items Number, Items Age, Items Evicted Time.
Prerequisites
No prerequisite
Supported Metric
| Monitor Name | Metric Name | Metric Display Name | Unit | Description |
|---|---|---|---|---|
| Memcached Performance | memcache.get_hit_percent | Memcache Get hit Percentage | % | Memcache Get hit percentage |
| memcache.items.evicted_nonzero_rate | Memcache Items Evicted Nonzero Rate | s | Rate at which nonzero items which had an explicit expire time set had to be evicted from the LRU before expiring | |
| memcache.rusage_system_rate | memcached-performance | NULL | Fraction of user time the CPU spent executing this server process. | |
| memcache.listen_disabled_num_rate | Memcache Disabled Number Rate | s | Rate at which the server has reached the max connection limit. | |
| memcache.items.evicted_rate | Memcache Items Evicted Rate | s | Rate st which items had to be evicted from the LRU before expiring | |
| memcache.items.tailrepairs_rate | Memcache Items Tailrepairs Rate | s | Rate at which memcache self-healed a slab with a refcount leak | |
| memcache.items.evicted_time | Memcache Items Evicted Time | s | Seconds since the last access for the most recent item evicted from this class | |
| memcache.connection_structures | Memcache Connection Structures | NULL | Number of connection structures allocated by the server. | |
| memcache.cas_hits_rate | Memcache Hits Rate | s | Rate at which keys are compared and swapped and found present. | |
| memcache.cas_badval_rate | Memcache Bad Value Rate | s | Rate at which keys are compared and swapped where the comparison (original) value did not match the supplied value. | |
| memcache.delete_misses_rate | Memcache Delete Misses Rate | s | Rate at which delete commands result in no items being removed. | |
| memcache.bytes_read_rate | Memcache Bytes Read Rate | NULL | Rate of bytes read from the network by this server. | |
| memcache.cmd_set_rate | Memcache Command Set Rate | s | Memcache command set rate | |
| memcache.items.number | Memcache Items Number | NULL | Number of items presently stored in this slab class | |
| memcache.fill_percent | Memcache Fill Percentage | % | Amount of memory being used by the server for storing items as a percentage of the max allowed. | |
| memcache.delete_hits_rate | Memcache Delete Hits Rate | s | Rate at which delete commands result in items being removed. | |
| memcache.items.evicted_unfetched_rate | Memcache Items Evicted UnFetched Rate | psec | Rate at which valid items evicted from the LRU which were never touched after being set. | |
| memcache.cmd_flush_rate | Memcache Command Flush Rate | s | Rate of "flush_all" commands. | |
| memcache.items.expired_unfetched_rate | Memcache Items Expired Unfetched Rate | s | Rate at which expired items reclaimed from the LRU which were never touched after being set. | |
| memcache.cmd_get_rate | Memcache Command Get Rate | s | Rate of "get" commands. | |
| memcache.rusage_user_rate | Memcache Rusage User Rate | NULL | Fraction of time the CPU spent executing kernel code on behalf of this server process. | |
| memcache.cas_misses_rate | Memcache Misses Rate | s | Rate at which keys are compared and swapped and not found present. | |
| memcache.items.reclaimed_rate | Memcache Items Reclaimed Rate | s | Rate at which entries were stored using memory from an expired entry. | |
| memcache.items.outofmemory_rate | Memcache Items Out of Memory Rate | s | Rate at which the underlying slab class was unable to store a new item. | |
| memcache.get_hits_rate | Memcache Hits Rate | s | Rate at which keys are requested and found present. | |
| memcache.total_connections_rate | Memcache Total Connections Rate | NULL | Rate at which connections to this server are opened. | |
| memcache.items.age | Memcache Items Age | s | Age of the oldest item in the LRU | |
| memcache.get_misses_rate | Memcache Get Missed Rates | s | Rate at which keys are requested and not found. | |
| memcache.bytes_written_rate | Memcache Bytes Written Rate | Bps | Rate of bytes written to the network by this server. | |
| memcache.evictions_rate | Memcache Evictions Rate | s | Rate at which valid items are removed from cache to free memory for new items. |
Meraki Controller
Description
Monitors status of the device’s connection to the Meraki Cloud Controller.
Prerequisites
No prerequisite
Supported Metric
| Monitor Name | Metric Name | Metric Display Name | Unit | Description |
|---|---|---|---|---|
| Meraki Controller Device Connection Status | meraki.controller.dev.status | Device Connection Status | The status of the device's connection to the Meraki Cloud Controller [OID : 1.3.6.1.4.1.29671.1.1.4.1.3] | |
| meraki.controller.dev.connected.clients | Connected Clients | The amount of clients connected to this Access Point. [OID: 1.3.6.1.4.1.29671.1.1.4.1.5] | ||
| System Uptime | system.uptime | System Uptime | s | The time since the SNMP agent in the system was last re-initialized.[OID : 1.3.6.1.2.1.1.3.0] |
Meru - Wireless LAN Controller
Description
Template for Meru Wireless LAN Controllers. This template is applicable on Meru Controllers 1550, 3200, 4200 and 6000. Monitors WLAN availability status, AP availability status, AP throughput, AP total stations count and statistics for top 10 access points.
Prerequisites
No prerequisite
Supported Metric
| Monitor Name | Metric Name | Metric Display Name | Unit | Description |
|---|---|---|---|---|
| Meru - Access Point Availability Status | wlan.access.point.availability.status | Access Point Availability Status | This monitor tells the availability status of the APs connected to meru WLAN controller. Possible values are 1:PowerOff, 2:Offline , 3:Online ,4:Failed ,5:InTest and 6:NotInstalled. [OIDs: 1.3.6.1.4.1.15983.1.1.4.2.1.1.2, 1.3.6.1.4.1.15983.1.1.4.2.1.1.4, 1.3.6.1.4.1.15983.1.1.4.2.1.1.13, 1.3.6.1.4.1.15983.1.1.4.2.1.1.26,\n1.3.6.1.4.1.15983.1.1.4.2.1.1.27] | |
| Meru - Call Admission Control (CAC) AP statistics | wlan.call.admission.control.ap.active.calls | Call Admission Control(CAC) AP Active Calls | This is equivalent of the 'show statistics call-admission-control ap' command. It shows the current number of active calls. [OIDs: 1.3.6.1.4.1.15983.1.1.3.1.8.1.2, 1.3.6.1.4.1.15983.1.1.3.1.8.1.3] | |
| wlan.call.admission.control.ap.rejected.calls | Call Admission Control(CAC) AP Rejected Calls | This is equivalent of the 'show statistics call-admission-control ap' command. It shows the cumulative number of calls that have been rejected as a result of reaching the maximum number of calls setting for a given Access Point (AP). The cumulative number of rejected calls per AP are reset when the controller reboots and the AP reboots, respectively. [OIDs: 1.3.6.1.4.1.15983.1.1.3.1.8.1.2, 1.3.6.1.4.1.15983.1.1.3.1.8.1.4] | ||
| Meru - Call Admission Control (CAC) Base Station Subsystem Statistics | wlan.call.admission.control.bss.active.calls | Call Admission Control(CAC) BSS Active Calls | This is equivalent of the 'show statistics call-admission-control bss' command. It shows the current number of active calls on a Base Station Subsystem (BSS). [OIDs: 1.3.6.1.4.1.15983.1.1.3.1.9.1.2, 1.3.6.1.4.1.15983.1.1.3.1.9.1.3] | |
| wlan.call.admission.control.bss.rejected.calls | Call Admission Control(CAC) BSS Rejected Calls | This is equivalent of the 'show statistics call-admission-control bss' command. It shows the cumulative number of calls that have been rejected as a result of reaching the maximum number of calls setting on a Base Station Subsystem (BSS) . The cumulative number of rejected calls per BSS are reset when the controller reboots and the AP reboots, respectively. [OIDs: 1.3.6.1.4.1.15983.1.1.3.1.9.1.2, 1.3.6.1.4.1.15983.1.1.3.1.9.1.4] | ||
| Meru - Quality of Service Statistics | wlan.qos.sessions | Quality of Service Session Count | Provides Quality of service (QOS) session count. [OID: 1.3.6.1.4.1.15983.1.1.3.1.4.1] | |
| wlan.qos.sessions.rejected | Quality of Service Rejected Sessions | Provides Quality of service (QOS) rejected session count. [OID: 1.3.6.1.4.1.15983.1.1.3.1.4.5] | ||
| wlan.qos.sessions.pending | Quality of Service Pending Sessions | Provides Quality of service (QOS) pending session count. [OID: 1.3.6.1.4.1.15983.1.1.3.1.4.9] | ||
| Meru - Top 10 AP Station TxRX packets count | wlan.top.10.access.points.rx.packets | Top 10 Access Points Rx packets count | This is equivalent of the 'show statistics top10-station-talker' command. Displays the 10 most active stations,based on the sum of reception packet rates per minute during the last polling period. Provides the unique ID number, name, interface number and the MAC address of the Access Point (AP) to which the station is currently communicating and the number of packets received during the last polling period. [OID: 1.3.6.1.4.1.15983.1.1.3.2.2.1.2, 1.3.6.1.4.1.15983.1.1.3.2.2.1.5] | |
| wlan.top.10.access.points.tx.packets | Top 10 Access Points Tx packets count | This is equivalent of the 'show statistics top10-station-talker' command. Displays the 10 most active stations,based on the sum of transmission packet rates per minute during the last polling period. Provides the unique ID number, name, interface number and the MAC address of the Access Point (AP) to which the station is currently communicating and the number of packets transmitted during the last polling period. [OID: 1.3.6.1.4.1.15983.1.1.3.2.2.1.2, 1.3.6.1.4.1.15983.1.1.3.2.2.1.6] | ||
| Meru - Top 10 AP TxRx frames count | wlan.top.10.access.points.rx.frames | Top 10 Access Points Rx frames count | This is equivalent of the 'show statistics top10-ap-talker' command. Displays the 10 most active access points, based on the sum of reception packet rates per minute during the last polling period. Provides the unique ID number, name, interface number of the Access Point (AP) and the number of frames received during the last polling period. [OID: 1.3.6.1.4.1.15983.1.1.3.2.4.1.2, 1.3.6.1.4.1.15983.1.1.3.2.4.1.3, 1.3.6.1.4.1.15983.1.1.3.2.4.1.4, 1.3.6.1.4.1.15983.1.1.3.2.4.1.6] | |
| wlan.top.10.access.points.tx.frames | Top 10 Access Points Tx frames count | This is equivalent of the 'show statistics top10-ap-talker' command. Displays the 10 most active access points, based on the sum of transmission packet rates per minute during the last polling period. Provides the unique ID number, name, interface number of the Access Point (AP) and the number of frames transmitted during the last polling period. [OID: 1.3.6.1.4.1.15983.1.1.3.2.4.1.2, 1.3.6.1.4.1.15983.1.1.3.2.4.1.3, 1.3.6.1.4.1.15983.1.1.3.2.4.1.4, 1.3.6.1.4.1.15983.1.1.3.2.4.1.5] | ||
| Meru - Top 10 problem AP statistics | wlan.top.10.access.points.tx.packets.loss | Top 10 Access Points Tx Loss Percentage | % | Provides the unique ID number, name, interface number of the Access Point (AP). This is the result of the 'show statistics top10-ap-problem' command to display a list of the top problem access points. Ten access points with the highest number of packet retransmissions, with a minimum of 20% for transmissions are listed. It is based on the percentage of packets lost during transmission. [OID: 1.3.6.1.4.1.15983.1.1.3.2.3.1.2, 1.3.6.1.4.1.15983.1.1.3.2.3.1.5, 1.3.6.1.4.1.15983.1.1.3.2.3.1.4, 1.3.6.1.4.1.15983.1.1.3.2.3.1.3] |
| Meru - Total Wireless Stations | wlan.wireless.stations.count | Total Wireless Stations | It monitors the total wireless stations connected to all AP's. [OID: 1.3.6.1.4.1.15983.1.1.3.1.13.11.0 - mwSystemGeneralTotalWirelessStations] | |
| Meru - WLAN Availability Status | wlan.availability.status | WLAN Availability Status | This monitor tells the availability status Meru WLAN controller. Possible values are 1:PowerOff, 2:Offline , 3:Online ,4:Failed ,5:InTest and 6:NotInstalled. [OIDs: 1.3.6.1.4.1.15983.1.1.4.1.1.19, 1.3.6.1.4.1.15983.1.1.4.1.1.21, 1.3.6.1.4.1.15983.1.1.4.1.1.22] | |
| Meru - WLAN Throughput RX and TX | wlan.throughput.rx | WLAN Throughput RX | It monitors the Meru WLAN RX Throughput. [OIDs: 1.3.6.1.4.1.15983.1.1.3.1.16.7.0 - mwSystemThruputWlanRxThroughput] | |
| wlan.throughput.tx | WLAN Throughput TX | It monitors the Meru WLAN TX Throughput. [OIDs: 1.3.6.1.4.1.15983.1.1.3.1.16.8.0 - mwSystemThruputWlanTxThroughput] |
Microchip SyncServer S6x0 - Clock And NTP Stats
Description
Template to monitor the microchip syncserver s6x0 ntp and system statistics like leap indicator,stratum level,precision,root delay,root dispersion,peer name,packets received,sys mode,clock status,gnss receiver status,gnss position status.[S650::ntpSysLeap:1.3.6.1.4.1.9070.1.2.5.7.8.1.1.0,ntpSysStratum:1.3.6.1.4.1.9070.1.2.5.7.8.1.2.0,ntpSysPrecision:1.3.6.1.4.1.9070.1.2.5.7.8.1.3.0,ntpSysRootDelay:1.3.6.1.4.1.9070.1.2.5.7.8.1.4.0,ntpSysRootDispersion:1.3.6.1.4.1.9070.1.2.5.7.8.1.5.0,ntpSysPeer:1.3.6.1.4.1.9070.1.2.5.7.8.1.8.0,ntpSysPktsReceived:1.3.6.1.4.1.9070.1.2.5.7.8.1.9.0,ntpSysMode:1.3.6.1.4.1.9070.1.2.5.7.8.1.10.0,clockStatus:1.3.6.1.4.1.9070.1.2.5.7.8.3.1.0,gnssReceiverStatus:1.3.6.1.4.1.9070.1.2.5.7.8.4.2.0,gnssPositionStatus:1.3.6.1.4.1.9070.1.2.5.7.8.4.4.0]
Prerequisites
Device must have support for S650 mib.
Supported Metric
| Monitor Name | Metric Name | Metric Display Name | Metric Category | Unit | Description |
|---|---|---|---|---|---|
| Microchip SyncServer S6x0 - Clock And GNSS Stats | microchip_syncserver_s6x0_system_ClockStatus | Microchip SyncServer S6x0 System Clock Status | Availability | It monitors the system clock status.[S650::clockStatus:1.3.6.1.4.1.9070.1.2.5.7.8.3.1.0].Possible values are Warmup(0), Freerun(1), HandSet(2), FastLock(3), NormalLock(4), Bridging(5), Holdover(6), Holdover Extended(7), Holdover Recovery(8). | |
| microchip_syncserver_s6x0_system_GnssReceiverStatus | Microchip SyncServer S6x0 System GNSS Receiver Status | Availability | It monitors the Microchip SyncServer S6x0 System GNSS Receiver Status.[S650::gnssReceiverStatus:1.3.6.1.4.1.9070.1.2.5.7.8.4.2.0].Possible values are Invalid(0), Tracking No UTC(1), Tracking(2), Not Available(3). | ||
| microchip_syncserver_s6x0_system_GnssPositionStatus | Microchip SyncServer S6x0 System GNSS Position Status | Availability | It monitors the Microchip SyncServer S6x0 System GNSS Position Status.[S650::gnssPositionStatus:1.3.6.1.4.1.9070.1.2.5.7.8.4.4.0].Possible values are No Data(0), Survey 2D(1), Survey(2), Position Fix(3), Not Available(4). | ||
| Microchip SyncServer S6x0 - NTP System Stats | microchip_syncserver_s6x0_ntp_SysLeap | Microchip SyncServer S6x0 NTP System Leap | Availability | It monitors the NTP system leap indicator.[S650::ntpSysLeap:1.3.6.1.4.1.9070.1.2.5.7.8.1.1.0].Possible values are noWarning(0) , addSecond(1) , subtractSecond(2) , alarm(3) | |
| microchip_syncserver_s6x0_ntp_SysStratum | Microchip SyncServer S6x0 NTP System Stratum | Performance | It monitors the ntp system stratum level.[S650::ntpSysStratum:1.3.6.1.4.1.9070.1.2.5.7.8.1.2.0] | ||
| microchip_syncserver_s6x0_ntp_SysPrecision | Microchip SyncServer S6x0 NTP System Precision | Performance | It monitors the NTP system precision.[S650::ntpSysPrecision:1.3.6.1.4.1.9070.1.2.5.7.8.1.3.0] | ||
| microchip_syncserver_s6x0_ntp_SysRootDispersion | Microchip SyncServer S6x0 NTP System Root Dispersion | Performance | ms | It monitors the NTP system root dispersion.[S650::ntpSysRootDispersion:1.3.6.1.4.1.9070.1.2.5.7.8.1.5.0] | |
| microchip_syncserver_s6x0_ntp_SysPeer | Microchip SyncServer S6x0 NTP System Peer | Performance | It give the NTP system peer.[S650::ntpSysPeer:1.3.6.1.4.1.9070.1.2.5.7.8.1.8.0] | ||
| microchip_syncserver_s6x0_ntp_sys_pkts_received_RawCounter | Microchip SyncServer S6x0 NTP System Packets Received | Usage | count | It provides the NTP system packets received.[S650::ntpSysPktsReceived:1.3.6.1.4.1.9070.1.2.5.7.8.1.9.0] | |
| microchip_syncserver_s6x0_ntp_SysRootDelay | Microchip SyncServer S6x0 NTP System Root Delay | Performance | ms | It monitors the NTP system root delay.[S650::ntpSysRootDelay:1.3.6.1.4.1.9070.1.2.5.7.8.1.4.0] | |
| microchip_syncserver_s6x0_ntp_SysMode | Microchip SyncServer S6x0 NTP System Mode | Availability | It monitors the NTP system mode.[S650::ntpSysMode:1.3.6.1.4.1.9070.1.2.5.7.8.1.10.0].Possible values are unspec(0), sym_active(1), sym_passive(2), client, server(3),broadcast(4), control(5), private(6), bclient(7). | ||
| microchip_syncserver_s6x0_ntp_sys_pkts_received_CounterRate | Microchip SyncServer S6x0 NTP Packets Received Per Second | Usage | packets/sec | It provides the NTP system packets received per second.[S650::ntpSysPktsReceived:1.3.6.1.4.1.9070.1.2.5.7.8.1.9.0]. |
Microsemi Syncserver S650 - System Stats
Description
Template to monitor the symmetricom ntp system statistics like leap indicator,stratum level,precision,rootdelay,rootdispersion,peer name,PktsReceived,SysMode,clock status,GNSS receiver status,GNSS position status.[S650::ntpSysLeap:1.3.6.1.4.1.9070.1.2.5.7.8.1.1.0,ntpSysStratum:1.3.6.1.4.1.9070.1.2.5.7.8.1.2.0,ntpSysPrecision:1.3.6.1.4.1.9070.1.2.5.7.8.1.3.0,ntpSysRootDelay:1.3.6.1.4.1.9070.1.2.5.7.8.1.4.0,ntpSysRootDispersion:1.3.6.1.4.1.9070.1.2.5.7.8.1.5.0,ntpSysPeer:1.3.6.1.4.1.9070.1.2.5.7.8.1.8.0,ntpSysPktsReceived:1.3.6.1.4.1.9070.1.2.5.7.8.1.9.0,ntpSysMode:1.3.6.1.4.1.9070.1.2.5.7.8.1.10.0,clockStatus:1.3.6.1.4.1.9070.1.2.5.7.8.3.1.0,gnssReceiverStatus:1.3.6.1.4.1.9070.1.2.5.7.8.4.2.0,gnssPositionStatus:1.3.6.1.4.1.9070.1.2.5.7.8.4.4.0]
Prerequisites
Device must support S650 mib
Supported Metric
| Monitor Name | Metric Name | Metric Display Name | Unit | Description |
|---|---|---|---|---|
| Symmetricom NTP System Stats | symmetricom_ntp_SysLeap | Symmetricom NTP System Leap | It monitors the NTP system leap indicator.[S650::ntpSysLeap:1.3.6.1.4.1.9070.1.2.5.7.8.1.1.0] | |
| symmetricom_ntp_SysStratum | Symmetricom NTP System Stratum | It monitors the NTP system stratum level.[S650::ntpSysStratum:1.3.6.1.4.1.9070.1.2.5.7.8.1.2.0] | ||
| symmetricom_ntp_SysPrecision | Symmetricom NTP System Precision | It monitors the NTP system precision.[S650::ntpSysPrecision:1.3.6.1.4.1.9070.1.2.5.7.8.1.3.0] | ||
| symmetricom_ntp_SysRootDispersion | Symmetricom NTP System Root Dispersion | ms | It monitors the NTP system root dispersion.[S650::ntpSysRootDispersion:1.3.6.1.4.1.9070.1.2.5.7.8.1.5.0] | |
| symmetricom_ntp_SysPeer | Symmetricom NTP System Peer | It give the NTP system peer.[S650::ntpSysPeer:1.3.6.1.4.1.9070.1.2.5.7.8.1.8.0] | ||
| symmetricom_ntp_SysPktsReceived | Symmetricom NTP System Packets Received | count | It provides the NTP system packets received.[S650::ntpSysPktsReceived:1.3.6.1.4.1.9070.1.2.5.7.8.1.9.0] | |
| symmetricom_ntp_SysRootDelay | Symmetricom NTP System Root Delay | ms | It monitors the NTP system root delay.[S650::ntpSysRootDelay:1.3.6.1.4.1.9070.1.2.5.7.8.1.4.0] | |
| symmetricom_ntp_SysMode | Symmetricom NTP System Mode | It monitors the symmetricom NTP system mode.[S650::ntpSysMode:1.3.6.1.4.1.9070.1.2.5.7.8.1.10.0] | ||
| Symmetricom System Stats | symmetricom_system_ClockStatus | Symmetricom System Clock Status | It monitors the system clock status.[S650::clockStatus:1.3.6.1.4.1.9070.1.2.5.7.8.3.1.0] | |
| symmetricom_system_GnssReceiverStatus | Symmetricom System GNSS Receiver Status | It monitors the symmetricom system GNSS receiver status.[S650::gnssReceiverStatus:1.3.6.1.4.1.9070.1.2.5.7.8.4.2.0] | ||
| symmetricom_system_GnssPositionStatus | Symmetricom System GNSS Position Status | It monitors the symmetricom system GNSS position status.[S650::gnssPositionStatus:1.3.6.1.4.1.9070.1.2.5.7.8.4.4.0] |
MongoDB Performance Template - V2
Description
This version 2 template will be available from gateway 13.0.0 and later version of the classic gateway. Below are removed deprecated metrics from the version 1 template: 1.MongoDB OP Counters,2.MongoDB Traffic,3.mongo.journaled.status.write,4.MongoDB Index Size,5.MongoDB Size,6.MongoDB Journaled Status,7.MongoDB Memory,8.MongoDB Index Miss Ratio.
Prerequisites
No prerequisite
Supported Metric
| Monitor Name | Metric Name | Metric Display Name | Unit | Description |
|---|---|---|---|---|
| MongoDB Performance Monitor - v2 | mongo.currentqueue.writers | Mongo CurrentQueue Writers | count | Current writers in Queue |
| mongo.currentqueue.readers | Mongo CurrentQueue Readers | count | Current readers in Queue | |
| mongo.pagefaults | Mongo Page Faults | count | Number of page faults per second that require disk operations. | |
| mongo.cursors.timeout | Mongo Cursors Timeout | count | Number of cursors that time out,per second. | |
| mongo.network.requests | Mongo Network Requests | count | Number of network requests per second | |
| mongo.lock.percent | Mongo Lock Percent | % | Lock percentage | |
| mongo.replication.state | Mongo Replication State | NULL | Replication states will be the following cases: StartingPhase1(0),Primary(1),Secondary(2),Recoverying(3),Fatal Error(4),StartingPhase2(5),Arbiter(7),Down(8),Not_Running_with_Replication(-1) | |
| mongo.asserts.message | Mongo Asserts Message | count | Number of messages assertions per second | |
| mongo.asserts.rollovers | Mongo Asserts Rollovers | count | Number of rollovers assertions raised per second | |
| mongo.asserts.warning | Mongo Asserts Warning | count | Number of warnings raised per second. | |
| mongo.asserts.user | Mongo Asserts User | count | Number of user assertions raised per second. | |
| mongo.asserts.regular | Mongo Asserts Regular | count | Number of regular assertions raised per second | |
| mongo.avg.flush | Mongo Avg Flush | ms | Average time for each flush to disk. | |
| mongo.uptime | Mongo Uptime | m | Uptime in minutes | |
| mongo.cursors.client.size | Mongo Cursors Client Size | count | The number of cursors that the server is maintaining for clients | |
| mongo.cursors.open | Mongo Cursors Open | count | Number of cursors that MongoDB is maintaining for clients. | |
| mongo.active.clients.read | Mongo Active Clients Read | count | Count of the active client connections performing read operations. | |
| mongo.active.clients.write | Mongo Active Clients Write | count | Count of active client connections performing write operations | |
| mongo.opCounters.get | Mongo Opcounters Get | count | Number of get operations per second. | |
| mongo.opCounters.insert | Mongo Opcounters Insert | count | Number of insert operations per second. | |
| mongo.opCounters.command | Mongo opcounters command | count | Total number of commands per second issued to the database. | |
| mongo.opCounters.query | Mongo Opcounters Query | count | Total number of queries per second. | |
| mongo.opCounters.update | Mongo Opcounters Update | count | Number of update operations per second. | |
| mongo.opCounters.delete | MongoDB Opcounters Delete | count | Number of delete operations per second. | |
| mongo.connections.current | Mongo Connections Current | count | Number of connections to the database server from clients. | |
| mongo.connections.available | Mongo Connections Avaliable | NULL | Number of unused available incoming connections the database can provide. | |
| mongo.journal.commits | Mongo Journal Commits | count | Provides the number of journal commits that occurred in the write loc | |
| mongo.heap.usage | Mongo Heap Usage | Bytes | Heap Usage | |
| mongo.memory.resident | Mongo Memory Resident | GB | Amount of memory currently used by the database process. | |
| mongo.memory.virtual | Mongo Memory Virtual | GB | Amount of virtual memory used by the mongod process. | |
| mongo.memory.mapped | Mongo Memory Mapped | GB | Amount of mapped memory by the database. | |
| mongo.btree.access | Mongo Btree Access | count | Provides Index Counters details as Accesses | |
| mongo.btree.hits | Mongo Btree Hits | count | Provides Index Counters details as Hits | |
| mongo.btree.misses | Mongo Btree Misses | count | Provides Index Counters details as Misses | |
| mongo.btree.resets | Mongo BTree Resets | count | Provides Index Counters details as Resets | |
| mongo.btree.misses.ratio | Mongo BTree Misses Ratio | count | Provides Index Counters details as Miss_ratio | |
| mongo.replicaprimary | Mongo Replicaprimary | NULL | Check if the primary server of a replica set has changed | |
| mongo.active.clients | MongoDB Active Clients | count | Total number of active client connections to the database. | |
| mongo.current.queue | Mongo Current Queue | count | Current Queue | |
| mongo.cursors | Mongo Cursors | count | Total number of cursors for clients | |
| mongo.asserts.total | Mongo Asserts Total | count | Total number of assertions per second | |
| mongo.avg.flush.time | Mongo Avg Flush Time | ms | Number of times the database has flushed all writes to disk. | |
| mongo.last.flush.time | Mongo Last Flush Time | ms | Amount of time that the last flush operation took to complete. |
MRV - CMMC
Description
Template to monitor MRV CMMC chassis parameters like CMMC Chassis Power Supply1 Status,CMMC Chassis Power Supply2 Status,CMMC Chassis Power Supply3 Status,CMMC Chassis Power Supply4 Status,CMMC Chassis Fan1 Status,CMMC Chassis Fan2 Status,CMMC Chassis Fan3 Status,CMMC Chassis Fan4 Status,CMMC Chassis Temperature,CMMC Chassis Fan5 Status,CMMC Chassis Fan6 Status,CMMC Chassis Fan7 Status,CMMC Chassis Fan8 Status,CMMC Chassis Power Status,port parameters like Temperature,Tx Power,Rx Power,Bias Current,Voltage,Temperature Level,Tx Power level,Rx Power Level,Bias Current Level,Voltage Level,slot temperature.sysObjectID: 1.3.6.1.4.1.629.200.1.1.1,OD-NM,v5.13.1,Firmware : 20.1b,EM316
Prerequisites
Device should have support for NBS-CMMC-MIB.
Supported Metric
| Monitor Name | Metric Name | Metric Display Name | Unit | Description |
|---|---|---|---|---|
| MRV - CMMC Chassis | nbs.cmmc.chassis.powersupply1.status | CMMC Chassis Power Supply1 Status | It monitors the status of Power Supply 1. Possible values are 1: notInstalled,2: acBad,3: dcBad,4: acGood,5: dcGood,6: notSupported,7: good,8: bad.[NBS-CMMC-MIB::nbsCmmcChassisPS1Status:1.3.6.1.4.1.629.200.6.1.1.7]. | |
| nbs.cmmc.chassis.powersupply2.status | CMMC Chassis Power Supply2 Status | It monitors the status of Power Supply 2. Possible values are 1: notInstalled,2: acBad,3: dcBad,4: acGood,5: dcGood,6: notSupported,7: good,8: bad.[NBS-CMMC-MIB::nbsCmmcChassisPS2Status:1.3.6.1.4.1.629.200.6.1.1.8]. | ||
| nbs.cmmc.chassis.powersupply3.status | CMMC Chassis Power Supply3 Status | It monitors the status of Power Supply 3.Possible values are 1: notInstalled,2: acBad,3: dcBad,4: acGood,5: dcGood,6: notSupported,7: good,8: bad(8).[NBS-CMMC-MIB::nbsCmmcChassisPS3Status:1.3.6.1.4.1.629.200.6.1.1.9]. | ||
| nbs.cmmc.chassis.powersupply4.status | CMMC Chassis Power Supply4 Status | It monitors the status of Power Supply 4.Possible values are 1: notInstalled,2: acBad,3: dcBad,4: acGood,5: dcGood,6: notSupported,7: good,8: bad(8).[NBS-CMMC-MIB::nbsCmmcChassisPS4Status:1.3.6.1.4.1.629.200.6.1.1.10]. | ||
| nbs.cmmc.chassis.fan1.status | CMMC Chassis Fan1 Status | It monitors the status of Fan 1. Possible values are 1: notSupported,2: bad,3: good,4: notInstalled(4).[NBS-CMMC-MIB::nbsCmmcChassisFan1Status:1.3.6.1.4.1.629.200.6.1.1.11]. | ||
| nbs.cmmc.chassis.fan2.status | CMMC Chassis Fan2 Status | It monitors the status of Fan 2. Possible values are 1: notSupported,2: bad,3: good,4: notInstalled(4).[NBS-CMMC-MIB::nbsCmmcChassisFan2Status:1.3.6.1.4.1.629.200.6.1.1.12]. | ||
| nbs.cmmc.chassis.fan3.status | CMMC Chassis Fan3 Status | It monitors the status of Fan 3.Possible values are 1: notSupported,2: bad,3: good,4: notInstalled(4).[NBS-CMMC-MIB::nbsCmmcChassisFan3Status:1.3.6.1.4.1.629.200.6.1.1.13]. | ||
| nbs.cmmc.chassis.fan4.status | CMMC Chassis Fan4 Status | It monitors the status of Fan 4. Possible values are 1: notSupported,2: bad,3: good,4: notInstalled(4).[NBS-CMMC-MIB::nbsCmmcChassisFan4Status:1.3.6.1.4.1.629.200.6.1.1.14]. | ||
| nbs.cmmc.chassis.temperature | CMMC Chassis Temperature | Celsius | It monitors the temperature in celsius of the Chassis.[NBS-CMMC-MIB::nbsCmmcChassisTemperature:1.3.6.1.4.1.629.200.6.1.1.15]. | |
| nbs.cmmc.chassis.fan5.status | CMMC Chassis Fan5 Status | It monitors the status of Fan 5.Possible values are 1: notSupported,2: bad,3: good,4: notInstalled(4).[NBS-CMMC-MIB::nbsCmmcChassisFan5Status:1.3.6.1.4.1.629.200.6.1.1.36]. | ||
| nbs.cmmc.chassis.fan6.status | CMMC Chassis Fan6 Status | It monitors the status of Fan 6.Possible values are 1: notSupported,2: bad,3: good,4: notInstalled(4).[NBS-CMMC-MIB::nbsCmmcChassisFan6Status:1.3.6.1.4.1.629.200.6.1.1.37]. | ||
| nbs.cmmc.chassis.fan7.status | CMMC Chassis Fan7 Status | It monitors the status of Fan 7.Possible values are 1: notSupported,2: bad,3: good,4: notInstalled(4).[NBS-CMMC-MIB::nbsCmmcChassisFan7Status:1.3.6.1.4.1.629.200.6.1.1.38]. | ||
| nbs.cmmc.chassis.fan8.status | CMMC Chassis Fan8 Status | It monitors the status of Fan 8.Possible values are 1: notSupported,2: bad,3: good,4: notInstalled(4).[NBS-CMMC-MIB::nbsCmmcChassisFan8Status:1.3.6.1.4.1.629.200.6.1.1.39]. | ||
| nbs.cmmc.chassis.power.status | CMMC Chassis Power Status | It monitors whether the total power in the chassis is sufficient or insufficient.Insufficient means that the chassis won't work in a correct mode.Possible values are 1: notSupported,2: sufficient,3: insufficient(3).[NBS-CMMC-MIB::nbsCmmcChassisPowerStatus:1.3.6.1.4.1.629.200.6.1.1.51]. | ||
| MRV - CMMC Port | nbs.cmmc.port.temperature | CMMC Port Temperature | Celsius | It monitors the temperature (in degrees celsius) of this transceiver.[NBS-CMMC-MIB::nbsCmmcPortTemperature:1.3.6.1.4.1.629.200.8.1.1.30]. |
| nbs.cmmc.port.tx.power | CMMC Port Tx Power(milli dBm) | It monitors the output power (in milli dBm) of this transmitter.[NBS-CMMC-MIB::nbsCmmcPortTxPower:1.3.6.1.4.1.629.200.8.1.1.31]. | ||
| nbs.cmmc.port.rx.power | CMMC Port Rx Power (milli dBm) | It monitors the received optical power (in milli dBm) of this receiver.[NBS-CMMC-MIB::nbsCmmcPortRxPower:1.3.6.1.4.1.629.200.8.1.1.32]. | ||
| nbs.cmmc.port.bias.current | CMMC Port Bias Current(microAmps) | It monitors the bias current (in microAmps) of this transmitter.[NBS-CMMC-MIB::nbsCmmcPortBiasAmps:1.3.6.1.4.1.629.200.8.1.1.33]. | ||
| nbs.cmmc.port.voltage | CMMC Port Voltage | mV | It monitors the supply voltage (in milliVolts) of this transmitter.[NBS-CMMC-MIB::nbsCmmcPortSupplyVolts:1.3.6.1.4.1.629.200.8.1.1.34]. | |
| nbs.cmmc.port.temperature.level | CMMC Port Temperature Level | It monitors whether this port has a temperature problem. Possible values are 1: notSupported,2: lowAlarm,3: lowWarning,4: ok,5: highWarning,6: highAlarm.[NBS-CMMC-MIB::nbsCmmcPortTemperatureLevel:1.3.6.1.4.1.629.200.8.1.1.64]. | ||
| nbs.cmmc.port.tx.power.level | CMMC Port Tx Power level | It monitors whether this port has a problem with its transmitter power.Possible values are 1: notSupported,2: lowAlarm,3: lowWarning,4: ok,5: highWarning,6: highAlarm.[NBS-CMMC-MIB::nbsCmmcPortTxPowerLevel:1.3.6.1.4.1.629.200.8.1.1.65]. | ||
| nbs.cmmc.port.rx.power.level | CMMC Port Rx Power Level | It monitors whether this port has a problem with the power of its received signal.Possible values are 1: notSupported,2: lowAlarm,3: lowWarning,4: ok,5: highWarning,6: highAlarm.[NBS-CMMC-MIB::nbsCmmcPortRxPowerLevel:1.3.6.1.4.1.629.200.8.1.1.66]. | ||
| nbs.cmmc.port.bias.current.level | CMMC Port Bias Current Level | It monitors whether this port has a problem with the electric current going through the port.Possible values are 1: notSupported,2: lowAlarm,3: lowWarning,4: ok,5: highWarning,6: highAlarm.[NBS-CMMC-MIB::nbsCmmcPortBiasAmpsLevel:1.3.6.1.4.1.629.200.8.1.1.67]. | ||
| nbs.cmmc.port.voltage.level | CMMC Port Voltage Level | It monitors whether this port has a problem with the electric voltage across the port.Possible values are 1: notSupported,2: lowAlarm,3: lowWarning,4: ok,5: highWarning,6: highAlarm.[NBS-CMMC-MIB::nbsCmmcPortSupplyVoltsLevel:1.3.6.1.4.1.629.200.8.1.1.68]. | ||
| MRV - CMMC Slot Temperature | nbs.cmmc.slot.temperature | CMMC Slot Temperature | Celsius | It monitors the temperature (in degrees celsius) of this slot.[NBS-CMMC-MIB::nbsCmmcSlotTemperature:1.3.6.1.4.1.629.200.7.1.1.34]. |
MRV - Fan
Description
Template to monitor the MRV Fan Status and Speed. Validated on sysObjectID: 1.3.6.1.4.1.629.200.1.1.1,OD-NM,v5.13.1,Firmware : 20.1b,EM316.
Prerequisites
The device should have support for NBS-FAN-MIB.
Supported Metric
| Monitor Name | Metric Name | Metric Display Name | Unit | Description |
|---|---|---|---|---|
| MRV - Fan Status and Speed | nbs.fan.status | Fan Status | It monitors operational status of this fan.Possible values are 1: notSupported,2: bad,3: good,4: notInstalled(4).[NBS-FAN-MIB::nbsFanFanStatus:1.3.6.1.4.1.629.226.1.1.1.30]. | |
| nbs.fan.speed | Fan Speed | It monitors the speed level of this fan.Possible values are 1: notSupported,2: off,3: low,4: medium,5: high.[NBS-FAN-MIB::nbsFanFanSpeed:1.3.6.1.4.1.629.226.1.1.1.40]. |
MRV - Opti-Driver System
Description
Template to monitor the MRV Opti-Driver System Control Card Temperature and Temperature Level,Fan Tray Temperature and Temperature Level,Power Supply parameters like Temperature Level,Temperature,Voltage In,Voltage In Level,Voltage Out,Voltage Out Level,Current In,Current In Level,Current Out,Current Out Level.sysObjectID: 1.3.6.1.4.1.629.200.1.1.1,OD-NM,v5.13.1,Firmware : 20.1b,EM316.
Prerequisites
The device should have support for NBS-ODSYS-MIB.
Supported Metric
| Monitor Name | Metric Name | Metric Display Name | Unit | Description |
|---|---|---|---|---|
| MRV - Opti-Driver System Control Card Temperature | nbs.od.sys.control.card.temperature | Opti-Driver System Control Card Temperature | Celsius | It monitors the current temperature reading in degrees celsius.Here the component name will be Opti-Driver System Control Card Chassis Index and Opti-Driver System Control Card Bay Index with dotted separation.[NBS-ODSYS-MIB::nbsOdsysCcThermActual:1.3.6.1.4.1.629.228.3.1.1.30]. |
| nbs.od.sys.control.card.temperature.level | Opti-Driver System Control Card Temperature Level | It monitors the level of current temperature reading.Here the component name will be Opti-Driver System Control Card Chassis Index and Opti-Driver System Control Card Bay Index with dotted separation.Possible values are 1: notSupported,2: statusLowError,3: statusLowWarning,4: statusGood,5: statusHighWarning,6: statusHighError.[NBS-ODSYS-MIB::nbsOdsysCcThermLevel:1.3.6.1.4.1.629.228.3.1.1.40]. | ||
| nbs.od.sys.fan.tray.temperature.level | Opti-Driver System Fan Tray Temperature Level | It monitors the level of current temperature reading.Here the component name will be Opti-Driver System Fan Tray Chassis Index and Opti-Driver System Fan Tray Bay Index with dotted separation.Possible values are 1: notSupported,2: statusLowError,3: statusLowWarning,4: statusGood,5: statusHighWarning,6: statusHighError.[NBS-ODSYS-MIB::nbsOdsysFtThermLevel:1.3.6.1.4.1.629.228.4.1.1.40]. | ||
| nbs.od.sys.fan.tray.temperature | Opti-Driver System Fan Tray Temperature | Celsius | It monitors the current temperature reading in degrees celsius.Here the component name will be Opti-Driver System Fan Tray Chassis Index and Opti-Driver System Fan Tray Bay Index with dotted separation.[NBS-ODSYS-MIB::nbsOdsysFtThermActual:1.3.6.1.4.1.629.228.4.1.1.30]. | |
| nbs.od.sys.powersupply.temperature.level | Opti-Driver System Power Supply Temperature Level | It monitors the level of current temperature reading of Opti-Driver System Power Supply. Here the component name will be Opti-Driver System Power Supply Chassis Index and Opti-Driver System Power Supply Bay Index with dotted separation.Possible values are 1: notSupported,2: statusLowError,3: statusLowWarning,4: statusGood,5: statusHighWarning,6: statusHighError.[NBS-ODSYS-MIB::nbsOdsysPsThermLevel:1.3.6.1.4.1.629.228.5.2.1.41]. | ||
| nbs.od.sys.powersupply.temperature | Opti-Driver System Power Supply Temperature | Celsius | It monitors the current temperature reading in degrees celsius.Here the component name will be Opti-Driver System Power Supply Chassis Index and Opti-Driver System Power Supply Bay Index with dotted separation.[NBS-ODSYS-MIB::nbsOdsysPsThermActual:1.3.6.1.4.1.629.228.5.2.1.40]. | |
| nbs.od.sys.powersupply.input.voltage | Opti-Driver System Power Supply Input Voltage | mV | It monitors the input voltage reading in millivolts.Here the component name will be Opti-Driver System Power Supply Chassis Index and Opti-Driver System Power Supply Bay Index with dotted separation.[NBS-ODSYS-MIB::nbsOdsysPsVInActual:1.3.6.1.4.1.629.228.5.2.1.50]. | |
| nbs.od.sys.powersupply.input.voltage.level | Opti-Driver System Power Supply Input Voltage Level | It monitors the level of input voltage reading.Here the component name will be Opti-Driver System Power Supply Chassis Index and Opti-Driver System Power Supply Bay Index with dotted separation.Possible values are 1: notSupported,2: statusLowError,3: statusLowWarning,4: statusGood,5: statusHighWarning,6: statusHighError.[NBS-ODSYS-MIB::nbsOdsysPsVInLevel:1.3.6.1.4.1.629.228.5.2.1.51]. | ||
| nbs.od.sys.powersupply.output.voltage | Opti-Driver System Power Supply Output Voltage | mV | It monitors the output voltage reading in millivolts.Here the component name will be Opti-Driver System Power Supply Chassis Index and Opti-Driver System Power Supply Bay Index with dotted separation.[NBS-ODSYS-MIB::nbsOdsysPsVOutActual:1.3.6.1.4.1.629.228.5.2.1.60]. | |
| nbs.od.sys.powersupply.output.voltage.level | Opti-Driver System Power Supply Output Voltage Level | It monitors the level of output voltage reading.Here the component name will be Opti-Driver System Power Supply Chassis Index and Opti-Driver System Power Supply Bay Index with dotted separation.Possible values are 1: notSupported,2: statusLowError,3: statusLowWarning,4: statusGood,5: statusHighWarning,6: statusHighError.[NBS-ODSYS-MIB::nbsOdsysPsVOutLevel:1.3.6.1.4.1.629.228.5.2.1.61]. | ||
| nbs.od.sys.powersupply.input.current | Opti-Driver System Power Supply Input Current | mA | It monitors the input current reading in milliamps.Here the component name will be Opti-Driver System Power Supply Chassis Index and Opti-Driver System Power Supply Bay Index with dotted separation.[NBS-ODSYS-MIB::nbsOdsysPsIInActual:1.3.6.1.4.1.629.228.5.2.1.70]. | |
| nbs.od.sys.powersupply.input.current.level | Opti-Driver System Power Supply Input Current Level | It monitors the level of input current reading.Here the component name will be Opti-Driver System Power Supply Chassis Index and Opti-Driver System Power Supply Bay Index with dotted separation.Possible values are 1: notSupported,2: statusLowError,3: statusLowWarning,4: statusGood,5: statusHighWarning,6: statusHighError.[NBS-ODSYS-MIB::nbsOdsysPsIInLevel:1.3.6.1.4.1.629.228.5.2.1.71]. | ||
| nbs.od.sys.powersupply.output.current | Opti-Driver System Power Supply Output Current | mA | It monitors the output current in milliamps.Here the component name will be Opti-Driver System Power Supply Chassis Index and Opti-Driver System Power Supply Bay Index with dotted separation.[NBS-ODSYS-MIB::nbsOdsysPsIOutActual:1.3.6.1.4.1.629.228.5.2.1.80]. | |
| nbs.od.sys.powersupply.output.current.level | Opti-Driver System Power Supply Output Current Level | It monitors the level of output current reading.Here the component name will be Opti-Driver System Power Supply Chassis Index and Opti-Driver System Power Supply Bay Index with dotted separation.Possible values are 1: notSupported,2: statusLowError,3: statusLowWarning,4: statusGood,5: statusHighWarning,6: statusHighError.[NBS-ODSYS-MIB::nbsOdsysPsIOutLevel:1.3.6.1.4.1.629.228.5.2.1.81]. |
MRV - SFF(Small Form Factor) Diagnostics
Description
Template to monitor MRV SFF(Small Form Factor) Diagnostics parameters like Temperature,Voltage,Bias Current,Tx Power,Rx Power. sysObjectID: 1.3.6.1.4.1.629.200.1.1.1,OD-NM,v5.13.1,Firmware : 20.1b,EM316.
Prerequisites
Device should have support for NBS-SFF-MIB.
Supported Metric
| Monitor Name | Metric Name | Metric Display Name | Unit | Description |
|---|---|---|---|---|
| MRV - SFF(Small Form Factor) Diagnostics | nbs.sff.diagnostic.temperature | SFF Diagnostic Temperature | C | It monitors the module temperature in centigradese of SFF(Small Form Factor) Diagnostic.[NBS-SFF-MIB::nbsSffDiagsTemperature:1.3.6.1.4.1.629.204.1.3.1.1.20]. |
| nbs.sff.diagnostic.voltage | SFF Diagnostic Voltage | v | It monitors the internally measured supply voltage in transceiver of SFF(Small Form Factor) Diagnostic in the units of Volts.[NBS-SFF-MIB::nbsSffDiagsVoltage:1.3.6.1.4.1.629.204.1.3.1.1.25]. | |
| nbs.sff.diagnostic.bias.current | SFF Diagnostic Bias Current | mA | It monitors the internally measured TX Bias Current of SFF(Small Form Factor) Diagnostic in the units of mA.[NBS-SFF-MIB::nbsSffDiagsBiasCurrent:1.3.6.1.4.1.629.204.1.3.1.1.30]. | |
| nbs.sff.diagnostic.tx.power | SFF Diagnostic Tx Power | dBm | It monitors the measured TX output power of SFF(Small Form Factor) Diagnostic in the units of dBm.[NBS-SFF-MIB::nbsSffDiagsTxPower:1.3.6.1.4.1.629.204.1.3.1.1.35]. | |
| nbs.sff.diagnostic.rx.power | SFF Diagnostic Rx Power(uW) | It monitors the measured received optical power of SFF(Small Form Factor) Diagnostic in uW .Rx_PWR (uW) = Rx_PWR(4) * Rx_PWR AD 4 (16 bit unsigned integer) + Rx_PWR(3) * Rx_PWR AD 3 (16 bit unsigned integer) + Rx_PWR(2) * Rx_PWR AD 2 (16 bit unsigned integer) + Rx_PWR(1) * Rx_PWR AD (16 bit unsigned integer) + Rx_PWR(0).[NBS-SFF-MIB::nbsSffDiagsRxPower:1.3.6.1.4.1.629.204.1.3.1.1.40]. |
MRV - Signal Conditioning Port Statistics
Description
Template to monitor MRV - Signal Conditioning Port Statistics like Rx Power,Tx Power and Noise.sysObjectID: 1.3.6.1.4.1.629.200.1.1.1,OD-NM,v5.13.1,Firmware : 20.1b,EM316
Prerequisites
Device should have support for NBS-SIGCOND-MIB.
Supported Metric
| Monitor Name | Metric Name | Metric Display Name | Unit | Description |
|---|---|---|---|---|
| MRV - Signal Conditioning Port Statistics | nbs.signal.cond.port.rx.power | Signal Conditioning Port Rx Power (milli dBm) | It monitors the measured receiver power,in millidecibels (mdBm).[NBS-SIGCOND-MIB::nbsSigCondPortRxPower:1.3.6.1.4.1.629.227.40.2.1.2]. | |
| nbs.signal.cond.port.tx.power | Signal Conditioning Port Tx Power(milli dBm) | It monitors the measured transmitter power,in millidecibels (mdBm).[NBS-SIGCOND-MIB::nbsSigCondPortTxPower:1.3.6.1.4.1.629.227.40.2.1.3]. | ||
| nbs.signal.cond.port.noise | Signal Conditioning Port Noise(milli dB) | It monitors the measured Noise Figure value,in millidecibels (mdB).[NBS-SIGCOND-MIB::nbsSigCondPortNoiseFigure:1.3.6.1.4.1.629.227.40.2.1.7]. |
MS Windows Performance - Basic
Description
MS Windows Performance. Basic CPU,Mem(Virt,Phy),Uptime,Disk Usage.
Prerequisites
No prerequisite
Supported Metric
| Monitor Name | Metric Name | Metric Display Name | Unit | Description |
|---|---|---|---|---|
| MS Windows Performance - Basic | windows.system.cpu.util | System CPU Utilization | % | System CPU Utilisation collected with WMI |
| windows.system.virtual.mem.free | System Free Virtual Memory | GB | System Free Virtual Memory | |
| windows.system.virtual.mem.util | System Virtual Memory Utilization | % | System Virtual Memory Utilisation | |
| windows.system.mem.util | System Memory Utilization | % | System Memory Utilisation | |
| windows.system.mem.free | System Free Memory | GB | System Free Memory | |
| windows.system.uptime | System Uptime | ms | System Uptime | |
| windows.system.drive.util | System Drive Utilization | % | System Drive Utilisation | |
| windows.system.drive.free-space | System Drive Free Space | GB | System Drive Free Space |
Multiple IPs Ping Reachability Monitor
Description
Monitors device reachability state by pinging management ip at the first step. If management ip is not reachable,this monitor tries to get the reachability info using multiple ips if provided as part of custom parameter at the time of template assignment. If custom IPs list is not provided,this monitor will try to get the device ip’s list through SNMP by querying IP-MIB OID “1.3.6.1.2.1.4.20.1.1” and check for the device reachability state. If any of the IPs are being pinged,then the metric values would be 1 (“REACHABLE”) else 0 - (UNREACHABLE"). It will work with OpsRamp Gateway version 12.0.0 or above and OpsRamp SaaS Version 11.0.0 HF U05 or above.
Prerequisites
No prerequisite
Supported Metric
| Monitor Name | Metric Name | Metric Display Name | Unit | Description |
|---|---|---|---|---|
| Multiple IPs Ping Reachability Monitor | resource.icmp.reachability | Multi IP Ping | NULL | Monitors device reachability state by pinging management ip at the first step. If management ip is not reachable,this monitor tries to get the reachability info using multiple ips if provided as part of custom parameter at the time of template assignment. If custom IPs list is not provided,this monitor will try to get the device ip's list through SNMP by querying IP-MIB OID "1.3.6.1.2.1.4.20.1.1" and check for the device reachability state. If any of the IPs are being pinged,then the metric values would be 1 ("REACHABLE") else 0 - (UNREACHABLE"). |
Multiple IPs Ping Reachability Monitor - V2
Description
The monitor checks the device’s reachability by first pinging the management IP. If the management IP is unreachable, it evaluates reachability using custom parameters specified in the assigned template.
- If the Include Discovery IPs List parameter is set to Yes:
- The monitor evaluates both:
- The custom IP list provided in the configuration.
- The alternative IPs discovered via SNMP using OID
1.3.6.1.2.1.4.20.1.1.
- HSRP IPs are retrieved using OID
1.3.6.1.4.1.9.9.106.1.2.1.1.11and removed from the discovered IP list. - The monitor combines the custom IP list with the filtered discovered IPs.
- Any IPs specified in the Exclude IPs List are also removed.
- The monitor pings the final set of IPs:
- If any IP responds, the metric is set to 1 (REACHABLE).
- If none respond, the metric is set to 0 (UNREACHABLE).
- The monitor evaluates both:
- If the
Include Discovery IPs Listparameter is set toNo, and the management IP is not reachable:- The monitor uses only the custom IP list, if configured.
- If the custom list is not provided, it retrieves alternative IPs via SNMP using OID
1.3.6.1.2.1.4.20.1.1. - HSRP IPs (OID
1.3.6.1.4.1.9.9.106.1.2.1.1.11) and any IPs in the Exclude IPs List are removed. - The monitor pings the remaining IPs:
- If any IP responds, the metric is set to 1 (REACHABLE).
- If none respond, the metric is set to 0 (UNREACHABLE).
Note
This monitor is supported from OpsRamp Gateway version 19.2.0 and SaaS version 2025.06-U1 onwards.Prerequisites
- A gateway management profile is required to be mapped to a resource.
- SNMP-type credentials must be added to the resource to enable discovery of alternative IPs using IP-MIB and HSRP data.
Supported Metric
| Monitor Name | Metric Name | Metric Display Name | Unit | Description |
|---|---|---|---|---|
| Multiple IPs Ping Reachability Monitor - v2 | resource.icmp.reachability | Multi IP Ping | NULL | Monitors device reachability state by pinging management ip at the first step. If management ip is not reachable, this monitor tries to get the reachability info using multiple ips if provided as part of custom parameter at the time of template assignment. If custom IPs list is not provided, this monitor will try to get the device ip's list through SNMP by querying IP-MIB OID "1.3.6.1.2.1.4.20.1.1" and check for the device reachability state. If any of the IPs are being pinged, then the metric values would be 1 ("REACHABLE") else 0 - (UNREACHABLE"). |
NE-VT-Cluster Performance
Description
NE-VT-Cluster Performance
Prerequisites
No prerequisite
Supported Metric
| Monitor Name | Metric Name | Metric Display Name | Unit | Description |
|---|---|---|---|---|
| VMware Cluster Performance - Deprecated | vmware.cpu.usage.average | VMware CPU usage | % | Cpu usage average |
| vmware.mem.usage.average | VMware memory usage | % | Memory usage average | |
| vmware.mem.consumed.average | VMware memory consumed | GB | Memory consumed average | |
| vmware.mem.vmmemctl.average | VMware memory balloon | KB | Memory Balloon Average | |
| vmware.net.throughput.usage.average | VMware net throughput usage | KBps | net throughput usage average | |
| vmware.vm.suspended.count | VMware VM suspended count | VMware VM suspended count | ||
| vmware.vm.poweroff.count | VMware VM poweroff count | VMware VM poweroff count | ||
| vmware.vm.poweron.count | VMware VM poweron count | VMware VM poweron count | ||
| vmware.disk.throughput.usage.average | VMware disk throughput usage average | Kbps | VMware disk throughput usage average | |
| vmware.disk.throughput.contention.average | VMware disk throughput contention average | ms | VMware disk throughput contention average | |
| vmware.vmop.numVMotion.latest | VMware vMotion count | VMotion count | ||
| vmware.vmop.numSVMotion.latest | VMware storage vMotion Count | Storage vMotion Count |
NE-VT-VirtualMachine Performance
Description
NE-VT-VirtualMachine Performance
Prerequisites
No prerequisite
Supported Metric
| Monitor Name | Metric Name | Metric Display Name | Unit | Description |
|---|---|---|---|---|
| VMware VirtualMachine Performance - Deprecated | vmware.disk.write.average | VMware disk write average | KBps | VMware disk write average |
| vmware.net.usage.average | VMware net usage | KBps | Net usage average | |
| vmware.mem.vmmemctl.average | VMware memory balloon | KB | Memory Balloon Average | |
| vmware.mem.usage.average | VMware memory usage | % | Memory usage average | |
| vmware.cpu.usage.average | VMware CPU usage | % | Cpu usage average |
Netgate pfSense - Packet Filter Interface Statistics
Description
Template to monitor the pfSense packet filter interface statistics like Interfaces Referencing Rules , Interfaces IPv4 Bytes In Pass , Interfaces IPv4 Bytes In Block , Interfaces IPv4 Bytes Out Pass , Interfaces IPv4 Bytes Out Block , Interfaces IPv4 Packets In Pass , Interfaces IPv4 Packets In Block , Interfaces IPv4 Packets Out Pass , Interfaces IPv4 Packets Out Block , Interfaces IPv6 Bytes In Pass , Interfaces IPv6 Bytes In Block , Interfaces IPv6 Bytes Out Pass , Interfaces IPv6 Bytes Out Block , Interfaces IPv6 Packets In Pass , Interfaces IPv6 Packets In Block , Interfaces IPv6 Packets Out Pass , Interfaces IPv6 Packets Out Block.[BEGEMOT-PF-MIB :: pfInterfacesIfRefsRule : 1.3.6.1.4.1.12325.1.200.1.8.2.1.6 , pfInterfacesIf4BytesInPass : 1.3.6.1.4.1.12325.1.200.1.8.2.1.7 , pfInterfacesIf4BytesInBlock : 1.3.6.1.4.1.12325.1.200.1.8.2.1.8 , pfInterfacesIf4BytesOutPass : 1.3.6.1.4.1.12325.1.200.1.8.2.1.9 , pfInterfacesIf4BytesOutBlock : 1.3.6.1.4.1.12325.1.200.1.8.2.1.10 , pfInterfacesIf4PktsInPass : 1.3.6.1.4.1.12325.1.200.1.8.2.1.11 , pfInterfacesIf4PktsInBlock : 1.3.6.1.4.1.12325.1.200.1.8.2.1.12 , pfInterfacesIf4PktsOutPass : 1.3.6.1.4.1.12325.1.200.1.8.2.1.13 , pfInterfacesIf4PktsOutBlock : 1.3.6.1.4.1.12325.1.200.1.8.2.1.14 , pfInterfacesIf6BytesInPass : 1.3.6.1.4.1.12325.1.200.1.8.2.1.15 , pfInterfacesIf6BytesInBlock : 1.3.6.1.4.1.12325.1.200.1.8.2.1.16 , pfInterfacesIf6BytesOutPass : 1.3.6.1.4.1.12325.1.200.1.8.2.1.17 , pfInterfacesIf6BytesOutBlock : 1.3.6.1.4.1.12325.1.200.1.8.2.1.18 , pfInterfacesIf6PktsInPass : 1.3.6.1.4.1.12325.1.200.1.8.2.1.19 , pfInterfacesIf6PktsInBlock : 1.3.6.1.4.1.12325.1.200.1.8.2.1.20 , pfInterfacesIf6PktsOutPass : 1.3.6.1.4.1.12325.1.200.1.8.2.1.21 , pfInterfacesIf6PktsOutBlock : 1.3.6.1.4.1.12325.1.200.1.8.2.1.22]
Prerequisites
Device must support BEGEMOT-PF-MIB
Supported Metric
| Monitor Name | Metric Name | Metric Display Name | Unit | Description |
|---|---|---|---|---|
| Netgate pfSense - Packet Filter Interface Statistics | netgate_pfsense_PfInterfacesIfRefsRule | PfSense Packet Filter Interfaces Referencing Rules | count | Monitors the number of rules referencing this interface.[BEGEMOT-PF-MIB :: pfInterfacesIfRefsRule : 1.3.6.1.4.1.12325.1.200.1.8.2.1.6] |
| netgate_pfsense_PfInterfacesIf4BytesInPass | PfSense Packet Filter Interfaces IPv4 Bytes In Pass | psec | Monitors the number of IPv4 bytes passed coming in on this interface.[BEGEMOT-PF-MIB :: pfInterfacesIf4BytesInPass : 1.3.6.1.4.1.12325.1.200.1.8.2.1.7] | |
| netgate_pfsense_PfInterfacesIf4BytesInBlock | PfSense Packet Filter Interfaces IPv4 Bytes In Block | psec | Monitors the number of IPv4 bytes blocked coming in on this interface.[BEGEMOT-PF-MIB :: pfInterfacesIf4BytesInBlock : 1.3.6.1.4.1.12325.1.200.1.8.2.1.8] | |
| netgate_pfsense_PfInterfacesIf4BytesOutPass | PfSense Packet Filter Interfaces IPv4 Bytes Out Pass | psec | Monitors the number of IPv4 bytes passed going out on this interface. | |
| netgate_pfsense_PfInterfacesIf4BytesOutBlock | PfSense Packet Filter Interfaces IPv4 Bytes Out Block | psec | Monitors the number of IPv4 bytes blocked going out on this interface.[BEGEMOT-PF-MIB :: pfInterfacesIf4BytesOutBlock : 1.3.6.1.4.1.12325.1.200.1.8.2.1.10] | |
| netgate_pfsense_PfInterfacesIf4PktsInPass | PfSense Packet Filter Interfaces IPv4 Packets In Pass | psec | Monitors the number of IPv4 packets passed coming in on this interface.[BEGEMOT-PF-MIB :: pfInterfacesIf4PktsInPass : 1.3.6.1.4.1.12325.1.200.1.8.2.1.11] | |
| netgate_pfsense_PfInterfacesIf4PktsInBlock | PfSense Packet Filter Interfaces IPv4 Packets In Block | psec | Monitors the number of IPv4 packets blocked coming in on this interface.[BEGEMOT-PF-MIB :: pfInterfacesIf4PktsInBlock : 1.3.6.1.4.1.12325.1.200.1.8.2.1.12] | |
| netgate_pfsense_PfInterfacesIf4PktsOutPass | PfSense Packet Filter Interfaces IPv4 Packets Out Pass | psec | Monitors the number of IPv4 packets passed going out on this interface.[BEGEMOT-PF-MIB :: pfInterfacesIf4PktsOutPass : 1.3.6.1.4.1.12325.1.200.1.8.2.1.13] | |
| netgate_pfsense_PfInterfacesIf4PktsOutBlock | PfSense Packet Filter Interfaces IPv4 Packets Out Block | psec | Monitors the number of IPv4 packets blocked going out on this interface.[BEGEMOT-PF-MIB :: pfInterfacesIf4PktsOutBlock : 1.3.6.1.4.1.12325.1.200.1.8.2.1.14] | |
| netgate_pfsense_PfInterfacesIf6BytesInPass | PfSense Packet Filter Interfaces IPv6 Bytes In Pass | psec | Monitors the number of IPv6 bytes passed coming in on this interface.[BEGEMOT-PF-MIB :: pfInterfacesIf6BytesInPass : 1.3.6.1.4.1.12325.1.200.1.8.2.1.15] | |
| netgate_pfsense_PfInterfacesIf6BytesInBlock | PfSense Packet Filter Interfaces IPv6 Bytes In Block | psec | Monitors the The number of IPv6 bytes blocked coming in on this interface.[BEGEMOT-PF-MIB :: pfInterfacesIf6BytesInBlock : 1.3.6.1.4.1.12325.1.200.1.8.2.1.16] | |
| netgate_pfsense_PfInterfacesIf6BytesOutPass | PfSense Packet Filter Interfaces IPv6 Bytes Out Pass | psec | Monitors the number of IPv6 bytes passed going out on this interface.[BEGEMOT-PF-MIB :: pfInterfacesIf6BytesOutPass : 1.3.6.1.4.1.12325.1.200.1.8.2.1.17] | |
| netgate_pfsense_PfInterfacesIf6BytesOutBlock | PfSense Packet Filter Interfaces IPv6 Bytes Out Block | psec | Monitors the number of IPv6 bytes blocked going out on this interface.[BEGEMOT-PF-MIB :: pfInterfacesIf6BytesOutBlock : 1.3.6.1.4.1.12325.1.200.1.8.2.1.18] | |
| netgate_pfsense_PfInterfacesIf6PktsInPass | PfSense Packet Filter Interfaces IPv6 Packets In Pass | psec | Monitors the number of IPv6 packets passed coming in on this interface.[BEGEMOT-PF-MIB :: pfInterfacesIf6PktsInPass : 1.3.6.1.4.1.12325.1.200.1.8.2.1.19] | |
| netgate_pfsense_PfInterfacesIf6PktsInBlock | PfSense Packet Filter Interfaces IPv6 Packets In Block | psec | Monitors the number of IPv6 packets blocked coming in on this interface.[BEGEMOT-PF-MIB :: pfInterfacesIf6PktsInBlock : 1.3.6.1.4.1.12325.1.200.1.8.2.1.20] | |
| netgate_pfsense_PfInterfacesIf6PktsOutPass | PfSense Packet Filter Interfaces IPv6 Packets Out Pass | psec | Monitors the number of IPv6 packets passed going out on this interface.[BEGEMOT-PF-MIB :: pfInterfacesIf6PktsOutPass : 1.3.6.1.4.1.12325.1.200.1.8.2.1.21] | |
| netgate_pfsense_PfInterfacesIf6PktsOutBlock | PfSense Packet Filter Interfaces IPv6 Packets Out Block | psec | Monitors the number of IPv6 packets blocked going out on this interface.[BEGEMOT-PF-MIB : pfInterfacesIf6PktsOutBlock : 1.3.6.1.4.1.12325.1.200.1.8.2.1.22] |
Netgate pfSense - Source & State Table Statistics
Description
Template to monitors the State Table Statistics like State Table Count , Running Status , Packet Filter States Limits , States table utilization in % and Source statistics like Source Nodes Count , Source Nodes Limits.[BEGEMOT-PF-MIB :: pfStatusRunning : 1.3.6.1.4.1.12325.1.200.1.1.1.0 , pfStateTableCount : 1.3.6.1.4.1.12325.1.200.1.3.1.0 , pfLimitsStates : 1.3.6.1.4.1.12325.1.200.1.5.1.0 , pfSrcNodesCount : 1.3.6.1.4.1.12325.1.200.1.4.1 , pfLimitsSrcNodes : 1.3.6.1.4.1.12325.1.200.1.5.2]
Prerequisites
Device must support BEGEMOT-PF-MIB
Supported Metric
| Monitor Name | Metric Name | Metric Display Name | Unit | Description |
|---|---|---|---|---|
| Netgate pfSense - Source & State Table Statistics | netgate_pfsense_PfStatusRunning | PfSense Packet Filter Running Status | Monitors the status of packet filter .True if pf is currently enabled. Possible values are true(1) , false(2) .[BEGEMOT-PF-MIB :: pfStatusRunning : 1.3.6.1.4.1.12325.1.200.1.1.1.0] | |
| netgate_pfsense_PfStateTableCount | PfSense Packet Filter State Table Count | count | Monitors the Number of entries in the state table.[BEGEMOT-PF-MIB :: pfStateTableCount : 1.3.6.1.4.1.12325.1.200.1.3.1.0] | |
| netgate_pfsense_PfLimitsStates | PfSense Packet Filter States Limits | count | Monitors the maximum number of 'keep state' rules in the ruleset.[BEGEMOT-PF-MIB :: pfLimitsStates : 1.3.6.1.4.1.12325.1.200.1.5.1.0] | |
| netgate_pfsense_PfStateTableUtilization | PfSense Packet Filter State Table Utilization | % | Monitors the PfSense Packet Filter State Table Utilization.[BEGEMOT-PF-MIB :: pfStateTableCount : 1.3.6.1.4.1.12325.1.200.1.3.1.0 , pfLimitsStates : 1.3.6.1.4.1.12325.1.200.1.5.1.0] | |
| netgate_pfsense_PfSrcNodesCount | PfSense Packet Filter Source Nodes Count | count | Monitors the number of entries in the source tracking table.[BEGEMOT-PF-MIB :: pfSrcNodesCount : 1.3.6.1.4.1.12325.1.200.1.4.1.0] | |
| netgate_pfsense_PfLimitsSrcNodes | PfSense Packet Filter Source Nodes Limits | count | Monitors the maximum number of 'sticky-address' or 'source-track' rules in the ruleset.[BEGEMOT-PF-MIB :: pfLimitsSrcNodes : 1.3.6.1.4.1.12325.1.200.1.5.2.0] | |
| netgate_pfsense_PfSrcNodesUtilization | PfSense Packet Filter Source Nodes Utilization | % | Monitors PfSense Packet Filter Source Nodes Utilization.[BEGEMOT-PF-MIB :: pfSrcNodesCount : 1.3.6.1.4.1.12325.1.200.1.4.1 , pfLimitsSrcNodes : 1.3.6.1.4.1.12325.1.200.1.5.2] |
Netgear 700 - Switch Hardware
Description
Monitors the Netgear 700 Series Switch Hardware statistics like Fan and Power Supply. [ NETGEAR-BOXSERVICES-PRIVATE-MIB :: boxServicesFanItemState : 1.3.6.1.4.1.4526.11.43.1.6.1.3 , boxServicesPowSupplyItemState : 1.3.6.1.4.1.4526.11.43.1.7.1.3 ]
Prerequisites
No prerequisite
Supported Metric
| Monitor Name | Metric Name | Metric Display Name | Unit | Description |
|---|---|---|---|---|
| Netgear 700 - Box Services Fan | netgear_700_BoxServicesFanItemState | Netgear 700 Switch Box Services Fan State | Monitors the status of fan. [ NETGEAR-BOXSERVICES-PRIVATE-MIB :: boxServicesFanItemState : 1.3.6.1.4.1.4526.11.43.1.6.1.3 ] Possible values are : 1 : notpresent , 2 : operational , 3 : failed , 4 : powering , 5 : nopower , 6 : notpowering , 7 : incompatible. | |
| Netgear 700 - Box Services Power Supply | netgear_700_BoxServicesPowSupplyItemState | Netgear 700 Switch Box Services Power Supply State | Monitors the status of power supply. [ NETGEAR-BOXSERVICES-PRIVATE-MIB :: boxServicesPowSupplyItemState : 1.3.6.1.4.1.4526.11.43.1.7.1.3 ] Possible values are : 1 : notpresent , 2 : operational , 3 : failed , 4 : powering , 5 : nopower , 6 : notpowering , 7 : incompatible. |
Netgear 700 - Switch Performance
Description
Monitors the Netgear 700 Series Switch Performance statistics like CPU and Memory utilization. [ NETGEAR-SWITCHING-MIB :: agentSwitchCpuProcessMemFree : 1.3.6.1.4.1.4526.11.1.1.4.1.0 , agentSwitchCpuProcessMemAvailable : 1.3.6.1.4.1.4526.11.1.1.4.2.0 , agentSwitchCpuProcessPercentageUtilization : 1.3.6.1.4.1.4526.11.1.1.4.8.1.3 ]
Prerequisites
No prerequisite
Supported Metric
| Monitor Name | Metric Name | Metric Display Name | Unit | Description |
|---|---|---|---|---|
| Netgear 700 - Switch CPU Utilization | netgear_700_AgentSwitchCpuProcessPercentageUtilization | Netgear 700 Switch CPU Process Percentage Utilization | % | Monitors the CPU utilization per task in Percentage over a period of 300 seconds and the Rising threshold period also in seconds, if configured. [NETGEAR-SWITCHING-MIB :: agentSwitchCpuProcessPercentageUtilization : 1.3.6.1.4.1.4526.11.1.1.4.8.1.3 ] |
| Netgear 700 - Switch Memory Utilization | netgear_700_MemoryUtilization | Netgear 700 Switch CPU Process Memory Utilization | % | Monitors the Netgear 700 Switch CPU Process Memory Utilization. [NETGEAR-SWITCHING-MIB :: agentSwitchCpuProcessMemFree : 1.3.6.1.4.1.4526.11.1.1.4.1.0 , agentSwitchCpuProcessMemAvailable : 1.3.6.1.4.1.4526.11.1.1.4.2.0 ] |
Netgear 7000 - Switch Hardware
Description
Monitors the Netgear 7000 Series Switch Hardware statistics like Fan, Power Supply and Temperature sensor. [ FASTPATH-BOXSERVICES-PRIVATE-MIB :: boxServicesFanItemState : 1.3.6.1.4.1.4526.10.43.1.6.1.3 , boxServicesFanSpeed : 1.3.6.1.4.1.4526.10.43.1.6.1.4 , boxServicesPowSupplyItemState : 1.3.6.1.4.1.4526.10.43.1.7.1.3 , boxServicesTempSensorState : 1.3.6.1.4.1.4526.10.43.1.8.1.3 , boxServicesTempSensorTemperature : 1.3.6.1.4.1.4526.10.43.1.8.1.4 ]
Prerequisites
No prerequisite
Supported Metric
| Monitor Name | Metric Name | Metric Display Name | Unit | Description |
|---|---|---|---|---|
| Netgear 7000 - Box Services Fan | netgear_7000_BoxServicesFanSpeed | Netgear 7000 Switch Box Services Fan Speed | rpm | Monitors the speed of fan. [ FASTPATH-BOXSERVICES-PRIVATE-MIB :: boxServicesFanSpeed : 1.3.6.1.4.1.4526.10.43.1.6.1.4 ] |
| netgear_7000_BoxServicesFanItemState | Netgear 7000 Switch Box Services Fan State | Monitors the status of fan. [ FASTPATH-BOXSERVICES-PRIVATE-MIB :: boxServicesFanItemState : 1.3.6.1.4.1.4526.10.43.1.6.1.3 ] Possible values are : 1 : operational , 2 : failed , 3 : powering , 4 : notpowering , 5 : notpresent. | ||
| Netgear 7000 - Box Services Power Supply | netgear_7000_BoxServicesPowSupplyItemState | Netgear 7000 Switch Box Services Power Supply State | Monitors the status of power supply. [ FASTPATH-BOXSERVICES-PRIVATE-MIB :: boxServicesPowSupplyItemState : 1.3.6.1.4.1.4526.10.43.1.7.1.3 ] Possible values are : 1 : operational , 2 : failed , 3 : powering , 4 : notpowering , 5 : notpresent. | |
| Netgear 7000 - Box Services Temperature Sensor | netgear_7000_BoxServicesTempSensorState | Netgear 7000 Switch Box Services Temperature Sensor State | Monitors the state of temperature sensor. [ FASTPATH-BOXSERVICES-PRIVATE-MIB :: boxServicesTempSensorState : 1.3.6.1.4.1.4526.10.43.1.8.1.3 ] Possible values are : 1 : normal , 2 : warning , 3 : critical , 4 : shutdown , 5 : notpresent , 6 : notoperational. | |
| netgear_7000_BoxServicesTempSensorTemperature | Netgear 7000 Switch Box Services Temperature Sensor Temperature | Celsius | Monitors the temperature value reported by sensor. [ FASTPATH-BOXSERVICES-PRIVATE-MIB :: boxServicesTempSensorTemperature : 1.3.6.1.4.1.4526.10.43.1.8.1.4 ] |
Netgear 7000 - Switch Performance
Description
Monitors the Netgear 7000 Series Switch Performance statistics like CPU and Memory utilization. [ FASTPATH-SWITCHING-MIB :: agentSwitchCpuProcessMemFree : 1.3.6.1.4.1.4526.10.1.1.5.1.0 , agentSwitchCpuProcessMemAvailable : 1.3.6.1.4.1.4526.10.1.1.5.2.0 , agentSwitchCpuProcessPercentageUtilization : 1.3.6.1.4.1.4526.10.1.1.5.3.1.3 ]
Prerequisites
No prerequisite
Supported Metric
| Monitor Name | Metric Name | Metric Display Name | Unit | Description |
|---|---|---|---|---|
| Netgear 7000 - Switch CPU Utilization | netgear_7000_AgentSwitchCpuProcessPercentageUtilization | Netgear 7000 Switch CPU Process Percentage Utilization | % | Monitors the Percentage of CPU Utilized. [ FASTPATH-SWITCHING-MIB :: agentSwitchCpuProcessPercentageUtilization : 1.3.6.1.4.1.4526.10.1.1.5.3.1.3 ] |
| Netgear 7000 - Switch Memory Utilization | netgear_7000_MemoryUtilization | Netgear 7000 Switch CPU Process Memory Utilization | % | Monitors the Netgear 7000 Switch CPU Process Memory Utilization. [ FASTPATH-SWITCHING-MIB :: agentSwitchCpuProcessMemFree : 1.3.6.1.4.1.4526.10.1.1.5.1.0 , agentSwitchCpuProcessMemAvailable : 1.3.6.1.4.1.4526.10.1.1.5.2.0 ] |
Netgear Hardware Monitoring
Description
Monitors the Hardware statistics like Fan, Power Supply and Temperature sensor. [ FASTPATH-BOXSERVICES-PRIVATE-MIB :: boxServicesFanItemState : 1.3.6.1.4.1.4526.10.43.1.6.1.3 , boxServicesFanSpeed : 1.3.6.1.4.1.4526.10.43.1.6.1.4 , boxServicesPowSupplyItemState : 1.3.6.1.4.1.4526.10.43.1.7.1.3 , boxServicesTempSensorState : 1.3.6.1.4.1.4526.10.43.1.8.1.3 , boxServicesTempSensorTemperature : 1.3.6.1.4.1.4526.10.43.1.8.1.4 ]
Prerequisites
NULL
Supported Metric
| Monitor Name | Metric Name | Metric Display Name | Unit | Description |
|---|---|---|---|---|
| Netgear Box Services Fan | netgear_BoxServicesFanItemState | Netgear Box Services Fan State | Monitors the status of fan. [ FASTPATH-BOXSERVICES-PRIVATE-MIB :: boxServicesFanItemState : 1.3.6.1.4.1.4526.10.43.1.6.1.3 ] Possible values are : 1 : operational , 2 : failed , 3 : powering , 4 : notpowering , 5 : notpresent. | |
| netgear_BoxServicesFanSpeed | Netgear Box Services Fan Speed | rpm | Monitors the speed of fan. [ FASTPATH-BOXSERVICES-PRIVATE-MIB :: boxServicesFanSpeed : 1.3.6.1.4.1.4526.10.43.1.6.1.4 ] | |
| Netgear Box Services Temperature Sensor | netgear_BoxServicesTempSensorTemperature | Netgear Box Services Temperature Sensor Temperature | Celsius | Monitors the temperature value reported by sensor. [ FASTPATH-BOXSERVICES-PRIVATE-MIB :: boxServicesTempSensorTemperature : 1.3.6.1.4.1.4526.10.43.1.8.1.5 ] |
| netgear_BoxServicesTempSensorState | Netgear Box Services Temperature Sensor State | Monitors the state of temperature sensor. [ FASTPATH-BOXSERVICES-PRIVATE-MIB :: boxServicesTempSensorState : 1.3.6.1.4.1.4526.10.43.1.8.1.4 ] Possible values are : 1 : normal , 2 : warning , 3 : critical , 4 : shutdown , 5 : notpresent , 6 : notoperational. | ||
| Netgear Box Services Power Supply | netgear_BoxServicesPowSupplyItemState | Netgear Box Services Power Supply State | Monitors the status of power supply. [ FASTPATH-BOXSERVICES-PRIVATE-MIB :: boxServicesPowSupplyItemState : 1.3.6.1.4.1.4526.10.43.1.7.1.3 ] Possible values are : 1 : operational , 2 : failed , 3 : powering , 4 : notpowering , 5 : notpresent. |
Netgear Performance Monitoring
Description
Monitors the Performance statistics like CPU and Memory utilization. [ FASTPATH-SWITCHING-MIB :: agentSwitchCpuProcessMemFree : 1.3.6.1.4.1.4526.10.1.1.5.1.0 , agentSwitchCpuProcessMemAvailable : 1.3.6.1.4.1.4526.10.1.1.5.2.0 , agentSwitchCpuProcessPercentageUtilization : 1.3.6.1.4.1.4526.10.1.1.5.3.1.3 ]
Prerequisites
NULL
Supported Metric
| Monitor Name | Metric Name | Metric Display Name | Unit | Description |
|---|---|---|---|---|
| Netgear Memory Utilization | netgear_MemoryUtilization | Netgear CPU Process Memory Utilization | % | Monitors the Netgear Memory Utilization. [ FASTPATH-SWITCHING-MIB :: agentSwitchCpuProcessMemFree : 1.3.6.1.4.1.4526.10.1.1.5.1.0 , agentSwitchCpuProcessMemAvailable : 1.3.6.1.4.1.4526.10.1.1.5.2.0 ] |
| Netgear CPU Utilization | netgear_cpu_AgentSwitchCpuProcessPercentageUtilization | Netgear CPU Process Utilization | % | Monitors the Percentage of CPU Utilized. [ FASTPATH-SWITCHING-MIB :: agentSwitchCpuProcessPercentageUtilization : 1.3.6.1.4.1.4526.10.1.1.5.3.1.3 ] |
NETSCOUT PFS Switch - Performance
Description
Monitors the NETSCOUT PFS switch performance statistics like cpu utilization and memory utilization. Validated on NETSCOUT PFS5100 Switch ( SysObjOID : 1.3.6.1.4.1.21671 ). [ NTCT-PFS-HEALTH-MIB :: nphCPUTotal : 1.3.6.1.4.1.21671.3.2.1.1.7.1.2 , nphMemoryTotal : 1.3.6.1.4.1.21671.3.2.1.1.6.1.2 , nphMemoryFree : 1.3.6.1.4.1.21671.3.2.1.1.6.1.3 ].
Prerequisites
Device must have support for NTCT-PFS-HEALTH-MIB.
Supported Metric
| Monitor Name | Metric Name | Metric Display Name | Unit | Description |
|---|---|---|---|---|
| NETSCOUT PFS Switch - CPU | netscout_pfs_switch_cpu_Utilization | NetScout PFS Switch CPU Utilization | % | Monitors the NetScout PFS switch total cpu utilization in percentage. [ NTCT-PFS-HEALTH-MIB :: nphCPUTotal : 1.3.6.1.4.1.21671.3.2.1.1.7.1.2 ] |
| NETSCOUT PFS Switch - Memory | netscout_pfs_switch_memory_Utilization | NetScout PFS Switch Memory Utilization | % | Monitors the NetScout PFS switch memory utilization. [ NTCT-PFS-HEALTH-MIB :: nphMemoryTotal : 1.3.6.1.4.1.21671.3.2.1.1.6.1.2 , nphMemoryFree : 1.3.6.1.4.1.21671.3.2.1.1.6.1.3 ] |
NETSCOUT PFS Switch - Hardware
Description
Monitors the NETSCOUT PFS switch temperature.Validated on NETSCOUT PFS5100 Switch ( SysObjOID : 1.3.6.1.4.1.21671 ). [ VSS-SYSTEM-MIB :: vsTemperatureStatusValue : 1.3.6.1.4.1.21671.3.1.1.1.1.1.3 ].
Prerequisites
NETSCOUT PFS Switch - Temperature.
Supported Metric
| Monitor Name | Metric Name | Metric Display Name | Unit | Description |
|---|---|---|---|---|
| NETSCOUT PFS Switch - Temperature | netscout_pfs_switch_temperature_Value | NetScout PFS Switch Temperature Value | Celsius | Monitors the NetScout PFS switch temperature. [ VSS-SYSTEM-MIB :: vsTemperatureStatusValue : 1.3.6.1.4.1.21671.3.1.1.1.1.1.3 ]. |
NETSCOUT PFS Switch - Interface
Description
Monitors the NETSCOUT PFS switch interface statistics including in and out multicast, unicast, and broadcast octets; in and out total octets; in and out dropped packets, out runts, out giants and in and out throughput. Validated on NETSCOUT PFS5100 Switch ( SysObjOID : 1.3.6.1.4.1.21671 ). [ NTCT-PFS-HEALTH-MIB :: nphIfExtInMulticastOctets : 1.3.6.1.4.1.21671.3.2.1.2.2.1.2 , nphIfExtInUcastOctets : 1.3.6.1.4.1.21671.3.2.1.2.2.1.5 , nphIfExtInBroadcastOctets : 1.3.6.1.4.1.21671.3.2.1.2.2.1.6 , nphIfExtInDropPkts : 1.3.6.1.4.1.21671.3.2.1.2.2.1.7 , nphIfExtOutMulticastOctets : 1.3.6.1.4.1.21671.3.2.1.2.2.1.21 , nphIfExtOutUcastOctets : 1.3.6.1.4.1.21671.3.2.1.2.2.1.24 , nphIfExtOutBroadcastOctets : 1.3.6.1.4.1.21671.3.2.1.2.2.1.25 , nphIfExtOutDropPkts : 1.3.6.1.4.1.21671.3.2.1.2.2.1.26 , nphIfExtOutUndersizePkts : 1.3.6.1.4.1.21671.3.2.1.2.2.1.40 , nphIfExtOutOversizePkts : 1.3.6.1.4.1.21671.3.2.1.2.2.1.41 , nphIfExtInThroughput : 1.3.6.1.4.1.21671.3.2.1.2.2.1.52 , nphIfExtOutThroughput : 1.3.6.1.4.1.21671.3.2.1.2.2.1.54 ].
Prerequisites
Device must have support for NTCT-PFS-HEALTH-MIB.
Supported Metric
| Monitor Name | Metric Name | Metric Display Name | Unit | Description |
|---|---|---|---|---|
| NETSCOUT PFS Switch - Interface | netscout_pfs_switch_interface_in_MulticastOctets | NetScout PFS Switch Interface In Multicast Octets | bps | Monitors the total number of octets received that were directed to a multicast address. [ NTCT-PFS-HEALTH-MIB :: nphIfExtInMulticastOctets : 1.3.6.1.4.1.21671.3.2.1.2.2.1.2 ] |
| netscout_pfs_switch_interface_in_UnicastOctets | NetScout PFS Switch Interface In Unicast Octets | bps | Monitors the total number of octets received that were directed to a unicast address. [ NTCT-PFS-HEALTH-MIB :: nphIfExtInUcastOctets : 1.3.6.1.4.1.21671.3.2.1.2.2.1.5 ] | |
| netscout_pfs_switch_interface_in_BroadcastOctets | NetScout PFS Switch Interface In Broadcast Octets | bps | Monitors the total number of octets received which were addressed to a broadcast address at this sub-layer. [ NTCT-PFS-HEALTH-MIB :: nphIfExtInMulticastOctets : nphIfExtInBroadcastOctets : 1.3.6.1.4.1.21671.3.2.1.2.2.1.6 ] | |
| netscout_pfs_switch_interface_octets_in_Rate | NetScout PFS Switch Interface Octets In Rate | bps | Monitors the total number of octets received in an interface. [ NTCT-PFS-HEALTH-MIB :: nphIfExtInMulticastOctets : 1.3.6.1.4.1.21671.3.2.1.2.2.1.2 , nphIfExtInUcastOctets : 1.3.6.1.4.1.21671.3.2.1.2.2.1.5 , nphIfExtInBroadcastOctets : 1.3.6.1.4.1.21671.3.2.1.2.2.1.6 ] | |
| netscout_pfs_switch_interface_in_DropPackets | NetScout PFS Switch Interface In Drop Packets | packets/sec | Monitors the total number of packets received that were dropped due to buffer overflow. [ NTCT-PFS-HEALTH-MIB :: nphIfExtInDropPkts : 1.3.6.1.4.1.21671.3.2.1.2.2.1.7 ] | |
| netscout_pfs_switch_interface_out_MulticastOctets | NetScout PFS Switch Interface Out Multicast Octets | bps | Monitors the total number of octets transmitted that were directed to a multicast address. [ NTCT-PFS-HEALTH-MIB :: nphIfExtOutMulticastOctets : 1.3.6.1.4.1.21671.3.2.1.2.2.1.21 ] | |
| netscout_pfs_switch_interface_out_UnicastOctets | NetScout PFS Switch Interface Out Unicast Octets | bps | Monitors the total number of octets transmitted that were directed to a unicast address. [ NTCT-PFS-HEALTH-MIB :: nphIfExtOutUcastOctets : 1.3.6.1.4.1.21671.3.2.1.2.2.1.24 ] | |
| netscout_pfs_switch_interface_out_BroadcastOctets | NetScout PFS Switch Interface Out Broadcast Octets | bps | Monitors the total number of good octets transmitted which were addressed to a broadcast address at this sub-layer. [ NTCT-PFS-HEALTH-MIB :: nphIfExtOutBroadcastOctets : 1.3.6.1.4.1.21671.3.2.1.2.2.1.25 ] | |
| netscout_pfs_switch_interface_octets_out_Rate | NetScout PFS Switch Interface Octets Out Rate | bps | Monitors the total number of octets trasmitted through an interface. [ NTCT-PFS-HEALTH-MIB :: nphIfExtOutMulticastOctets : 1.3.6.1.4.1.21671.3.2.1.2.2.1.21 , nphIfExtOutUcastOctets : 1.3.6.1.4.1.21671.3.2.1.2.2.1.24 , nphIfExtOutBroadcastOctets : 1.3.6.1.4.1.21671.3.2.1.2.2.1.25 ] | |
| netscout_pfs_switch_interface_out_DropPackets | NetScout PFS Switch Interface Out Drop Packets | packets/sec | Monitors the total number of packets transmitted that were dropped due to buffer overflow. [ NTCT-PFS-HEALTH-MIB :: nphIfExtOutDropPkts : 1.3.6.1.4.1.21671.3.2.1.2.2.1.26 ] | |
| netscout_pfs_switch_interface_out_packets_Runts | NetScout PFS Switch Interface Out Packets Runts | packets/sec | Monitors the total number of packets runts transmitted through an interface. [ NTCT-PFS-HEALTH-MIB :: nphIfExtOutUndersizePkts : 1.3.6.1.4.1.21671.3.2.1.2.2.1.40 ] | |
| netscout_pfs_switch_interface_out_packets_Giants | NetScout PFS Switch Interface Out Packets Giants | packets/sec | Monitors the total number of packets giants transmitted through an interface. [ NTCT-PFS-HEALTH-MIB :: nphIfExtOutOversizePkts : 1.3.6.1.4.1.21671.3.2.1.2.2.1.41 ] | |
| NETSCOUT PFS Switch - Interface | netscout_pfs_switch_interface_in_Throughput | NetScout PFS Switch Interface In Throughput | Mbps | Monitors the throughput in Mbps received on the given interface. [ NTCT-PFS-HEALTH-MIB :: nphIfExtInThroughput : 1.3.6.1.4.1.21671.3.2.1.2.2.1.52 ] |
| netscout_pfs_switch_interface_out_Throughput | NetScout PFS Switch Interface Out Throughput | Mbps | Monitors the throughput in Mbps transmitted from the given interface. [ NTCT-PFS-HEALTH-MIB :: nphIfExtOutThroughput : 1.3.6.1.4.1.21671.3.2.1.2.2.1.54 ] |
Nginx Performance Template
Description
Nginx Performance Template
Prerequisites
No prerequisite
Supported Metric
| Monitor Name | Metric Name | Metric Display Name | Unit | Description |
|---|---|---|---|---|
| Nginx Performance Monitor | nginx.connections.active | Nginx Active Connections | NULL | Number of all open connections including connections to backends |
| nginx.connections.reading | Nginx Reading Connections | NULL | Nginx reads the request header | |
| nginx.connections.writing | Nginx Writing Connections | NULL | Nginx reads the request body, processes the request or writes response to a client | |
| nginx.connections.waiting | Nginx Waiting Connections | NULL | Keep-alive connections, actually it will be active - (reading + writing) | |
| nginx.requests.handled | Nginx Requests Handled | NULL | The number of requests served by connections handled by Nginx | |
| nginx.requests_rate | Nginx Requests Rate PerSec | Req per Sec | Average number of requests per second | |
| nginx.connections_rate | Nginx Connections Rate PerSec | Average number of connections per second | ||
| nginx.perconnections_requests | Nginx Requests Per Connection | NULL | Average number of requests per connection. |
Nginx Statistics - v2
Description
Nginx Statistics
Prerequisites
NULL
Supported Metric
| Monitor Name | Metric Name | Metric Display Name | Unit | Description |
|---|---|---|---|---|
| Nginx Statistics - v2 | nginx.connections_rate | Nginx Connections Rate PerSec | NULL | Average number of connections per second |
| nginx.connections.waiting | Nginx Waiting Connections | NULL | Keep-alive connections, actually it will be active - (reading + writing) | |
| nginx.connections.writing | Nginx Writing Connections | NULL | Nginx reads the request body, processes the request or writes response to a client | |
| nginx.requests.handled | Nginx Requests Handled | NULL | The number of requests served by connections handled by Nginx | |
| nginx.requests_rate | Nginx Requests Rate PerSec | Req per Sec | Average number of requests per second | |
| nginx.connections.reading | Nginx Reading Connections | NULL | Nginx reads the request header | |
| nginx.response.time | Nginx-ResponseTime | ms | Time taken for Nginx request-response. | |
| nginx.perconnections_requests | Nginx Requests Per Connection | NULL | Average number of requests per connection. | |
| nginx.connections.active | Nginx Active Connections | NULL | Number of all open connections including connections to backends |
Nimble Storage - Performance
Description
Template to monitor Nimble Storage performance metrics like volume IOPS, global IOPS , Volume online status, volume iSCSI connections, volume disk usage, volume snapshot usage, volume usage, system uptime etc. Validated on Nimble Storage software version 5.0.7.300-644174-opt. sysObjectID : 1.3.6.1.4.1.37447.3.1
Prerequisites
No prerequisite
Supported Metric
| Monitor Name | Metric Name | Metric Display Name | Unit | Description |
|---|---|---|---|---|
| Nimble Storage - Global IOPS | nimble.storage.io.seq.read.bytes | I/O Seq Read Bytes | Bps | It monitors the number of Sequential Read I/O bytes.[NIMBLE-MIB::ioSeqReadBytes:1.3.6.1.4.1.37447.1.3.9.0] |
| nimble.storage.io.reads | I/O Reads | rps | It monitors the total cumulative number of read I/Os (sequential and random).[NIMBLE-MIB::ioReads:1.3.6.1.4.1.37447.1.3.2.0]. | |
| nimble.storage.io.seq.write.bytes | I/O Seq Write Bytes | Bps | It monitors the number of Sequential Write I/O bytes.[NIMBLE-MIB::ioSeqWriteBytes:1.3.6.1.4.1.37447.1.3.11.0] | |
| nimble.storage.io.writes | I/O Writes | wps | It monitors the total cumulative number of Write I/Os.[NIMBLE-MIB::ioWrites:1.3.6.1.4.1.37447.1.3.4.0]. | |
| nimble.storage.io.seq.reads | I/O Seq reads | rps | It monitors the total Number of Sequential Read I/O operations.[NIMBLE-MIB::ioSeqReads:1.3.6.1.4.1.37447.1.3.3.0] | |
| nimble.storage.io.write.bytes | I/O Write Bytes | Bps | It monitors the total cumulative number of Write I/O bytes (sequential and random).[NIMBLE-MIB::ioWriteBytes:1.3.6.1.4.1.37447.1.3.10.0]. | |
| nimble.storage.io.read.bytes | I/O Read Bytes | Bps | It monitors the total cumulative number of Read I/O bytes (sequential and random).[NIMBLE-MIB::ioReadBytes:1.3.6.1.4.1.37447.1.3.8.0]. | |
| nimble.storage.io.seq.writes | I/O Seq Writes | wps | It monitors the total Number of Sequential Write I/O operations.[NIMBLE-MIB::ioSeqWrites:1.3.6.1.4.1.37447.1.3.5.0]. | |
| Nimble Storage - Volume | nimble.storage.vol.utilization | Volume Utilization (%) | % | It monitors the volume utilization in percentage.[NIMBLE-MIB::volSizeHigh:1.3.6.1.4.1.37447.1.2.1.5,volSizeLow:1.3.6.1.4.1.37447.1.2.1.4,volUsageLow:1.3.6.1.4.1.37447.1.2.1.6,volUsageHigh:1.3.6.1.4.1.37447.1.2.1.7]. |
| nimble.storage.vol.disk.vol.size.used | Volume Disk Used(GB) - Volume | GB | It monitors the used size on disk for volumes in GB.[NIMBLE-MIB::volDiskVolBytesUsedLow:1.3.6.1.4.1.37447.1.2.1.52,volDiskVolBytesUsedHigh:1.3.6.1.4.1.37447.1.2.1.53]. | |
| nimble.storage.vol.size.total | Volume Total (GB) | GB | It monitors the total volume in GB.[NIMBLE-MIB::volSizeHigh:1.3.6.1.4.1.37447.1.2.1.5, volSizeLow:1.3.6.1.4.1.37447.1.2.1.4]. | |
| nimble.storage.vol.disk.snap.size.used | Volume Disk Used(GB) - Snapshots | GB | It monitors the used size on disk for snapshots in GB [NIMBLE-MIB::volDiskSnapBytesUsedLow:1.3.6.1.4.1.37447.1.2.1.54,volDiskSnapBytesUsedHigh:1.3.6.1.4.1.37447.1.2.1.55]. | |
| nimble.storage.vol.size.used | Volume Used (GB) | GB | It monitors the volume used size in GB.[NIMBLE-MIB::volUsageLow:1.3.6.1.4.1.37447.1.2.1.6,volUsageHigh:1.3.6.1.4.1.37447.1.2.1.7]. | |
| nimble.storage.vol.num.con | Volume Connections | count | It monitors the number of iSCSI connections to the volume.[NIMBLE-MIB::volNumConnections:1.3.6.1.4.1.37447.1.2.1.11]. | |
| nimble.storage.vol.online | Volume Online | It monitors whether the volume is online or not. Possible values are true(1), false(2).[NIMBLE-MIB::volOnline:1.3.6.1.4.1.37447.1.2.1.10]. | ||
| Nimble Storage - Volume IOPS | nimble.storage.vol.io.reads | Volume I/O Reads | rps | It monitors the total cumulative number of Read I/Os (sequential and random).[NIMBLE-MIB::volIoReads:1.3.6.1.4.1.37447.1.2.1.13]. |
| nimble.storage.vol.io.non.seq.read.ssd.hits | Volume I/O Non Seq Read SSD Hits | hps | It monitors the total number of Nonsequential Read I/O hits to SSD.[NIMBLE-MIB::volIoNonseqReadSSDHits:1.3.6.1.4.1.37447.1.2.1.20]. | |
| nimble.storage.vol.io.seq.reads | Volume I/O Seq Reads | rps | It monitors the total Number of Sequential Read I/O operations.[NIMBLE-MIB::volIoSeqReads:1.3.6.1.4.1.37447.1.2.1.16]. | |
| nimble.storage.vol.io.non.seq.read.mem.hits | Volume I/O Non Seq Read Mem Hits | hps | It monitors the total number of Nonsequential Read I/O hits to Memory.[NIMBLE-MIB::volIoNonseqReadMemHits:1.3.6.1.4.1.37447.1.2.1.19]. | |
| nimble.storage.vol.io.seq.write.bytes | Volume I/O Seq Write Bytes | Bps | It monitors the number of Sequential Write I/O bytes.[NIMBLE-MIB::volIoSeqWriteBytes:1.3.6.1.4.1.37447.1.2.1.38]. | |
| nimble.storage.vol.io.non.seq.read.total.hits | Volume I/O Non Seq Read Total Hits | hps | It monitors the total number of Nonsequential Read I/O hits (to Memory and SSD).[NIMBLE-MIB::volIoNonseqReadTotalHits:1.3.6.1.4.1.37447.1.2.1.18]. | |
| nimble.storage.vol.io.seq.read.bytes | Volume I/O Seq Read bytes | Bps | It monitors the total cumulative number of Sequential Read I/O bytes.[NIMBLE-MIB::volIoSeqReadBytes:1.3.6.1.4.1.37447.1.2.1.17]. | |
| nimble.storage.vol.io.seq.writes | Volume I/O Seq Writes | wps | It monitors the total Number of Sequential Write I/O operations.[NIMBLE-MIB::volIoSeqWrites:1.3.6.1.4.1.37447.1.2.1.37]. | |
| nimble.storage.vol.io.write.bytes | Volume I/O Write Bytes | Bps | It monitors the total cumulative number of Write I/O bytes (sequential and random).[NIMBLE-MIB::volIoWriteBytes:1.3.6.1.4.1.37447.1.2.1.36] | |
| nimble.storage.vol.io.writes | Volume I/O Writes | wps | It monitors the total cumulative number of Write I/Os.[NIMBLE-MIB::volIoWrites:1.3.6.1.4.1.37447.1.2.1.34]. | |
| nimble.storage.vol.io.read.bytes | Volume I/O Read Bytes | Bps | It monitors the total cumulative number of Read I/O bytes (sequential and random).[NIMBLE-MIB::volIoReadBytes:1.3.6.1.4.1.37447.1.2.1.15]. | |
| System Uptime | system.uptime | System Uptime | s | The time since the SNMP agent in the system was last re-initialized.[OID : 1.3.6.1.2.1.1.3.0] |
Nokia Timetra - Fan & Power Supply
Description
Monitors the Nokia Timetra Fan and Power Supply. [TIMETRA-CHASSIS-MIB :: tmnxChassisFanOperStatus : 1.3.6.1.4.1.6527.3.1.2.2.1.4.1.2 , tmnxChassisFanSpeed : 1.3.6.1.4.1.6527.3.1.2.2.1.4.1.3 , tmnxChassisPowerSupplyACStatus : 1.3.6.1.4.1.6527.3.1.2.2.1.5.1.2 , tmnxChassisPowerSupplyDCStatus : 1.3.6.1.4.1.6527.3.1.2.2.1.5.1.3 , tmnxChassisPowerSupplyTempStatus : 1.3.6.1.4.1.6527.3.1.2.2.1.5.1.4 , tmnxChassisPowerSupply1Status : 1.3.6.1.4.1.6527.3.1.2.2.1.5.1.6 , tmnxChassisPowerSupply2Status : 1.3.6.1.4.1.6527.3.1.2.2.1.5.1.7 , tmnxChassisPowerSupplyInputStatus : 1.3.6.1.4.1.6527.3.1.2.2.1.5.1.9 , tmnxChassisPowerSupplyOutputStatus : 1.3.6.1.4.1.6527.3.1.2.2.1.5.1.10 ]
Prerequisites
No prerequisite
Supported Metric
| Monitor Name | Metric Name | Metric Display Name | Unit | Description |
|---|---|---|---|---|
| Nokia Timetra - Fan Status | nokia_timetra_TmnxChassisFanOperStatus | Nokia Timetra Chassis Fan Operation Status | Monitors the Nokia Timetra Chassis Fan Operation Status.[TIMETRA-CHASSIS-MIB :: tmnxChassisFanOperStatus : 1.3.6.1.4.1.6527.3.1.2.2.1.4.1.2 ] Possible values are : 1 : deviceStateUnknown , 2 : deviceNotEquipped , 3 : deviceStateOk , 4 : deviceStateFailed , 5 : deviceStateOutOfService. | |
| nokia_timetra_TmnxChassisFanSpeed | Nokia Timetra Chassis Fan Speed | Monitors the Nokia Timetra Fan Speed.[TIMETRA-CHASSIS-MIB :: tmnxChassisFanSpeed : 1.3.6.1.4.1.6527.3.1.2.2.1.4.1.3 ] Possible values are : 0 : notApplicable , 1 : unknown , 2 : halfSpeed , 3 : fullSpeed , 4 : lowSpeed. | ||
| Nokia Timetra - Power Supply | nokia_timetra_TmnxChassisPowerSupplyTempStatus | Nokia Timetra Chassis PowerSupply Temperature Status | Monitors the Nokia Timetra Chassis PowerSupply Temperature Status. [TIMETRA-CHASSIS-MIB :: tmnxChassisPowerSupplyTempStatus : 1.3.6.1.4.1.6527.3.1.2.2.1.5.1.4] Possible values are : 1 : deviceStateUnknown , 2 : deviceNotEquipped , 3 : deviceStateOk , 4 : deviceStateFailed , 5 : deviceStateOutOfService. | |
| nokia_timetra_TmnxChassisPowerSupplyInputStatus | Nokia Timetra Chassis PowerSupply Input Status | Monitors the Nokia Timetra Chassis PowerSupply Input Status. [TIMETRA-CHASSIS-MIB :: tmnxChassisPowerSupplyInputStatus : 1.3.6.1.4.1.6527.3.1.2.2.1.5.1.9 ] Possible values are : 1 : deviceStateUnknown , 2 : deviceNotEquipped , 3 : deviceStateOk , 4 : deviceStateFailed , 5 : deviceStateOutOfService. | ||
| nokia_timetra_TmnxChassisPowerSupplyOutputStatus | Nokia Timetra Chassis PowerSupply Output Status | Monitors the Nokia Timetra Chassis PowerSupply Output Status. [TIMETRA-CHASSIS-MIB :: tmnxChassisPowerSupplyOutputStatus : 1.3.6.1.4.1.6527.3.1.2.2.1.5.1.10 ] Possible values are : 1 : deviceStateUnknown , 2 : deviceNotEquipped , 3 : deviceStateOk , 4 : deviceStateFailed , 5 : deviceStateOutOfService. | ||
| nokia_timetra_TmnxChassisPowerSupply1Status | Nokia Timetra Chassis PowerSupply1 Status | Monitors the Nokia Timetra Chassis PowerSupply1 Status. [TIMETRA-CHASSIS-MIB :: tmnxChassisPowerSupply1Status : 1.3.6.1.4.1.6527.3.1.2.2.1.5.1.6 ] Possible values are : 1 : deviceStateUnknown , 2 : deviceNotEquipped , 3 : deviceStateOk , 4 : deviceStateFailed , 5 : deviceStateOutOfService. | ||
| nokia_timetra_TmnxChassisPowerSupplyDCStatus | Nokia Timetra Chassis PowerSupply DC Status | Monitors the Nokia Timetra Chassis PowerSupply DC Status. [TIMETRA-CHASSIS-MIB :: tmnxChassisPowerSupplyDCStatus : 1.3.6.1.4.1.6527.3.1.2.2.1.5.1.3 ] Possible values are : 1 : deviceStateUnknown , 2 : deviceNotEquipped , 3 : deviceStateOk , 4 : deviceStateFailed , 5 : deviceStateOutOfService. | ||
| nokia_timetra_TmnxChassisPowerSupplyACStatus | Nokia Timetra Chassis PowerSupply AC Status | Monitors the Nokia Timetra Chassis PowerSupply AC Status. [TIMETRA-CHASSIS-MIB :: tmnxChassisPowerSupplyACStatus : 1.3.6.1.4.1.6527.3.1.2.2.1.5.1.2 ] Possible values are : 1 : deviceStateUnknown , 2 : deviceNotEquipped , 3 : deviceStateOk , 4 : deviceStateFailed , 5 : deviceStateOutOfService. | ||
| nokia_timetra_TmnxChassisPowerSupply2Status | Nokia Timetra Chassis PowerSupply2 Status | Monitors the Nokia Timetra Chassis PowerSupply2 Status. [TIMETRA-CHASSIS-MIB :: tmnxChassisPowerSupply2Status : 1.3.6.1.4.1.6527.3.1.2.2.1.5.1.7 ] Possible values are : 1 : deviceStateUnknown , 2 : deviceNotEquipped , 3 : deviceStateOk , 4 : deviceStateFailed , 5 : deviceStateOutOfService. |
Nokia Timetra - Hardware
Description
Monitors the Nokia Timetra Hardware Statistics. [TIMETRA-CHASSIS-MIB :: tmnxHwAdminState : 1.3.6.1.4.1.6527.3.1.2.2.1.8.1.15 , tmnxHwOperState : 1.3.6.1.4.1.6527.3.1.2.2.1.8.1.16 , tmnxHwTemperature : 1.3.6.1.4.1.6527.3.1.2.2.1.8.1.18 ]
Prerequisites
No prerequisite
Supported Metric
| Monitor Name | Metric Name | Metric Display Name | Unit | Description |
|---|---|---|---|---|
| Nokia Timetra - Hardware Statistics | nokia_timetra_TmnxHwTemperature | Nokia Timetra Hardware Temperature | Celsius | Monitors the Nokia Timetra Hardware Temperature. [TIMETRA-CHASSIS-MIB :: tmnxHwTemperature : 1.3.6.1.4.1.6527.3.1.2.2.1.8.1.18 ] |
| nokia_timetra_TmnxHwOperState | Nokia Timetra Hardware Operation State | Monitors the Nokia Timetra Tmnx Hardware Operation State. [TIMETRA-CHASSIS-MIB :: tmnxHwOperState : 1.3.6.1.4.1.6527.3.1.2.2.1.8.1.16 ] \nPossible values are : 1 : unknown , 2 : inService , 3 : outOfService , 4 : diagnosing , 5 : failed , 6 : booting , 7 : empty , 8 : provisioned , 9 : unprovisioned , 10 : upgrade , 11 : downgrade , 12 : inServiceUpgrade , 13 : inServiceDowngrade , 14 : resetPending , 15 : softReset. | ||
| nokia_timetra_TmnxHwAdminState | Nokia Timetra Hardware Administrative State | Monitors the Nokia Timetra Hardware Administrative State.[TIMETRA-CHASSIS-MIB :: tmnxHwAdminState : 1.3.6.1.4.1.6527.3.1.2.2.1.8.1.15] Possible values are : 1 : noop , 2 : inService , 3 : outOfService , 4 : diagnose , 5 : operateSwitch. |
Nokia Timetra - Performance
Description
Monitors the Nokia Timetra CPU and Memory Utilization. [TIMETRA-SYSTEM-MIB :: sgiCpuUsage : 1.3.6.1.4.1.6527.3.1.2.1.1.1.0 , sgiKbMemoryUsed : 1.3.6.1.4.1.6527.3.1.2.1.1.9.0 , sgiKbMemoryAvailable : 1.3.6.1.4.1.6527.3.1.2.1.1.10.0 ]
Prerequisites
No prerequisite
Supported Metric
| Monitor Name | Metric Name | Metric Display Name | Unit | Description |
|---|---|---|---|---|
| Nokia Timetra - System Performance | nokia_timetra_SgiKbMemoryUsed | Nokia Timetra Memory Used | KB | Monitors the Nokia Timetra Memory Used.\n[TIMETRA-SYSTEM-MIB :: sgiKbMemoryUsed : 1.3.6.1.4.1.6527.3.1.2.1.1.9.0 ] |
| nokia_timetra_SgiKbMemoryAvailable | Nokia Timetra Memory Available | KB | Monitors the Nokia Timetra Memory Available.[TIMETRA-SYSTEM-MIB :: sgiKbMemoryAvailable : 1.3.6.1.4.1.6527.3.1.2.1.1.10.0 ] | |
| nokia_timetra_SgiCpuUsage | Nokia Timetra Cpu Usage | % | Monitors the Nokia Timetra CPU Utilization.[TIMETRA-SYSTEM-MIB :: sgiCpuUsage : 1.3.6.1.4.1.6527.3.1.2.1.1.1.0 ] | |
| nokia_timetra_MemoryUtilization | Nokia Timetra Memory Utilization | % | Monitors the Nokia Timetra Memory Utilization. [TIMETRA-SYSTEM-MIB :: sgiKbMemoryUsed : 1.3.6.1.4.1.6527.3.1.2.1.1.9.0 , sgiKbMemoryAvailable : 1.3.6.1.4.1.6527.3.1.2.1.1.10.0 ] |
NTP Offset - SNMP Extended
Description
Monitoring delay in seconds
Prerequisites
No prerequisite
Supported Metric
| Monitor Name | Metric Name | Metric Display Name | Unit | Description |
|---|---|---|---|---|
| NTP Offset - SNMP Extended | ntp_offset_snmp | Ntp Offset | s | The time difference between the local clock and the NTP reference clock. |
Nutanix Cluster Performance
Description
Nutanix Cluster Performance
Prerequisites
No prerequisite
Supported Metric
| Monitor Name | Metric Name | Metric Display Name | Unit | Description |
|---|---|---|---|---|
| Nutanix Cluster Performance | nutanix.num.read.iops | Num Read IOps | NULL | Num Read IOps |
| nutanix.controller.num.iops | Controller Num IOps | NULL | Controller Num IOps | |
| nutanix.num.write.iops | Num Write IOps | NULL | Num Write IOps | |
| nutanix.data_reduction.overall.saving_ratio_ppm | Data Reduction Overall Saving RatIO PPM | NULL | Data Reduction Overall Saving RatIO PPM | |
| nutanix.storage.capacity_bytes | Storage Capacity Bytes | NULL | Storage Capacity Bytes | |
| nutanix.storage.free_bytes | Storage Free Bytes | NULL | Storage Free Bytes |
Nutanix Cluster Performance Extended
Description
Extended template for Nutanix Cluster Performance monitoring. This template validated against Nutanix API Version : v1 and supported Gateway versions – 8.0.0 and above.
Prerequisites
No prerequisite
Supported Metric
| Monitor Name | Metric Name | Metric Display Name | Unit | Description |
|---|---|---|---|---|
| Nutanix Cluster Performance | nutanix.content.cache.physical.memory.usage.bytes | Content Cache Physical Memory Usage Bytes | NULL | Content Cache Physical Memory Usage Bytes |
| nutanix.controller.total.io.time.usecs | Controller Total IO Time Usecs | NULL | Controller Total IO Time Usecs | |
| nutanix.storage_tier.das-sata.capacity_bytes | Storage Tier Das-sata Capacity Bytes | NULL | Storage Tier Das-sata Capacity Bytes | |
| nutanix.hypervisor.kvm.cpu.usage.ppm | Hypervisor KVM CPU Usage ppm | NULL | Hypervisor KVM CPU Usage ppm | |
| nutanix.data_reduction.clone.saved_bytes | Data Reduction Clone Saved Bytes | NULL | Data Reduction Clone Saved Bytes | |
| nutanix.controller.num.read.iops | Controller Num Read IOps | NULL | Controller Num Read IOps | |
| nutanix.num.iops | Num IOps | NULL | Num IOps | |
| nutanix.storage.reserved_free_bytes | Storage Reserved Free Bytes | NULL | Storage Reserved Free Bytes | |
| nutanix.storage_tier.das-sata.free_bytes | Storage Tier Das-sata Free Bytes | NULL | Storage Tier Das-sata Free Bytes | |
| nutanix.hypervisor.num.read.iops | Hypervisor Num Read IOPS | NULL | Hypervisor Num Read IOPS | |
| nutanix.controller.read.io.bandwidth.kBps | Controller Read IO Bandwidth KBps | NULL | Controller Read IO Bandwidth KBps | |
| nutanix.storage.logical_usage_bytes | Storage Logical Usage Bytes | NULL | Storage Logical Usage Bytes | |
| nutanix.storage_tier.ssd.pinned_usage_bytes | Storage Tier SSD Pinned Usage Bytes | NULL | Storage Tier SSD Pinned Usage Bytes | |
| nutanix.storage.reserved_usage_bytes | Storage Reserved Usage Bytes | NULL | Storage Reserved Usage Bytes | |
| nutanix.data_reduction.compression.pre_reduction_bytes | Data Reduction Compression Pre Reduction Bytes | NULL | Data Reduction Compression Pre Reduction Bytes | |
| nutanix.total.read.io.time.usecs | Total Read IO Time Usecs | NULL | Total Read IO Time Usecs | |
| nutanix.total.io.size.kbytes | Total IO Size KBytes | NULL | Total IO Size KBytes | |
| nutanix.controller.total.read.io.time.usecs | Controller Total Read IO Time Usecs | NULL | Controller Total Read IO Time Usecs | |
| nutanix.data_reduction.thin_provision.saving_ratio_ppm | Data Reduction Thin Provision Saving RatIO PPM | NULL | Data Reduction Thin Provision Saving RatIO PPM | |
| nutanix.controller.num.random.io | Controller Num Random IO | NULL | Controller Num Random IO | |
| nutanix.hypervisor.num.io | Hypervisor Num IO | NULL | Hypervisor Num IO | |
| nutanix.controller.io.bandwidth.kBps | Controller IO Bandwidth KBps | NULL | Controller IO Bandwidth KBps | |
| nutanix.data_reduction.erasure_coding.pre_reduction_bytes | Data Reduction Erasure Coding Pre Reduction Bytes | NULL | Data Reduction Erasure Coding Pre Reduction Bytes | |
| nutanix.hypervisor.avg.write.io.latency.usecs | Hypervisor Avg Write IO Latency Usecs | NULL | Hypervisor Avg Write IO Latency Usecs | |
| nutanix.data_reduction.dedup.saved_bytes | Data Reduction Dedup Saved Bytes | NULL | Data Reduction Dedup Saved Bytes | |
| nutanix.hypervisor.write.io.bandwidth.kBps | Hypervisor Write IO Bandwidth KBps | NULL | Hypervisor Write IO Bandwidth KBps | |
| nutanix.content.cache.physical.ssd.usage.bytes | Content Cache Physical SSD Usage Bytes | NULL | Content Cache Physical SSD Usage Bytes | |
| nutanix.data_reduction.dedup.post_reduction_bytes | Data Reduction Dedup Post Reduction Bytes | NULL | Data Reduction Dedup Post Reduction Bytes | |
| nutanix.timespan.usecs | Timespan Usecs | NULL | Timespan Usecs | |
| nutanix.hypervisor.hyperv.cpu.usage.ppm | Hypervisor Hyperv CPU Usage ppm | NULL | Hypervisor Hyperv CPU Usage ppm | |
| nutanix.write.io.ppm | Write IO PPM | NULL | Write IO PPM | |
| nutanix.seq.io.ppm | Seq IO PPM | NULL | Seq IO PPM | |
| nutanix.data_reduction.saving_ratio_ppm | Data Reduction Saving RatIO PPM | NULL | Data Reduction Saving RatIO PPM | |
| nutanix.storage.usage_bytes | Storage Usage Bytes | NULL | Storage Usage Bytes | |
| nutanix.controller.avg.write.io.size.kbytes | Controller Avg Write IO Size KBytes | NULL | Controller Avg Write IO Size KBytes | |
| nutanix.replication.received.bandwidth.kBps | Replication Received Bandwidth KBps | NULL | Replication Received Bandwidth KBps | |
| nutanix.data_reduction.dedup.saving_ratio_ppm | Data Reduction Dedup Saving RatIO PPM | NULL | Data Reduction Dedup Saving RatIO PPM | |
| nutanix.storage_tier.ssd.usage_bytes | Storage Tier SSD Usage Bytes | NULL | Storage Tier SSD Usage Bytes | |
| nutanix.content.cache.hit.ppm | Content Cache Hit PPM | NULL | Content Cache Hit PPM | |
| nutanix.controller.write.io.bandwidth.kBps | Controller Write IO Bandwidth KBps | NULL | Controller Write IO Bandwidth KBps | |
| nutanix.hypervisor.timespan.usecs | Hypervisor Timespan Usecs | NULL | Hypervisor Timespan Usecs | |
| nutanix.storage_tier.das-sata.pinned_bytes | Storage Tier Das-sata Pinned Bytes | NULL | Storage Tier Das-sata Pinned Bytes | |
| nutanix.total.untransformed.usage.bytes | Total Untransformed Usage Bytes | NULL | Total Untransformed Usage Bytes | |
| nutanix.controller.write.io.ppm | Controller Write IO ppm | NULL | Controller Write IO ppm | |
| nutanix.controller.read.io.ppm | Controller Read IO PPM | NULL | Controller Read IO PPM | |
| nutanix.num.read.io | Num Read IO | NULL | Num Read IO | |
| nutanix.hypervisor.total.read.io.time.usecs | Hypervisor Total Read IO Time Usecs | NULL | Hypervisor Total Read IO Time Usecs | |
| nutanix.data_reduction.compression.saved_bytes | Data Reduction Compression Saved Bytes | NULL | Data Reduction Compression Saved Bytes | |
| nutanix.hypervisor.esx.cpu.usage.ppm | Hypervisor ESX CPU Usage ppm | NULL | Hypervisor ESX CPU Usage ppm | |
| nutanix.hypervisor.esx.memory.usage.ppm | Hypervisor ESX Memory Usage ppm | NULL | Hypervisor ESX Memory Usage ppm | |
| nutanix.storage_tier.ssd.free_bytes | Storage Tier SSD Free Bytes | NULL | Storage Tier SSD Free Bytes | |
| nutanix.content.cache.saved.memory.usage.bytes | Content Cache Saved Memory Usage Bytes | NULL | Content Cache Saved Memory Usage Bytes | |
| nutanix.io.bandwidth.kBps | IO Bandwidth KBps | NULL | IO Bandwidth KBps | |
| nutanix.content.cache.num.hits | Content Cache Num Hits | NULL | Content Cache Num Hits | |
| nutanix.content.cache.num.dedup.ref.count.pph | Content Cache Num Dedup Ref Count Pph | NULL | Content Cache Num Dedup Ref Count Pph | |
| nutanix.hypervisor.num.write.iops | Hypervisor Num Write IOps | NULL | Hypervisor Num Write IOps | |
| nutanix.data_reduction.erasure_coding.saving_ratio_ppm | Data Reduction Erasure Coding Saving RatIO PPM | NULL | Data Reduction Erasure Coding Saving RatIO PPM | |
| nutanix.replication.num.transmitted.bytes | Replication Num Transmitted Bytes | NULL | Replication Num Transmitted Bytes | |
| nutanix.controller.avg.io.latency.usecs | Controller Avg IO Latency Usecs | NULL | Controller Avg IO Latency Usecs | |
| nutanix.controller.timespan.usecs | Controller Timespan Usecs | NULL | Controller Timespan Usecs | |
| nutanix.controller.total.io.size.kbytes | Controller Total IO Size KBytes | NULL | Controller Total IO Size KBytes | |
| nutanix.hypervisor.total.io.size.kbytes | Hypervisor Total IO Size KBytes | NULL | Hypervisor Total IO Size KBytes | |
| nutanix.data_reduction.dedup.pre_reduction_bytes | Data Reduction Dedup Pre Reduction Bytes | NULL | Data Reduction Dedup Pre Reduction Bytes | |
| nutanix.hypervisor.total.read.io.size.kbytes | Hypervisor Total Read IO Size K Bytes | NULL | Hypervisor Total Read IO Size K Bytes | |
| nutanix.controller.avg.read.io.size.kbytes | Controller Avg Read IO Size K Bytes | NULL | Controller Avg Read IO Size K Bytes | |
| nutanix.hypervisor.avg.read.io.latency.usecs | Hypervisor Avg Read IO Latency Usecs | NULL | Hypervisor Avg Read IO Latency Usecs | |
| nutanix.data_reduction.compression.saving_ratio_ppm | Data Reduction Compression Saving Ratio PPM | NULL | Data Reduction Compression Saving Ratio PPM | |
| nutanix.num.write.io | Num Write IO | NULL | Num Write IO | |
| nutanix.content.cache.logical.memory.usage.bytes | Content Cache Logical Memory Usage Bytes | NULL | Content Cache Logical Memory Usage Bytes | |
| nutanix.hypervisor.read.io.bandwidth.kBps | Hypervisor Read IO Bandwidth KBps | NULL | Hypervisor Read IO Bandwidth KBps | |
| nutanix.controller.seq.io.ppm | Controller Seq IO PPM | NULL | Controller Seq IO PPM | |
| nutanix.read.io.ppm | Read IO PPM | NULL | Read IO PPM | |
| nutanix.avg.read.io.latency.usecs | Avg Read IO Latency Usecs | NULL | Avg Read IO Latency Usecs | |
| nutanix.write.io.bandwidth.kBps | Write IO Bandwidth KBps | NULL | Write IO Bandwidth KBps | |
| nutanix.random.io.ppm | random IO PPM | NULL | random IO PPM | |
| nutanix.data_reduction.compression.post_reduction_bytes | Data Reduction Compression Post Reduction Bytes | NULL | Data Reduction Compression Post Reduction Bytes | |
| nutanix.data_reduction.thin_provision.saved_bytes | Data Reduction Thin Provision Saved Bytes | NULL | Data Reduction Thin Provision Saved Bytes | |
| nutanix.content.cache.saved.ssd.usage.bytes | Content Cache Saved SSD Usage Bytes | NULL | Content Cache Saved SSD Usage Bytes | |
| nutanix.data_reduction.pre_reduction_bytes | Data Reduction Pre Reduction Bytes | NULL | Data Reduction Pre Reduction Bytes | |
| nutanix.read.io.bandwidth.kBps | Read IO Bandwidth KBps | NULL | Read IO Bandwidth KBps | |
| nutanix.data_reduction.erasure_coding.saved_bytes | Data Reduction Erasure Coding Saved Bytes | NULL | Data Reduction Erasure Coding Saved Bytes | |
| nutanix.storage.reserved_capacity_bytes | Storage Reserved Capacity Bytes | NULL | Storage Reserved Capacity Bytes | |
| nutanix.controller.total.read.io.size.kbytes | Controller Total Read IO Size KBytes | NULL | Controller Total Read IO Size KBytes | |
| nutanix.hypervisor.num.iops | Hypervisor Num IOps | NULL | Hypervisor Num IOps | |
| nutanix.hypervisor.total.io.time.usecs | Hypervisor Total IO Time Usecs | NULL | Hypervisor Total IO Time Usecs | |
| nutanix.num.random.io | Num Random IO | NULL | Num Random IO | |
| nutanix.controller.num.write.iops | Controller Num Write IOps | NULL | Controller Num Write IOps | |
| nutanix.controller.num.seq.io | Controller Num Seq IO | NULL | Controller Num Seq IO | |
| nutanix.storage_tier.das-sata.pinned_usage_bytes | Storage Tier Das-sata Pinned Usage Bytes | NULL | Storage Tier Das-sata Pinned Usage Bytes | |
| nutanix.storage_tier.ssd.pinned_bytes | Storage Tier SSD Pinned Bytes | NULL | Storage Tier SSD Pinned Bytes | |
| nutanix.total.io.time.usecs | Total IO Time Usecs | NULL | Total IO Time Usecs | |
| nutanix.hypervisor.io.bandwidth.kBps | Hypervisor IO Bandwidth KBps | NULL | Hypervisor IO Bandwidth KBps | |
| nutanix.controller.num.write.io | Controller Num Write IO | NULL | Controller Num Write IO | |
| nutanix.num.io | Num io | NULL | Num io | |
| nutanix.hypervisor.hyperv.memory.usage.ppm | Hypervisor Hyperv Memory Usage ppm | NULL | Hypervisor Hyperv Memory Usage ppm | |
| nutanix.data_reduction.clone.saving_ratio_ppm | Data Reduction Clone Saving RatIO PPM | NULL | Data Reduction Clone Saving RatIO PPM | |
| nutanix.replication.transmitted.bandwidth.kBps | Replication Transmitted Bandwidth KBps | NULL | Replication Transmitted Bandwidth KBps | |
| nutanix.controller.avg.write.io.latency.usecs | Controller Avg Write IO Latency Usecs | NULL | Controller Avg Write IO Latency Usecs | |
| nutanix.storage_tier.das-sata.usage_bytes | Storage Tier Das-sata Usage Bytes | NULL | Storage Tier Das-sata Usage Bytes | |
| nutanix.replication.num.received.bytes | Replication Num Received Bytes | NULL | Replication Num Received Bytes | |
| nutanix.hypervisor.kvm.memory.usage.ppm | Hypervisor KVM Memory Usage ppm | NULL | Hypervisor KVM Memory Usage ppm | |
| nutanix.hypervisor.avg.io.latency.usecs | Hypervisor Avg IO Latency Usecs | NULL | Hypervisor Avg IO Latency Usecs | |
| nutanix.controller.num.io | Controller Num IO | NULL | Controller Num IO | |
| nutanix.total.read.io.size.kbytes | Total Read IO Size KBytes | NULL | Total Read IO Size KBytes | |
| nutanix.hypervisor.num.write.io | Hypervisor Num Write IO | NULL | Hypervisor Num Write IO | |
| nutanix.hypervisor.memory.usage.ppm | Hypervisor Memory Usage PPM | NULL | Hypervisor Memory Usage PPM | |
| nutanix.storage_tier.ssd.capacity_bytes | Storage Tier SSD Capacity Bytes | NULL | Storage Tier SSD Capacity Bytes | |
| nutanix.controller.num.read.io | Controller Num Read IO | NULL | Controller Num Read IO | |
| nutanix.data_reduction.post_reduction_bytes | Data Reduction Post Reduction Bytes | NULL | Data Reduction Post Reduction Bytes | |
| nutanix.data_reduction.saved_bytes | Data Reduction Saved Bytes | NULL | Data Reduction Saved Bytes | |
| nutanix.controller.avg.read.io.latency.usecs | Controller Avg Read IO Latency Usecs | NULL | Controller Avg Read IO Latency Usecs | |
| nutanix.num.seq.io | Num Seq IO | NULL | Num Seq IO | |
| nutanix.data_reduction.erasure_coding.post_reduction_bytes | Data Reduction Erasure Coding Post Reduction Bytes | NULL | Data Reduction Erasure Coding Post Reduction Bytes | |
| nutanix.controller.total.transformed.usage.bytes | Controller Total Transformed Usage Bytes | NULL | Controller Total Transformed Usage Bytes |
Nutanix Hardware Monitoring - V2
Description
Monitors the Nutanix Storage health status and performance metrics of all components like CVM, disk, cluster, storage pool, VMs, Hypervisor along with Storage Container. SNMP based monitoring.
Prerequisites
No prerequisite
Supported Metric
| Monitor Name | Metric Name | Metric Display Name | Unit | Description |
|---|---|---|---|---|
| Nutanix Cluster Stats | mutanix.cluster.status | Nutanix Cluster Status | Monitors the Current Status of the cluster. This will usually be none of started or stopped. [OID: 1.3.6.1.4.1.41263.503.0] | |
| nutanix.cluster.storage.utilization | Nutanix Cluster Storage Utilization | % | Monitors the Cluster Storage utilization. [OID: 1.3.6.1.4.1.41263.504.0, 1.3.6.1.4.1.41263.505.0] | |
| Nutanix CVM Memory | nutanix.cvm.available.memory | Nutanix CVM Available Memory | GB | Monitors the total memory available on a CVM. [OID: 1.3.6.1.4.1.41263.4.1.3] |
| Nutanix CVM Status - Ext | nutanix_cvm_metadataService_status | Nutanix CVM Meta Data Service Status | Monitors the Status of metadata services on the Controller VM. [OID: 1.3.6.1.4.1.41263.11.1.5] | |
| nutanix_cvm_status | Nutanix CVM Status | Monitors the status of the node. [OID: 1.3.6.1.4.1.41263.11.1.3] | ||
| nutanix_cvm_dataServices_status | Nutanix CVM Core Data Service Status | Monitors the Status of core data services on the Controller VM. [OID: 1.3.6.1.4.1.41263.11.1.4] | ||
| Nutanix Disk Stats | nutanix.cvm.disk.avglatency | Nutanix CVM Disk Avg Latency | ms | Monitors the Average IO latency of the disk per micro seconds. [OID: 1.3.6.1.4.1.41263.3.1.10] |
| nutanix.cvm.disk.state | Nutanix CVM Disk State | Monitors the Nutanix Controller VM Disk Status. [OID: 1.3.6.1.4.1.41263.3.1.1, 1.3.6.1.4.1.41263.3.1.13] | ||
| nutanix.cvm.disk.usage | Nutanix CVM Disk Usage | KBps | Monitors the disk usage. [1.3.6.1.4.1.41263.3.1.6, 1.3.6.1.4.1.41263.3.1.7] | |
| nutanix.cvm.disk.total.iops | Nutanix CVM Disk IOPS | Monitors the Number IO per seconds for the disk. [OID: 1.3.6.1.4.1.41263.3.1.12] | ||
| Nutanix Hypervisor Performance | nutanix.hypervisor.write.iops | Nutanix Hypervisor Write IOPS | psec | Monitors the Number of write IO operations served per second on this hypervisor. [OID: 1.3.6.1.4.1.41263.9.1.10] |
| nutanix.hypervisor.memory.usage | Nutanix Hypervisor Memory Usage | % | Monitors the Memory usage percentage of the hypervisor. [OID: 1.3.6.1.4.1.41263.9.1.8] | |
| nutanix.hypervisor.cpu.usage | Nutanix Hypervisor CPU Usage | % | Monitors the CPU usage percentage of the hypervisor. [OID: 1.3.6.1.4.1.41263.9.1.6] | |
| nutanix.hypervisor.configured.vmcount | Nutanix Hypervisor COnfigured VM Count | Shows the Total number of VM configured on the hypervisor. [OID: 1.3.6.1.4.1.41263.9.1.4] | ||
| nutanix.hypervisor.avg.latency | Nutanix Hypervisor Avg Latency | ms | Monitors the Average IO latency per micro seconds of the hypervisor. [OID: 1.3.6.1.4.1.41263.9.1.11] | |
| nutanix.hypervisor.io.bandwidth | Nutanix Hypervisor IO Bandwidth | KBps | Monitors the IO bandwidth in KBps of the hypervisor. [OID: 1.3.6.1.4.1.41263.9.1.12] | |
| nutanix.hypervisor.read.iops | Nutanix Hypervisor Read IOPS | psec | Monitors the Number of read IO operations served per second on this hypervisor. [OID: 1.3.6.1.4.1.41263.9.1.9] | |
| Nutanix Storage Container Stats | nutanix.storage.container.avglatency | Nutanix Storage Container Avg Latency | ms | Monitors the Average IO latency for this storage container in microseconds. [OID: 1.3.6.1.4.1.41263.8.1.7] |
| nutanix.storage.container.iops | Nutanix Storage Container IOPS | psec | Monitors the Number of IO operations served per second from this storage container. [OID: 1.3.6.1.4.1.41263.8.1.6] | |
| nutanix.storage.container.utilization | Nutanix Storage Container Utilization | % | Monitors the Storage Container utillization. [OID: 1.3.6.1.4.1.41263.8.1.3, 1.3.6.1.4.1.41263.8.1.4, 1.3.6.1.4.1.41263.8.1.5] | |
| nutanix.storage.container.bandwidth | Nutanix Storage Container BandWidth | KBps | Monitors the IO bandwidth in KBps for the storage container. [OID: 1.3.6.1.4.1.41263.8.1.8] | |
| Nutanix Storage Pool Performance | nutanix.storagepool.utilization | Nutanix Storage Pool Utilization | % | Monitors the Storage pool utilization. [OID: 1.3.6.1.4.1.41263.7.1.3, 1.3.6.1.4.1.41263.7.1.4, 1.3.6.1.4.1.41263.7.1.5] |
| nutanix.storagepool.io.bandwidth | Nutanix Storage Pool IO BandWidth | KBps | Monitors the IO bandwidth in KBps for the Storage pool. [OID: 1.3.6.1.4.1.41263.7.1.8] | |
| nutanix.storagepool.avglatency | Nutanix Storage Pool Avg Latency | ms | Monitors the Average IO latency for this storage pool in microseconds. [OID: 1.3.6.1.4.1.41263.7.1.7] | |
| nutanix.storagepool.iops | Nutanix Storage Pool IOPS | psec | Monitors the number of IO operations served per second from this storage pool. [OID: 1.3.6.1.4.1.41263.7.1.6] |
Nutanix Hardware Monitoring - V3
Description
Monitors the Nutanix Storage health status and performance metrics of all components like CVM, disk, cluster, storage pool, VMs, Hypervisor along with Storage Container. SNMP based monitoring.
Prerequisites
No prerequisite
Supported Metric
| Monitor Name | Metric Name | Metric Display Name | Unit | Description |
|---|---|---|---|---|
| Nutanix Cluster Status | nutanix_cluster_status | Nutanix Cluster Status | Monitors the Current Status of the cluster. This will usually be none of started or stopped. [OID: 1.3.6.1.4.1.41263.503.0] | |
| nutanix_cluster_storage_utilization | Nutanix Cluster Storage Utilization | % | Monitors the Cluster Storage utilization. [OID: 1.3.6.1.4.1.41263.504.0, 1.3.6.1.4.1.41263.505.0] | |
| Nutanix Hardware Monitoring - Ext | nutanix_hypervisor_memory_usage | Nutanix Hypervisor Memory Usage | % | Monitors the Memory usage percentage of the hypervisor. [OID: 1.3.6.1.4.1.41263.9.1.8] |
| nutanix_cvm_dataServices_status | Nutanix CVM Core Data Service Status | Monitors the Status of core data services on the Controller VM. [OID: 1.3.6.1.4.1.41263.11.1.4] | ||
| nutanix_hypervisor_avg_latency | Nutanix Hypervisor Avg Latency | ms | Monitors the Average IO latency per micro seconds of the hypervisor. [OID: 1.3.6.1.4.1.41263.9.1.11] | |
| nutanix_storage_container_iops | Nutanix Storage Container IOPS | psec | Monitors the Number of IO operations served per second from this storage container. [OID: 1.3.6.1.4.1.41263.8.1.6] | |
| nutanix_cvm_disk_avglatency | Nutanix CVM Disk Avgerage latency | ms | Monitors the Average IO latency of the disk per micro seconds. [OID: 1.3.6.1.4.1.41263.3.1.10] | |
| nutanix_cvm_metadataService_status | Nutanix CVM Meta Data Service Status | Monitors the Status of metadata services on the Controller VM. [OID: 1.3.6.1.4.1.41263.11.1.5] | ||
| nutanix_cvm_available_memory | Nutanix CVM Available Memory | GB | Monitors the total memory available on a CVM. [OID: 1.3.6.1.4.1.41263.4.1.3] | |
| nutanix_hypervisor_read_iops | Nutanix Hypervisor Read IOPS | psec | Monitors the Number of read IO operations served per second on this hypervisor. [OID: 1.3.6.1.4.1.41263.9.1.9] | |
| nutanix_hypervisor_cpu_usage | Nutanix Hypervisor CPU Usage | % | Monitors the CPU usage percentage of the hypervisor. [OID: 1.3.6.1.4.1.41263.9.1.6] | |
| nutanix_hypervisor_configured_vmcount | Nutanix Hypervisor Configured VM Count | Shows the Total number of VM configured on the hypervisor. [OID: 1.3.6.1.4.1.41263.9.1.4] | ||
| nutanix_cvm_status | Nutanix CVM Status | Monitors the status of the node. [OID: 1.3.6.1.4.1.41263.11.1.3] | ||
| nutanix_storage_container_bandwidth | Nutanix Storage Container BandWidth | KBps | Monitors the IO bandwidth in KBps for the storage container. [OID: 1.3.6.1.4.1.41263.8.1.8] | |
| nutanix_storagepool_io_bandwidth | Nutanix Storage Pool IO BandWidth | KBps | Monitors the IO bandwidth in KBps for the Storage pool. [OID: 1.3.6.1.4.1.41263.7.1.8] | |
| nutanix_storage_container_utilization | Nutanix Storage Container Utilization | % | Monitors the Storage Container utillization. [OID: 1.3.6.1.4.1.41263.8.1.3, 1.3.6.1.4.1.41263.8.1.4, 1.3.6.1.4.1.41263.8.1.5] | |
| nutanix_cvm_diskState | Nutanix CVM Disk State | Monitors the Nutanix Controller VM Disk Status. [OID: 1.3.6.1.4.1.41263.3.1.1, 1.3.6.1.4.1.41263.3.1.13] | ||
| nutanix_storagepool_utilization | Nutanix Storage Pool Utilization | % | Monitors the Storage pool utilization. [OID: 1.3.6.1.4.1.41263.7.1.3, 1.3.6.1.4.1.41263.7.1.4, 1.3.6.1.4.1.41263.7.1.5] | |
| nutanix_cvm_disk_usage | Nutanix CVM Disk Usage | KBps | Monitors the disk usage. [1.3.6.1.4.1.41263.3.1.6, 1.3.6.1.4.1.41263.3.1.7] | |
| nutanix_hypervisor_io_bandwidth | Nutanix Hypervisor IO Bandwidth | KBps | Monitors the IO bandwidth in KBps of the hypervisor. [OID: 1.3.6.1.4.1.41263.9.1.12] | |
| nutanix_storagepool_iops | Nutanix Storage Pool IOPS | psec | Monitors the number of IO operations served per second from this storage pool. [OID: 1.3.6.1.4.1.41263.7.1.6] | |
| nutanix_storage_container_avglatency | Nutanix Storage Container Avg Latency | ms | Monitors the Average IO latency for this storage container in microseconds. [OID: 1.3.6.1.4.1.41263.8.1.7] | |
| nutanix_cvm_disk_totalIops | Nutanix CVM Disk Total Iops | Monitors the Number IO per seconds for the disk. [OID: 1.3.6.1.4.1.41263.3.1.12] | ||
| nutanix_hypervisor_write_iops | Nutanix Hypervisor Write IOPS | psec | Monitors the Number of write IO operations served per second on this hypervisor. [OID: 1.3.6.1.4.1.41263.9.1.10] | |
| nutanix_storagepool_avglatency | Nutanix Storage Pool Avg Latency | ms | Monitors the Average IO latency for this storage pool in microseconds. [OID: 1.3.6.1.4.1.41263.7.1.7] |
Nutanix Host Performance
Description
Nutanix Host Performance
Prerequisites
No prerequisite
Supported Metric
| Monitor Name | Metric Name | Metric Display Name | Unit | Description |
|---|---|---|---|---|
| Nutanix Host Performance | nutanix.num.read.iops | Num Read IOps | NULL | Num Read IOps |
| nutanix.controller.num.iops | Controller Num IOps | NULL | Controller Num IOps | |
| nutanix.num.write.iops | Num Write IOps | NULL | Num Write IOps | |
| nutanix.data_reduction.overall.saving_ratio_ppm | Data Reduction Overall Saving RatIO PPM | NULL | Data Reduction Overall Saving RatIO PPM | |
| nutanix.storage.capacity_bytes | Storage Capacity Bytes | NULL | Storage Capacity Bytes | |
| nutanix.storage.free_bytes | Storage Free Bytes | NULL | Storage Free Bytes |
Nutanix Host Performance - v2
Description
Added metrics nutanix.hypervisor.cpu.usage.ppm and nutanix_hypervisor_cpu_usage_percentage.
Prerequisites
Gateway version should be 19.1.0 or above.
Supported Metric
| Monitor Name | Metric Name | Metric Display Name | Unit | Description |
|---|---|---|---|---|
| Nutanix Host Performance - v2 | nutanix.num.read.iops | Num Read IOps | NULL | Num Read IOps |
| nutanix.controller.num.iops | Controller Num IOps | NULL | Controller Num IOps | |
| nutanix.num.write.iops | Num Write IOps | NULL | Num Write IOps | |
| nutanix.data_reduction.overall.saving_ratio_ppm | Data Reduction Overall Saving Ratio PPM | NULL | Data Reduction Overall Saving Ratio PPM | |
| nutanix.storage.capacity_bytes | Storage Capacity Bytes | NULL | Storage Capacity Bytes | |
| nutanix.storage.free_bytes | Storage Free Bytes | NULL | Storage Free Bytes | |
| nutanix_hypervisor_cpu_usage_percentage | nutanix_hypervisor_cpu_usage_percentage | % | This works from gateway version 19.1.0 | |
| nutanix.hypervisor.cpu.usage.ppm | Hypervisor CPU Usage PPM | NULL | Hypervisor CPU Usage PPM |
Nutanix Host Performance_Device
Description
Nutanix Host Performance
Prerequisites
No prerequisite
Supported Metric
| Monitor Name | Metric Name | Metric Display Name | Unit | Description |
|---|---|---|---|---|
| Nutanix Host Performance | nutanix.num.read.iops | Num Read IOps | NULL | Num Read IOps |
| nutanix.controller.num.iops | Controller Num IOps | NULL | Controller Num IOps | |
| nutanix.num.write.iops | Num Write IOps | NULL | Num Write IOps | |
| nutanix.data_reduction.overall.saving_ratio_ppm | Data Reduction Overall Saving RatIO PPM | NULL | Data Reduction Overall Saving RatIO PPM | |
| nutanix.storage.capacity_bytes | Storage Capacity Bytes | NULL | Storage Capacity Bytes | |
| nutanix.storage.free_bytes | Storage Free Bytes | NULL | Storage Free Bytes |
Nutanix StorageController Performance
Description
Nutanix StorageController Performance
Prerequisites
No prerequisite
Supported Metric
| Monitor Name | Metric Name | Metric Display Name | Unit | Description |
|---|---|---|---|---|
| Nutanix StorageController Performance | nutanix.num.read.iops | Num Read IOps | NULL | Num Read IOps |
| nutanix.controller.num.iops | Controller Num IOps | NULL | Controller Num IOps | |
| nutanix.num.write.iops | Num Write IOps | NULL | Num Write IOps | |
| nutanix.data_reduction.overall.saving_ratio_ppm | Data Reduction Overall Saving RatIO PPM | NULL | Data Reduction Overall Saving RatIO PPM | |
| nutanix.storage.capacity_bytes | Storage Capacity Bytes | NULL | Storage Capacity Bytes | |
| nutanix.storage.free_bytes | Storage Free Bytes | NULL | Storage Free Bytes |
Nutanix VirtualMachine Performance
Description
Nutanix VirtualMachine Performance
Prerequisites
No prerequisite
Supported Metric
| Monitor Name | Metric Name | Metric Display Name | Unit | Description |
|---|---|---|---|---|
| Nutanix VirtualMachine Performance | nutanix.num.read.iops | Num Read IOps | NULL | Num Read IOps |
| nutanix.controller.num.iops | Controller Num IOps | NULL | Controller Num IOps | |
| nutanix.num.write.iops | Num Write IOps | NULL | Num Write IOps | |
| nutanix.data_reduction.overall.saving_ratio_ppm | Data Reduction Overall Saving RatIO PPM | NULL | Data Reduction Overall Saving RatIO PPM | |
| nutanix.storage.capacity_bytes | Storage Capacity Bytes | NULL | Storage Capacity Bytes | |
| nutanix.storage.free_bytes | Storage Free Bytes | NULL | Storage Free Bytes |
Opengear Operations Manager
Description
Monitors the Opengear operations manager statistics like modem state ,UIM failover state , temperature and power supply statistics like input voltage , output current , output power and serial port statistics like Rx,,Tx Bytes,Traffic In,Traffic out, parity errors, over run errors,framing errors.[OG-OMTELEM-MIB :: ogOmCellularState : 1.3.6.1.4.1.25049.10.19.5.1.1.6 , ogOmCellularUimFailoverState : 1.3.6.1.4.1.25049.10.19.5.1.1.9, ogOmPowerSupplyOutputPower : 1.3.6.1.4.1.25049.10.19.8.1.1.6 , ogOmPowerSupplyOutputCurrent : 1.3.6.1.4.1.25049.10.19.8.1.1.5 , ogOmPowerSupplyInputVoltage : 1.3.6.1.4.1.25049.10.19.8.1.1.4, ogOmSerialPortRxBytes : 1.3.6.1.4.1.25049.10.19.2.2.1.11 , ogOmSerialPortTxBytes : 1.3.6.1.4.1.25049.10.19.2.2.1.12 , ogOmTempSensorValue : 1.3.6.1.4.1.25049.10.19.9.1.1.4]
Prerequisites
No prerequisite
Supported Metric
| Monitor Name | Metric Name | Metric Display Name | Unit | Description |
|---|---|---|---|---|
| Opengear Operations Manager - Cellular Modem | opengear_om_CellularState | Opengear OM Cellular State | Monitors the overall current state of the modem.[OG-OMTELEM-MIB :: ogOmCellularState : 1.3.6.1.4.1.25049.10.19.5.1.1.6].Possible values are failed(1), unknown(2), initializing(3), locked(4), disabled(5), disabling(6), enabling(7), enabled(8), searching(9), registered(10), disconnecting(11), connecting(12), connected(13). | |
| opengear_om_CellularUimFailoverState | Opengear OM Cellular UIM Failover State | Monitors the current UIM failover state.[OG-OMTELEM-MIB :: ogOmCellularUimFailoverState : 1.3.6.1.4.1.25049.10.19.5.1.1.9].Possible values are unavailable(1), disabled(2), enabled(3), failingOver(4), failedOver(5), failingBack(6). | ||
| Opengear Operations Manager - Power Supply | opengear_om_PowerSupplyOutputPower | Opengear OM Power Supply Output Power | Watts | Monitors the power supply output power.[OG-OMTELEM-MIB :: ogOmPowerSupplyOutputPower : 1.3.6.1.4.1.25049.10.19.8.1.1.6] |
| opengear_om_PowerSupplyOutputCurrent | Opengear OM Power Supply Output Current | amps | Monitors the power supply output current.[OG-OMTELEM-MIB :: ogOmPowerSupplyOutputCurrent : 1.3.6.1.4.1.25049.10.19.8.1.1.5] | |
| opengear_om_PowerSupplyInputVoltage | Opengear OM Power Supply Input Voltage | v | Monitors the power supply input voltage.[OG-OMTELEM-MIB :: ogOmPowerSupplyInputVoltage : 1.3.6.1.4.1.25049.10.19.8.1.1.4] | |
| Opengear Operations Manager - Serial Port Statistics | opengear_om_SerialPortParityErrors | Opengear OM Serial Port Parity Errors | Errors per Sec | It monitors Opengear serial port parity errors. [OG-OMTELEM-MIB :: ogOmSerialPortParityErrors : 1.3.6.1.4.1.25049.10.19.2.2.1.14] |
| opengear_om_SerialPortRxBytes | Opengear OM Serial Port Rx Bytes Received | Bytes | Monitors the Serial port bytes received.[OG-OMTELEM-MIB :: ogOmSerialPortRxBytes : 1.3.6.1.4.1.25049.10.19.2.2.1.11] | |
| opengear_om_SerialPortTrafficIn | Opengear OM Serial Port Traffic In | bps | It monitors the Opengear serial port traffic in.[OG-OMTELEM-MIB :: ogOmSerialPortRxBytes : 1.3.6.1.4.1.25049.10.19.2.2.1.11] | |
| opengear_om_SerialPortOverrunErrors | Opengear OM Serial Port Overrun Errors | Errors per Sec | It monitors Opengear serial port overrun errors.[OG-OMTELEM-MIB :: ogOmSerialPortOverrunErrors : 1.3.6.1.4.1.25049.10.19.2.2.1.15] | |
| opengear_om_SerialPortTrafficOut | Opengear OM Serial Port Traffic Out | bps | It monitors the Opengear serial port traffic out.[OG-OMTELEM-MIB :: ogOmSerialPortTxBytes : 1.3.6.1.4.1.25049.10.19.2.2.1.12] | |
| opengear_om_SerialPortTxBytes | Opengear OM Serial Port Tx Bytes Transmitted | Bytes | Monitors the Serial port bytes transmitted.[OG-OMTELEM-MIB :: ogOmSerialPortTxBytes : 1.3.6.1.4.1.25049.10.19.2.2.1.12] | |
| opengear_om_SerialPortFramingErrors | Opengear OM Serial Port Framing Errors | Errors per Sec | It monitors the Opengear serial port framing errors.[OG-OMTELEM-MIB :: ogOmSerialPortFramingErrors : 1.3.6.1.4.1.25049.10.19.2.2.1.13] | |
| Opengear Operations Manager - Temperature Sensor | opengear_om_TempSensorValue | Opengear OM Temperature Sensor value | Celsius | Monitors the temperature sensor value.[OG-OMTELEM-MIB :: ogOmTempSensorValue : 1.3.6.1.4.1.25049.10.19.9.1.1.4] |
OpsRamp Gateway Performance Monitors
Description
Monitors basic UNIX parameters like UNIXCPU,UNIXSTORAGE,UNIXUPTIME,UNIXMEMORY,UNIXLOAD and UNIXStats
Prerequisites
No prerequisite
Supported Metric
| Monitor Name | Metric Name | Metric Display Name | Unit | Description |
|---|---|---|---|---|
| CPU Load - UCD-SNMP-MIB | system.unix.load.5min | CPU Load 5 Min | Monitors the 5 minute cpu load average.[OID: 1.3.6.1.4.1.2021.10.1.3.2] | |
| CPU Stats - UCD-SNMP-MIB | unix.cpu.total | CPU Total Time | s | Sum of CPU Time in all modes.[OIDs: 1.3.6.1.4.1.2021.11.50.0,1.3.6.1.4.1.2021.11.51.0,1.3.6.1.4.1.2021.11.52.0,1.3.6.1.4.1.2021.11.53.0,1.3.6.1.4.1.2021.11.54.0,1.3.6.1.4.1.2021.11.55.0,1.3.6.1.4.1.2021.11.56.0] |
| system.unix.cpu.stats.user | CPU User Time | % | CPU time in User mode.[OIDs: 1.3.6.1.4.1.2021.11.50.0,1.3.6.1.4.1.2021.11.51.0,1.3.6.1.4.1.2021.11.52.0,1.3.6.1.4.1.2021.11.53.0,1.3.6.1.4.1.2021.11.54.0,1.3.6.1.4.1.2021.11.55.0,1.3.6.1.4.1.2021.11.56.0] | |
| system.unix.cpu.stats.nice | CPU Nice Time | % | CPU Time in Nice mode.[OIDs: 1.3.6.1.4.1.2021.11.50.0,1.3.6.1.4.1.2021.11.51.0,1.3.6.1.4.1.2021.11.52.0,1.3.6.1.4.1.2021.11.53.0,1.3.6.1.4.1.2021.11.54.0,1.3.6.1.4.1.2021.11.55.0,1.3.6.1.4.1.2021.11.56.0] | |
| system.unix.cpu.stats.system | CPU System Time | % | CPU Time in System mode.[OIDs: 1.3.6.1.4.1.2021.11.50.0,1.3.6.1.4.1.2021.11.51.0,1.3.6.1.4.1.2021.11.52.0,1.3.6.1.4.1.2021.11.53.0,1.3.6.1.4.1.2021.11.54.0,1.3.6.1.4.1.2021.11.55.0,1.3.6.1.4.1.2021.11.56.0] | |
| system.unix.cpu.stats.idle | CPU Idle Time | % | CPU Time in Idle mode.[OIDs: 1.3.6.1.4.1.2021.11.50.0,1.3.6.1.4.1.2021.11.51.0,1.3.6.1.4.1.2021.11.52.0,1.3.6.1.4.1.2021.11.53.0,1.3.6.1.4.1.2021.11.54.0,1.3.6.1.4.1.2021.11.55.0,1.3.6.1.4.1.2021.11.56.0] | |
| system.unix.cpu.stats.iowait | CPU IOWait Time | % | CPU Time in iowait mode. This is primarily a SysV thingie.[OIDs: 1.3.6.1.4.1.2021.11.50.0,1.3.6.1.4.1.2021.11.51.0,1.3.6.1.4.1.2021.11.52.0,1.3.6.1.4.1.2021.11.53.0,1.3.6.1.4.1.2021.11.54.0,1.3.6.1.4.1.2021.11.55.0,1.3.6.1.4.1.2021.11.56.0] | |
| system.unix.cpu.stats.kernel | CPU Kernel Time | % | CPU Time in Kernel mode.[OIDs: 1.3.6.1.4.1.2021.11.50.0,1.3.6.1.4.1.2021.11.51.0,1.3.6.1.4.1.2021.11.52.0,1.3.6.1.4.1.2021.11.53.0,1.3.6.1.4.1.2021.11.54.0,1.3.6.1.4.1.2021.11.55.0,1.3.6.1.4.1.2021.11.56.0] | |
| system.unix.cpu.stats.interrupt | CPU Interrupt Time | % | CPU time in interrupt level. This is primarily a BSD thingie.[OIDs: 1.3.6.1.4.1.2021.11.50.0,1.3.6.1.4.1.2021.11.51.0,1.3.6.1.4.1.2021.11.52.0,1.3.6.1.4.1.2021.11.53.0,1.3.6.1.4.1.2021.11.54.0,1.3.6.1.4.1.2021.11.55.0,1.3.6.1.4.1.2021.11.56.0] | |
| CPU Utilization - UCD-SNMP-MIB | system.unix.cpu.util.percent | CPU Utilization | % | CPU utilization is a key performance metric. It is the percentage of time the processor spends doing work (as opposed to being idle). It can be used to track CPU performance regressions or improvements.[OID: 1.3.6.1.4.1.2021.11.11.0] |
| Host System Uptime | system.uptime | System Uptime | s | The amount of time since this host was last initialized.[OID - 1.3.6.1.2.1.25.1.1.0] |
| Memory Utilization - UCD-SNMP-MIB | system.unix.memory | Unix Physical Memory | % | Monitors the Unix Real Memory utilization.[OIDs: 1.3.6.1.4.1.2021.4.6.0,1.3.6.1.4.1.2021.4.5.0,1.3.6.1.4.1.2021.4.15.0] |
| system.unix.memory.swap | Unix Swap Memory | % | Monitors the Unix Swap Memory Utilization.[OIDs: 1.3.6.1.4.1.2021.4.3.0,1.3.6.1.4.1.2021.4.4.0] | |
| system.unix.memory.free | Unix Memory Free | KB | Monitors the UNIX free memory.[OIDs: 1.3.6.1.4.1.2021.4.14,1.3.6.1.4.1.2021.4.15,1.3.6.1.4.1.2021.4.6] | |
| system.unix.memory.used | Unix Memory Used | KB | Monitors the UNIX used memory. | |
| system.unix.memory.swap.used | Unix Swap Memory Used | KB | Monitors the amount of used swap memory.[OIDs: 1.3.6.1.4.1.2021.4.3.0,1.3.6.1.4.1.2021.4.4.0] | |
| system.unix.memory.swap.total | Unix Swap Memory Total | KB | Monitors the total amount of swap space configured for this host.[OID: 1.3.6.1.4.1.2021.4.3.0] | |
| Storage Utilization - HR-MIB | system.disk.util.percent | Disk Utilization | % | Monitors the disk utilization.[OIDs: 1.3.6.1.2.1.25.2.3.1.4,1.3.6.1.2.1.25.2.3.1.5,1.3.6.1.2.1.25.2.3.1.6] |
OpsRamp Gateway vProbe Performance
Description
OpsRamp Gateway vProbe Performance
Prerequisites
No prerequisite
Supported Metric
| Monitor Name | Metric Name | Metric Display Name | Unit | Description |
|---|---|---|---|---|
| OpsRamp Gateway vProbe Performance | vistara.vprobe.mem.prct | vProbe memory usage | % | vProbe memory usage |
| vistara.vprobe.uptime.millis | vProbe uptime | Days | vProbe uptime in Days | |
| vistara.vprobe.free.mem | vProbe free memory | GB | vProbe free memory | |
| vistara.vprobe.total.threads | vProbe total threads | vProbe total threads | ||
| vistara.vprobe.msg.db.length | vProbe message DB queue size | vProbe message DB queue size | ||
| vistara.vprobe.mon.recent.pkt.sent.time | vProbe Monitor Packet sent time | ms | vProbe Monitor Packet sent time | |
| 8vistara.vprobe.msg.recent.pkt.sent.time | vProbe Message Packet sent time | ms | vProbe Message Packet sent time | |
| vistara.vprobe.msg.queue.length | vProbe message Memory queue size | vProbe message Memory queue size | ||
| vistara.vprobe.mon.queue.length | vProbe monitor Memory queue size | vProbe monitor Memory queue size | ||
| vistara.vprobe.msg.pkt.send | vProbe message packets sent | vProbe message packets sent | ||
| vistara.vprobe.mon.pkt.send | vProbe monitor packets sent | vProbe monitor packets sent | ||
| vistara.vprobe.msg.data.send | vProbe message data sent | MB | vProbe message data sent | |
| vistara.vprobe.mon.data.send | vProbe monitor data sent | MB | vProbe monitor data sent | |
| vistara.vprobe.datapoint.consumer.count | vProbe Monitor Datapoint Consumer count | vProbe Monitor Datapoint Consumer count | ||
| vistara.vprobe.rawdata.consumer.count | vProbe Monitor Raw Datapoint Consumer count | vProbe Monitor Raw Datapoint Consumer count | ||
| vistara.vprobe.mon.device.count | vProbe Monitor device count | vProbe Monitor device count | ||
| vistara.vprobe.mon.job.count | vProbe Monitor Job count | vProbe Monitor Job count | ||
| vistara.vprobe.running.service.count | vProbe Running service count | vProbe Running service count | ||
| vistara.vprobe.mon.db.length | vProbe monitor DB queue size | vProbe monitor DB queue size | ||
| vistara.vprobe.threadpool.rejected | vProbe Rejected threads | vProbe Rejected threads | ||
| vistara.vprobe.cpu.load | vProbe CPU load | % | vProbe CPU load | |
| vistara.vprobe.open.fd | vProbe Open File descriptors | vProbe Open File descriptors |
OpsRamp Gateway vProbe Performance - Overload Indication
Description
In addition to OpsRamp Gateway vProbe Performance template use this template to monitor the gateway metrics and component count.
Prerequisites
No prerequisite
Supported Metric
| Monitor Name | Metric Name | Metric Display Name | Unit | Description |
|---|---|---|---|---|
| OpsRamp Gateway vProbe Performance - Overload Indication | vprobe.monitor.component.count | vProbe Monitor Component Count | NULL | Every time a components gets monitored it will be incremented by one. |
| vprobe.monitor.metric.count | vProbe Monitor Metric Count | NULL | Every time a metric gets monitored it will be incremented by one. |
Oracle - Sun platform - Alarms - G2
Description
Template for Oracle Sun Platform. Monitors Oracle Sun operational status, unknown status, alarm status and ILOM control firmware update status. Tested on SUN BLADE 6000 MODULAR SYSTEM.
Prerequisites
No prerequisite
Supported Metric
| Monitor Name | Metric Name | Metric Display Name | Unit | Description |
|---|---|---|---|---|
| Sun ILOM Control Firmware Status | oraclefirmware.status | Sun ILOM Control Firmware Status | This property indicates the status of a firmware update. If a TFTP error occurred while attempting to upload a new firmware image, the value of this property will be tftpError(1). If the image was uploaded correctly but it did not pass verification, the value of this property will be imageVerificationFailed(2). Otherwise, the status will indicate that the update is inProgress(3) or is a success(4). A firmware update could take as long as 20 minutes. During this time, no other operations should be performed on the device. Upon success, the device will be reset. [OID:1.3.6.1.4.1.42.2.175.102.6.7.0]. | |
| Sun Platform Equipment | oracle.unknown.status | Sun Platform Unknown Status | Provides the unknown status of the managed object. Possible states are 1- True, 2- False. [OID: 1.3.6.1.4.1.42.2.70.101.1.1.2.1.4] | |
| oracle.alarm.status | Sun Platform Alarm Status | Indicates the alarm status of the managed object. Possible values are 1- Critical, 2- Major, 3- Minor, 4- Indeterminate, 5- Warning, 6- Pending, 7- Cleared. [OID: 1.3.6.1.4.1.42.2.70.101.1.1.2.1.3] | ||
| operational.state | Operational State | Describes the Operational State and Administrative state of the managed object and . Possible values are 0:Admin Locked or Shutting down 1: disabled 2: enabled [OIDs: 1.3.6.1.4.1.42.2.70.101.1.1.2.1.1, 1.3.6.1.4.1.42.2.70.101.1.1.2.1.2] |
ORACLE RAC
Description
Monitors Oracle RAC metrics like: Oracle ASM Archive pct, Oracle ASM Data pct, Oracle Blocking Session, Oracle BufferCacheHitRatio pct, Oracle Disk Sort Ratio pct, Oracle Duplicated Filename Count, Oracle Library Cache Hit Ratio pct, Oracle Max DB File pct usage, Oracle Max Open Cursor Username Count, Oracle Processes Used pct, Oracle Redolog Switch Count, Oracle Sequence Pct Used, Oracle Sessions Used pct, Oracle Table Lock Conflict Count, Oracle Temp Tablespace Utilization, Oracle UNDO tbs usage
Prerequisites
No prerequisite
Supported Metric
| Monitor Name | Metric Name | Metric Display Name | Unit | Description |
|---|---|---|---|---|
| ORACLE RAC | oracle.blocking.session | Oracle Blocking Session | count | Oracle query to monitoring blocking valid sessions |
| oracle.maxdbfilepct.usage | Oracle Max DB File pct usage | % | Oracle query to monitoring the % of oracle files opened | |
| oracle.redolog.switch.count | Oracle Redolog Switch Count | count | Oracle query to monitoring the number of redolog switch | |
| oracle.maxopencursor.username.count | Oracle Max Open Cursor Username Count | count | Oracle query to monitoring max open cursor value for each db username | |
| oracle.sequence.pctused | Oracle Sequence Pct Used | % | Oracle query to monitoring sequence usage in Pct | |
| oracle.procsused.pct | Oracle Processes Used pct | % | Oracle query to monitoring db processes usage in Pct | |
| oracle.sessions.used.pct | Oracle Sessions Used pct | % | Oracle query to monitoring db sessions usage in Pct | |
| oracle.table.lockconflict.count | Oracle Table Lock Conflict Count | count | Oracle query to identify locks at table level | |
| oracle.BufferCacheHitRatio.pct | Oracle BufferCacheHitRatio pct | % | Oracle query to monitoring Buffer cache hit ratio value in Pct | |
| oracle.librarycachehitratio.pct | Oracle Library Cache Hit Ratio pct | % | Oracle query to monitoring Library Cache Hit Ratio value in Pct | |
| oracle.disk.sort.ratio.pct | Oracle Disk Sort Ratio pct | % | Oracle query to monitoring disk sort ratio value in pct | |
| oracle.undo.tbs.usage | Oracle UNDO tbs usage | % | Oracle query to monitoring UNDO active extents usage in Pct | |
| oracle.temp.tablespace.util | Oracle Temp Tablespace Utilization | % | Oracle query to monitor Temp tablespace space usage in Pct | |
| oracle.duplicated.filename.count | Oracle Duplicated Filename Count | count | Query to check if we have some duplicated db filename in different ASM paths | |
| oracle.asm.archive.pct | Oracle ASM Archive pct | % | Oracle query for ASM ARCHIVE diskgroup | |
| oracle.asm.data.pct | Oracle ASM Data pct | % | Oracle query for ASM DATA diskgroup |
ORACLE RAC - v2.0
Description
This template supports both SID and Service name connection types Integration is done through JDBC and SQL queries.
Prerequisites
Gateway 7.0.0 and above.
Supported Metric
| Monitor Name | Metric Name | Metric Display Name | Unit | Description |
|---|---|---|---|---|
| ORACLE RAC - v2.0 | oracle.blocking.session | Oracle Blocking Session | count | Oracle query to monitoring blocking valid sessions |
| oracle.maxdbfilepct.usage | Oracle Max DB File pct usage | % | Oracle query to monitoring the % of oracle files opened | |
| oracle.redolog.switch.count | Oracle Redolog Switch Count | count | Oracle query to monitoring the number of redolog switch | |
| oracle.maxopencursor.username.count | Oracle Max Open Cursor Username Count | count | Oracle query to monitoring max open cursor value for each db username | |
| oracle.sequence.pctused | Oracle Sequence Pct Used | % | Oracle query to monitoring sequence usage in Pct | |
| oracle.procsused.pct | Oracle Processes Used pct | % | Oracle query to monitoring db processes usage in Pct | |
| oracle.sessions.used.pct | Oracle Sessions Used pct | % | Oracle query to monitoring db sessions usage in Pct | |
| oracle.table.lockconflict.count | Oracle Table Lock Conflict Count | count | Oracle query to identify locks at table level | |
| oracle.BufferCacheHitRatio.pct | Oracle BufferCacheHitRatio pct | % | Oracle query to monitoring Buffer cache hit ratio value in Pct | |
| oracle.librarycachehitratio.pct | Oracle Library Cache Hit Ratio pct | % | Oracle query to monitoring Library Cache Hit Ratio value in Pct | |
| oracle.disk.sort.ratio.pct | Oracle Disk Sort Ratio pct | % | Oracle query to monitoring disk sort ratio value in pct | |
| oracle.undo.tbs.usage | Oracle UNDO tbs usage | % | Oracle query to monitoring UNDO active extents usage in Pct | |
| oracle.temp.tablespace.util | Oracle Temp Tablespace Utilization | % | Oracle query to monitor Temp tablespace space usage in Pct | |
| oracle.duplicated.filename.count | Oracle Duplicated Filename Count | count | Query to check if we have some duplicated db filename in different ASM paths | |
| oracle.asm.archive.pct | Oracle ASM Archive pct | % | Oracle query for ASM ARCHIVE diskgroup | |
| oracle.asm.data.pct | Oracle ASM Data pct | % | Oracle query for ASM DATA diskgroup |
ORACLE RAC tablespace space
Description
Monitors ORACLE RAC tablespace space in percentage
Prerequisites
No prerequisite
Supported Metric
| Monitor Name | Metric Name | Metric Display Name | Unit | Description |
|---|---|---|---|---|
| ORACLE RAC tablespace space | oracle.rac.tablespace.space.used | Oracle RAC Tablespace Space Used Top 20 Greaterthan 85 | % | Oracle query to monitor TOP (20) RAC tablespace space usage where Pct > 85% |
ORACLE RAC tablespace space - v2.0
Description
This template supports both SID and Service name connection types. Integration is done through JDBC and SQL queries.
Prerequisites
Gateway 7.0.0 and above.
Supported Metric
| Monitor Name | Metric Name | Metric Display Name | Unit | Description |
|---|---|---|---|---|
| ORACLE RAC tablespace space - v2.0 | oracle.rac.tablespace.space.used | Oracle RAC Tablespace Space Used Top 20 Greaterthan 85 | % | Oracle query to monitor TOP (20) RAC tablespace space usage where Pct > 85% |
OSPF Neighbor State - Ext - Auto Selection
Description
Template to monitors the connection Status of the OSPF Neighbors. And if any Neighbor is available in previous poll and not available in the current poll results then it will posts connection status as ZERO(custom status), for which, we defined to generate a CRITICAL alert. Possible values are 0-NEIGHBOR_DOWN, 1- down, 2- attempt, 3- init, 4- twoWay, 5- exchangeStart, 6- exchange, 7- loading, 8- full. [OSPF-MIB::ospfNbrState - 1.3.6.1.2.1.14.10.1.6]
Prerequisites
No prerequisite
Supported Metric
| Monitor Name | Metric Name | Metric Display Name | Unit | Description |
|---|---|---|---|---|
| OSPF Neighbor State - Ext - Auto Selection | ospf.neighbor.status | OSPF Neighbor Status | It monitors the connection Status of the OSPF Neighbors. Possible values are 0-NEIGHBOR_NOT_FOUND, 1- down, 2- attempt, 3- init, 4- twoWay, 5- exchangeStart, 6- exchange, 7- loading, 8- full. [OSPF-MIB::ospfNbrState - 1.3.6.1.2.1.14.10.1.6] |
OSPF Stats
Description
Monitors the cumulative statistics like the total number of Area Border Routers reachable within this area, the total number of Autonomous System Border Routers reachable within this area, The number of times that the intra-area route table has been calculated using this area’s link state database, the total number of link state advertisementsin this area’s link state database, excluding AS-external LSAs of one of the router’s attached areas and also neighbor statistics like neighbor state,events count and re transmission queue length.
Prerequisites
No prerequisite
Supported Metric
| Monitor Name | Metric Name | Metric Display Name | Unit | Description |
|---|---|---|---|---|
| OSPF Area | ospf.area.bdr.reachableroutercount | Number of Area Border Reachable Routers | The total number of Area Border Routers reachable within this area. This is initially zero and is calculated in each Shortest Path First (SPF) pass. [OID: 1.3.6.1.2.1.14.2.1.5] | |
| ospf.area.autonomous.sbr.reachablerouters | Autonomous SBR(System Border Routers) reachable count | The total number of Autonomous System Border Routers reachable within this area. This is initially zero and is calculated in each SPF pass. [OID: 1.3.6.1.2.1.14.2.1.6] | ||
| ospf.spf.runs.count | OSPF SPF Runs count | The number of times that the intra-area route table has been calculated using this area's link state database. This is typically done using Dijkstra's algorithm. [OID: 1.3.6.1.2.1.14.2.1.4] | ||
| ospf.area.lsa.count | OSPF Area LSA Count | The total number of link state advertisements in this area's link state database, excluding AS-external LSAs. [OID: 1.3.6.1.2.1.14.2.1.7] | ||
| OSPF Neighbor Monitors | ospf.neighbor.state | OSPF Neighbor State | Monitors the state of the relationship with this neighbor. Possible values are 1- down, 2- attempt, 3- init, 4- twoWay, 5- exchangeStart, 6- exchange, 7- loading, 8- full. [OIDs: 1.3.6.1.2.1.14.10.1.6, 1.3.6.1.2.1.14.10.1.1, 1.3.6.1.2.1.14.10.1.3] | |
| ospf.neighbor.events.count | OSPF Neighbor Events Count | psec | Monitors the number of times this neighbor relationship has changed state or an error has occurred. Discontinuities in the value of this counter can occur at re-initialization of the management system, and at other times as indicated by the value of ospfDiscontinuityTime. [OIDs: 1.3.6.1.2.1.14.10.1.7, ] | |
| ospf.neighbor.retransque.length | OSPF Neighbor Retransmission Queue Length | Monitors the current length of the re-transmission queue. [OID: 1.3.6.1.2.1.14.10.1.8] |
Panduit PDU G5
Description
Monitors panduit pdug5 statistics like pdug5 status,input frequency,input frequency status and pdug5 group statistics like group voltage,group voltage status,group current,group current status, group current load,group power and outlet statistics like outlet current,outlet power,outlet current load,outlet control status and input phase statistics like phase voltage, phase voltage status,phase current,phase current status and power,pdug5 environment statistics like temperature probe status,temperature value,temperature threshold status,humidity probe status,humidity value,humidity threshold status,door sensor probe status,door sensor state,dry sensor probe status,dry sensor state,spot sensor probe status,spot sensor state,rope sensor probe status,rope sensor state.[PANDUIT-MIB :: pdug5Status : 1.3.6.1.4.1.19536.10.1.1.2.1.9 , pdug5InputFrequency : 1.3.6.1.4.1.19536.10.1.2.1.1.2 , pdug5InputFrequencyStatus : 1.3.6.1.4.1.19536.10.1.2.1.1.3 , pdug5InputPhaseVoltage : 1.3.6.1.4.1.19536.10.1.2.2.1.3 , pdug5InputPhaseVoltageThStatus : 1.3.6.1.4.1.19536.10.1.2.2.1.4 , pdug5InputPhaseCurrent : 1.3.6.1.4.1.19536.10.1.2.2.1.11 , pdug5InputPhaseCurrentThStatus : 1.3.6.1.4.1.19536.10.1.2.2.1.12 , pdug5InputPhasePowerWatts : 1.3.6.1.4.1.19536.10.1.2.2.1.20 , pdug5GroupVoltage : 1.3.6.1.4.1.19536.10.1.3.1.1.5 , pdug5GroupVoltageThStatus : 1.3.6.1.4.1.19536.10.1.3.1.1.6 , pdug5GroupCurrent : 1.3.6.1.4.1.19536.10.1.3.1.1.12 , pdug5GroupCurrentThStatus : 1.3.6.1.4.1.19536.10.1.3.1.1.13 , pdug5GroupCurrentPercentLoad : 1.3.6.1.4.1.19536.10.1.3.1.1.18 , pdug5GroupPowerWatts : 1.3.6.1.4.1.19536.10.1.3.1.1.20 , pdug5OutletCurrent : 1.3.6.1.4.1.19536.10.1.5.1.1.5 , pdug5OutletWatts : 1.3.6.1.4.1.19536.10.1.5.1.1.13 , pdug5OutletCurrentPercentLoad : 1.3.6.1.4.1.19536.10.1.5.1.1.11 , pdug5OutletControlStatus : 1.3.6.1.4.1.19536.10.1.5.2.1.1,pdug5TemperatureProbeStatus : 1.3.6.1.4.1.19536.10.1.4.2.1.3 , pdug5TemperatureValue : 1.3.6.1.4.1.19536.10.1.4.2.1.4 , pdug5TemperatureThStatus : 1.3.6.1.4.1.19536.10.1.4.2.1.5, pdug5HumidityProbeStatus : 1.3.6.1.4.1.19536.10.1.4.3.1.3 , pdug5HumidityValue : 1.3.6.1.4.1.19536.10.1.4.3.1.4 , pdug5HumidityThStatus : 1.3.6.1.4.1.19536.10.1.4.3.1.5 , pdug5DoorProbeStatus : 1.3.6.1.4.1.19536.10.1.4.4.1.3 , pdug5DoorState : 1.3.6.1.4.1.19536.10.1.4.4.1.4 , pdug5DryProbeStatus : 1.3.6.1.4.1.19536.10.1.4.5.1.3 , pdug5DryState : 1.3.6.1.4.1.19536.10.1.4.5.1.4 , pdug5SpotProbeStatus : 1.3.6.1.4.1.19536.10.1.4.6.1.3 , pdug5SpotState : 1.3.6.1.4.1.19536.10.1.4.6.1.4 , pdug5RopeProbeStatus : 1.3.6.1.4.1.19536.10.1.4.7.1.3 , pdug5RopeState : 1.3.6.1.4.1.19536.10.1.4.7.1.4].
Prerequisites
Device must support PANDUIT-MIB.
Supported Metric
| Native Type | Metric Name | Display Name | Units | Application Version | Description |
|---|---|---|---|---|---|
| Panduit PDU G5 | panduit_pdug5_input_frequency_Status | Panduit Pdug5 Input Frequency Status | 1.0.0 | Monitors the status of the measured input frequency relative to the nominal frequency and the admitted tolerance.possible values are good(1),outOfRange(2) | |
| panduit_pdug5_group_current_Status | Panduit Pdug5 Group Current Threshold Status | 1.0.0 | Monitors the status of the measured group current relative to the configured thresholds.[PANDUIT-MIB :: pdug5GroupCurrentThStatus : 1.3.6.1.4.1.19536.10.1.3.1.1.13].possible values are good(1),lowWarning(2),lowCritical(3),highWarning(4),highCritical(5). | ||
| panduit_pdug5_rope_sensor_State | Panduit Pdug5 Rope Sensor State | 1.0.0 | Monitors the state of the rope sensor.[PANDUIT-MIB :: pdug5RopeState : 1.3.6.1.4.1.19536.10.1.4.7.1.4].possible values are noleak(1) , leak(2),ropeSensorNotAvailable(0). | ||
| panduit_pdug5_humidity_threshold_Status | Panduit Pdug5 Humidity Threshold Status | 1.0.0 | Monitors the status of the measured humidity relative to the configured thresholds.[PANDUIT-MIB :: pdug5HumidityThStatus : 1.3.6.1.4.1.19536.10.1.4.3.1.5].possible values are good(1),lowWarning(2),lowCritical(3),highWarning(4),highCritical(5) , HumidityProbeNotConnected(0). | ||
| panduit_pdug5_spot_sensor_State | Panduit Pdug5 Spot Sensor State | 1.0.0 | Monitors the state of the spot sensor.[PANDUIT-MIB :: pdug5SpotState : 1.3.6.1.4.1.19536.10.1.4.6.1.4].possible values are noleak(1),leak(2),spotSensorNotAvailable(0). | ||
| panduit_pdug5_humidity_probe_Status | Panduit Pdug5 Humidity Probe Status | 1.0.0 | Monitors whether a probe is connected or not.[PANDUIT-MIB :: pdug5HumidityProbeStatus : 1.3.6.1.4.1.19536.10.1.4.3.1.3].Possible values are disconnected(1),connected(2),bad(3) | ||
| panduit_pdug5_dry_sensor_probe_Status | Panduit Pdug5 Dry Sensor Probe Status | 1.0.0 | Monitors whether a probe is connected or not.[PANDUIT-MIB :: pdug5DryProbeStatus : 1.3.6.1.4.1.19536.10.1.4.5.1.3].Possible values are disconnected(1),connected(2),bad(3) | ||
| panduit_pdug5_dry_sensor_State | Panduit Pdug5 Dry Sensor State | 1.0.0 | Monitors the state of the dry sensor.[PANDUIT-MIB :: pdug5DryState : 1.3.6.1.4.1.19536.10.1.4.5.1.4].Possible values are good(1),alarmed(2),drySensorNotAvailable(0) | ||
| panduit_pdug5_spot_sensor_probe_Status | Panduit Pdug5 Spot Sensor Probe Status | 1.0.0 | Monitors whether a probe is connected or not.[PANDUIT-MIB :: pdug5SpotProbeStatus : 1.3.6.1.4.1.19536.10.1.4.6.1.3].Possible values are disconnected(1),connected(2),bad(3) | ||
| panduit_pdug5_group_voltage_Status | Panduit Pdug5 Group Voltage Threshold Status | 1.0.0 | Monitors the status of the measured group voltage relative to the configured thresholds.[PANDUIT-MIB :: pdug5GroupVoltageThStatus : 1.3.6.1.4.1.19536.10.1.3.1.1.6].Possible values are good(1),lowWarning(2),lowCritical(3),highWarning(4),highCritical(5). | ||
| panduit_pdug5_temperature_probe_Status | Panduit Pdug5 Temperature Probe Status | 1.0.0 | Monitors whether a probe is connected or not.[PANDUIT-MIB :: pdug5TemperatureProbeStatus : 1.3.6.1.4.1.19536.10.1.4.2.1.3].Possible values are disconnected(1) , connected(2) , bad(3) | ||
| panduit_pdug5_input_phase_current_Status | Panduit Pdug5 Input Phase Current Status | 1.0.0 | Monitors the status of the measured input current relative to the configured thresholds.[PANDUIT-MIB :: pdug5InputPhaseCurrentThStatus : 1.3.6.1.4.1.19536.10.1.2.2.1.12].possible values are good(1),lowWarning(2),lowCritical(3),highWarning(4),highCritical(5) | ||
| panduit_pdug5_door_sensor_probe_Status | Panduit Pdug5 Door Sensor Probe Status | 1.0.0 | Monitors whether a probe is connected or not.[PANDUIT-MIB :: pdug5DoorProbeStatus : 1.3.6.1.4.1.19536.10.1.4.4.1.3].possible values are disconnected(1),connected(2),bad(3) | ||
| panduit_pdug5_input_phase_voltage_Status | Panduit Pdug5 Input Phase Voltage Status | 1.0.0 | Monitors the status of the measured input voltage relative to the configured thresholds.[PANDUIT-MIB :: pdug5InputPhaseVoltageThStatus : 1.3.6.1.4.1.19536.10.1.2.2.1.4].possible values are good(1),lowWarning(2),lowCritical(3),highWarning(4),highCritical(5) | ||
| panduit_pdug5_temperature_threshold_status | Panduit Pdug5 Temperature Threshold Status | 1.0.0 | Monitors the status of the measured temperature relative to the configured thresholds.[PANDUIT-MIB :: pdug5TemperatureThStatus : 1.3.6.1.4.1.19536.10.1.4.2.1.5].possible values are good(1),lowWarning(2),lowCritical(3),highWarning(4),highCritical(5),TemperatureProbeNotConnected(0). | ||
| panduit_pdug5_Status | Panduit Pdug5 Status | 1.0.0 | Monitors the the overall status of the device. A value of OK(2) indicates the device is operating normally. A value of degraded(3) indicates the device is operating with warning indicators. A value of failed(4) indicates the device is operating with critical indicators.[PANDUIT-MIB :: pdug5Status : 1.3.6.1.4.1.19536.10.1.1.2.1.9].possible values are other(1),ok(2),degraded(3),failed(4). | ||
| panduit_pdug5_door_sensor_State | Panduit Pdug5 Door Sensor State | 1.0.0 | Monitors the state of the door sensor.[PANDUIT-MIB :: pdug5DoorState : 1.3.6.1.4.1.19536.10.1.4.4.1.4].doorOpen(1),doorClosed(2),baddoorSensor(3),doorSensorNotAvailable(0) | ||
| panduit_pdug5_outlet_control_Status | Panduit Pdug5 Outlet Control Status | 1.0.0 | Monitors the current state of a control outlet.[PANDUIT-MIB :: pdug5OutletControlStatus : 1.3.6.1.4.1.19536.10.1.5.2.1.1].possible values are off(1),on(2),pendingOff(3),pendingOn(4). | ||
| panduit_pdug5_rope_sensor_probe_Status | Panduit Pdug5 Rope Sensor Probe Status | 1.0.0 | Monitors whether a probe is connected or not.[PANDUIT-MIB :: pdug5RopeProbeStatus : 1.3.6.1.4.1.19536.10.1.4.7.1.3].Possible values are disconnected(1),connected(2),bad(3) |
| Native Type | Metric Name | Display Name | Units | Application Version | Description |
|---|---|---|---|---|---|
| Panduit PDU G5 | panduit_pdug5_outlet_Current | Panduit Pdug5 Outlet Current | amps | 1.0.0 | Monitors outlet current measurement value.[PANDUIT-MIB :: pdug5OutletCurrent : 1.3.6.1.4.1.19536.10.1.5.1.1.5] |
| panduit_pdug5_input_phase_Power | Panduit Pdug5 Input Phase Power | Watts | 1.0.0 | Monitors the input phase power value.[PANDUIT-MIB :: pdug5InputPhasePowerWatts : 1.3.6.1.4.1.19536.10.1.2.2.1.20] | |
| panduit_pdug5_input_Frequency | Panduit Pdug5 Input Frequency | Hz | 1.0.0 | Monitors the input frequency from the PDU meters.[PANDUIT-MIB :: pdug5InputFrequency : 1.3.6.1.4.1.19536.10.1.2.1.1.2] | |
| panduit_pdug5_group_Power | Panduit Pdug5 Group Power | Watts | 1.0.0 | Monitors group power value.[PANDUIT-MIB :: pdug5GroupPowerWatts : 1.3.6.1.4.1.19536.10.1.3.1.1.20] | |
| panduit_pdug5_input_phase_Current | Panduit Pdug5 Input Phase Current | amps | 1.0.0 | Monitors input current measurement value.[PANDUIT-MIB :: pdug5InputPhaseCurrent : 1.3.6.1.4.1.19536.10.1.2.2.1.11] | |
| panduit_pdug5_group_current | Panduit Pdug5 Group Current | amps | 1.0.0 | Monitors the group current measurement value.[PANDUIT-MIB :: pdug5GroupCurrent : 1.3.6.1.4.1.19536.10.1.3.1.1.12] | |
| panduit_pdug5_input_phase_Voltage | Panduit Pdug5 Input Phase Voltage | v | 1.0.0 | Monitors input voltage measurement value.[PANDUIT-MIB :: pdug5InputPhaseVoltage : 1.3.6.1.4.1.19536.10.1.2.2.1.3] | |
| panduit_pdug5_group_Voltage | Panduit Pdug5 Group Voltage | v | 1.0.0 | Monitors the panduit pdug5 group voltage.[PANDUIT-MIB :: pdug5GroupVoltage : 1.3.6.1.4.1.19536.10.1.3.1.1.5] | |
| panduit_pdug5_outlet_Power | Panduit Pdug5 Outlet Power | W | 1.0.0 | Monitors the outlet power.[PANDUIT-MIB :: pdug5OutletWatts : 1.3.6.1.4.1.19536.10.1.5.1.1.13] |
| Native Type | Metric Name | Display Name | Units | Application Version | Description |
|---|---|---|---|---|---|
| Panduit PDU G5 | panduit_pdug5_humidity_Value | Panduit Pdug5 Humidity Value | % | 1.0.0 | Monitors the humidity value.[PANDUIT-MIB :: pdug5HumidityValue : 1.3.6.1.4.1.19536.10.1.4.3.1.4] |
| panduit_pdug5_temperature_Value | Panduit Pdug5 Temperature Value | Celsius | 1.0.0 | Monitors the panduit pdug5 temperature value.[PANDUIT-MIB :: pdug5TemperatureValue : 1.3.6.1.4.1.19536.10.1.4.2.1.4] |
| Native Type | Metric Name | Display Name | Units | Application Version | Description |
|---|---|---|---|---|---|
| Panduit PDU G5 | panduit_pdug5_group_current_Load | Panduit Pdug5 Group Current Load | % | 1.0.0 | Monitors the current percent load, based on the rated current capacity.[PANDUIT-MIB :: pdug5GroupCurrentPercentLoad : 1.3.6.1.4.1.19536.10.1.3.1.1.18] |
| panduit_pdug5_outlet_current_Load | Panduit Pdug5 Outlet Current Load | % | 1.0.0 | Monitors the current percent load, based on the rated current capacity.[PANDUIT-MIB :: pdug5OutletCurrentPercentLoad : 1.3.6.1.4.1.19536.10.1.5.1.1.11] |
Palo Alto - DOS Monitoring
Description
Template to monitor DOS(Denial of Service for) Palo Alto
Prerequisites
No prerequisite
Supported Metric
| Monitor Name | Metric Name | Metric Display Name | Unit | Description |
|---|---|---|---|---|
| Palo Alto Firewall - DOS Monitor | paloalto_Dos_ZoneRedMax | Palo Alto Dos Zone RED Maximum | count | It monitors the palo alto Dos zone RED Maximum.[PAN-COMMON-MIB::panFlowDosZoneRedMax:1.3.6.1.4.1.25461.2.1.2.1.19.8.32.0] |
| paloalto_Dos_RedUdp | Palo Alto Dos Red Udp | count | It monitors the Paloalto Dos red udp.[panFlowDosRedUdp:1.3.6.1.4.1.25461.2.1.2.1.19.8.18] | |
| paloalto_Dos_RedIp | Palo Alto Dos Red Ip | count | It monitors the palo alto Dos red Ip.[PAN-COMMON-MIB::panFlowDosRedIp:1.3.6.1.4.1.25461.2.1.2.1.19.8.16.0] | |
| paloalto_Dos_RuleAgBlkDur | Palo Alto Dos Aggregate Profile Bulk Duration | count | It monitors the palo alto Dos aggregate profile bulk duration.[PAN-COMMON-MIB::panFlowDosRuleAgBlkDur:1.3.6.1.4.1.25461.2.1.2.1.19.8.19.0] | |
| paloalto_Dos_RuleDropClRedMax | Palo Alto Dos Classified RED Maximum | count | It monitors the palo alto Dos classified RED maximum.[PAN-COMMON-MIB::panFlowDosRuleDropClRedMax:1.3.6.1.4.1.25461.2.1.2.1.19.8.27.0] | |
| paloalto_Dos_ZoneRedAct | Palo Alto Dos Zone RED Activate | count | It monitors the palo alto Dos zone RED.[PAN-COMMON-MIB::panFlowDosZoneRedAct:1.3.6.1.4.1.25461.2.1.2.1.19.8.31.0] | |
| paloalto_Dos_RedIcmp | Palo Alto Dos Red Icmp | count | It monitors the Palo Alto Dos red Icmp.[PAN-COMMON-MIB::panFlowDosRedIcmp:1.3.6.1.4.1.25461.2.1.2.1.19.8.14.0] | |
| paloalto_Dos_RuleDropClBlkDur | Palo Alto Dos Classified Profile Bulk Duration | count | It monitors the palo alto Dos classified profile bulk duration.[PAN-COMMON-MIB::panFlowDosRuleDropClBlkDur:1.3.6.1.4.1.25461.2.1.2.1.19.8.25.0] | |
| paloalto_Dos_ClMaxSessLimit | Palo Alto Dos Classified Profile Bulk Duration | count | It monitors the palo alto Dos classified profile bulk duration.[PAN-COMMON-MIB::panFlowDosRuleDropClBlkDur:1.3.6.1.4.1.25461.2.1.2.1.19.8.25.0] | |
| paloalto_Dos_RuleDeny | Palo Alto Dos Deny | count | It monitors the palo alto Dos deny.[PAN-COMMON-MIB::panFlowDosRuleDeny:1.3.6.1.4.1.25461.2.1.2.1.19.8.22.0] | |
| paloalto_Dos_RuleAgRedMax | Palo Alto Dos Aggregate Profile RED Maximum | count | It monitors the palo alto Dos aggregate profile RED Maximum.[PAN-COMMON-MIB::panFlowDosRuleAgRedMax:1.3.6.1.4.1.25461.2.1.2.1.19.8.21.0] | |
| paloalto_Dos_AgMaxSessLimit | Palo Alto Dos Aggregate Profile Max Session Limit | count | It monitors the session limit for aggregate profile drop session.[PAN-COMMON-MIB::panFlowDosAgMaxSessLimit:1.3.6.1.4.1.25461.2.1.2.1.19.8.1.0] | |
| paloalto_Dos_RuleDropClassified | Palo Alto Dos classified Rate Limiting | count | It monitors the palo alto Dos classified rate limiting.[PAN-COMMON-MIB::panFlowDosRuleDropClassified:1.3.6.1.4.1.25461.2.1.2.1.19.8.28.0] | |
| paloalto_Dos_RuleAgRedAct | Palo Alto Dos Aggregate Profile RED Activate | count | It monitors the palo alto Dos aggregate profile.[PAN-COMMON-MIB::panFlowDosRuleAgRedAct:1.3.6.1.4.1.25461.2.1.2.1.19.8.20.0] | |
| paloalto_Dos_RuleDropAggr | Palo Alto Dos Aggregate Rate Limiting | count | It monitors the palo alto Dos aggregate rate limiting | |
| paloalto_Dos_SyncookieMax | Palo Alto Dos Syn Cookie Maximum | count | It monitors the palo alto Dos syn Cookie.[PAN-COMMON-MIB::panFlowDosSyncookieMax:1.3.6.1.4.1.25461.2.1.2.1.19.8.30.0] | |
| paloalto_Dos_DropIpBlocked | Palo Alto Dos Drop Ip Blocked | count | It provides the palo alto Dos drop Ip blocked.[PAN-COMMON-MIB::panFlowDosDropIpBlocked:1.3.6.1.4.1.25461.2.1.2.1.19.8.13.0] | |
| paloalto_Dos_SyncookieBlkDur | Palo Alto Dos Syn Cookie Bulk Duration | count | It monitors the palo alto Dos syn cookie bulk duration.[PAN-COMMON-MIB::panFlowDosSyncookieBlkDur:1.3.6.1.4.1.25461.2.1.2.1.19.8.29.0] | |
| paloalto_Dos_RedIcmp6 | Palo Alto Dos Red Icmp6 | count | It monitors the palo alto Dos red Icmp6.[PAN-COMMON-MIB::panFlowDosRedIcmp6:1.3.6.1.4.1.25461.2.1.2.1.19.8.15.0] | |
| paloalto_Dos_RuleDropClRedAct | Palo Alto Dos Classified Profile RED Threshold | count | It monitors the palo alto Dos classified profile RED threshold.[PAN-COMMON-MIB::panFlowDosRuleDropClRedAct:1.3.6.1.4.1.25461.2.1.2.1.19.8.26.0] | |
| paloalto_Dos_ClSyncookieBlkDur | Palo Alto Dos Classified Profile Syn Cookie Bulk Duration | count | It monitors the palo alto DOS classified profile syn cookie bulk duration.[PAN-COMMON-MIB::panFlowDosClSyncookieBlkDur:1.3.6.1.4.1.25461.2.1.2.1.19.8.6.0] | |
| paloalto_Dos_RuleDrop | Palo Alto Dos Drop | count | It monitors the palo alto Dos drop.[PAN-COMMON-MIB::panFlowDosRuleDrop:1.3.6.1.4.1.25461.2.1.2.1.19.8.23.0] | |
| paloalto_Dos_ClSyncookieMax | Palo Alto Dos Classified Profile Syn Cookie Maximum Threshold | count | It provides the palo alto Dos classified profile syn cookie maximum threshold.[panFlowDosClSyncookieMax:1.3.6.1.4.1.25461.2.1.2.1.19.8.7.0] | |
| paloalto_Dos_RedTcp | Palo Alto Dos Red Tcp | count | It monitors the Palo Alto Dos red Tcp.[PAN-COMMON-MIB::panFlowDosRedTcp:1.3.6.1.4.1.25461.2.1.2.1.19.8.17.0] |
Palo Alto - DOS Monitoring - V2
Description
This monitors Denial of Service (DoS) metrics for Palo Alto Networks firewalls using specific OIDs from the PAN-COMMON-MIB:
Session Limits and Restrictions
Aggregate Maximum Session Limit
panFlowDosAgMaxSessLimit:1.3.6.1.4.1.25461.2.1.2.1.19.8.1.0Classified Maximum Session Limit
panFlowDosClMaxSessLimit:1.3.6.1.4.1.25461.2.1.2.1.19.8.3.0
Syncookie Protections
Classified Syncookie Block Duration
panFlowDosClSyncookieBlkDur:1.3.6.1.4.1.25461.2.1.2.1.19.8.6.0Classified Syncookie Maximum Limit
panFlowDosClSyncookieMax:1.3.6.1.4.1.25461.2.1.2.1.19.8.7.0General Syncookie Block Duration
panFlowDosSyncookieBlkDur:1.3.6.1.4.1.25461.2.1.2.1.19.8.29.0General Syncookie Maximum Limit
panFlowDosSyncookieMax:1.3.6.1.4.1.25461.2.1.2.1.19.8.30.0
Traffic Drops and Blocks
Dropped IP Packets Blocked
panFlowDosDropIpBlocked:1.3.6.1.4.1.25461.2.1.2.1.19.8.13.0Dropped Traffic Types
- ICMP:
panFlowDosRedIcmp:1.3.6.1.4.1.25461.2.1.2.1.19.8.14.0 - ICMPv6:
panFlowDosRedIcmp6:1.3.6.1.4.1.25461.2.1.2.1.19.8.15.0 - IP:
panFlowDosRedIp:1.3.6.1.4.1.25461.2.1.2.1.19.8.16.0 - TCP:
panFlowDosRedTcp:1.3.6.1.4.1.25461.2.1.2.1.19.8.17.0 - UDP:
panFlowDosRedUdp:1.3.6.1.4.1.25461.2.1.2.1.19.8.18.0
- ICMP:
Policy-Based Drops and Denials
Policy Deny
panFlowPolicyDeny:1.3.6.1.4.1.25461.2.1.2.1.19.8.10.0Rule-Based Denial and Drop Metrics
- Rule Deny:
panFlowDosRuleDeny:1.3.6.1.4.1.25461.2.1.2.1.19.8.22.0 - Rule Drop:
panFlowDosRuleDrop:1.3.6.1.4.1.25461.2.1.2.1.19.8.23.0
- Rule Deny:
Rule-Based Blocking and Reduction Actions
Aggregate Rule Block Duration
panFlowDosRuleAgBlkDur:1.3.6.1.4.1.25461.2.1.2.1.19.8.19.0Aggregate Reduction Actions
panFlowDosRuleAgRedAct:1.3.6.1.4.1.25461.2.1.2.1.19.8.20.0Aggregate Maximum Reduction
panFlowDosRuleAgRedMax:1.3.6.1.4.1.25461.2.1.2.1.19.8.21.0Classified Rule Block Duration
panFlowDosRuleDropClBlkDur:1.3.6.1.4.1.25461.2.1.2.1.19.8.25.0Classified Reduction Actions
panFlowDosRuleDropClRedAct:1.3.6.1.4.1.25461.2.1.2.1.19.8.26.0Classified Maximum Reduction
panFlowDosRuleDropClRedMax:1.3.6.1.4.1.25461.2.1.2.1.19.8.27.0Classified Rule Drops
panFlowDosRuleDropClassified:1.3.6.1.4.1.25461.2.1.2.1.19.8.28.0
Zone-Based Reduction Actions
Zone Reduction Actions
panFlowDosZoneRedAct:1.3.6.1.4.1.25461.2.1.2.1.19.8.31.0Zone Maximum Reduction
panFlowDosZoneRedMax:1.3.6.1.4.1.25461.2.1.2.1.19.8.32.0
Hardware and Software Block Entries
Hardware Blocked Entries
panFlowDosBlkHwEntries:1.3.6.1.4.1.25461.2.1.2.1.19.8.34.0Software Blocked Entries
panFlowDosBlkSwEntries:1.3.6.1.4.1.25461.2.1.2.1.19.8.33.0Number of Block Entries
panFlowDosBlkNumEntries:1.3.6.1.4.1.25461.2.1.2.1.19.8.2.0
Compatibility
Validated on Palo Alto Networks PA-400 series firewall
SysObjectOID: `1.3.6.1.4.1.25461.2.3.56
Prerequisites
Device must have support for PAN-COMMON-MIB
Supported Metric
| Monitor Name | Metric Name | Metric Display Name | Unit | Description |
|---|---|---|---|---|
| Palo Alto Firewall - DOS Monitor - v2 | paloalto_Dos_ZoneRedMax | Palo Alto Dos Zone RED Maximum | count | It monitors the palo alto Dos zone RED Maximum.[PAN-COMMON-MIB::panFlowDosZoneRedMax:1.3.6.1.4.1.25461.2.1.2.1.19.8.32.0] |
| paloalto_Dos_RedUdp | Palo Alto Dos Red Udp | count | It monitors the Paloalto Dos red udp.[panFlowDosRedUdp:1.3.6.1.4.1.25461.2.1.2.1.19.8.18] | |
| paloalto_Dos_RedIp | Palo Alto Dos Red Ip | count | It monitors the palo alto Dos red Ip.[PAN-COMMON-MIB::panFlowDosRedIp:1.3.6.1.4.1.25461.2.1.2.1.19.8.16.0] | |
| paloalto_Dos_RuleAgBlkDur | Palo Alto Dos Aggregate Profile Bulk Duration | count | It monitors the palo alto Dos aggregate profile bulk duration.[PAN-COMMON-MIB::panFlowDosRuleAgBlkDur:1.3.6.1.4.1.25461.2.1.2.1.19.8.19.0] | |
| paloalto_Dos_RuleDropClRedMax | Palo Alto Dos Classified RED Maximum | count | It monitors the palo alto Dos classified RED maximum.[PAN-COMMON-MIB::panFlowDosRuleDropClRedMax:1.3.6.1.4.1.25461.2.1.2.1.19.8.27.0] | |
| paloalto_Dos_ZoneRedAct | Palo Alto Dos Zone RED Activate | count | It monitors the palo alto Dos zone RED.[PAN-COMMON-MIB::panFlowDosZoneRedAct:1.3.6.1.4.1.25461.2.1.2.1.19.8.31.0] | |
| paloalto_Dos_RedIcmp | Palo Alto Dos Red Icmp | count | It monitors the Palo Alto Dos red Icmp.[PAN-COMMON-MIB::panFlowDosRedIcmp:1.3.6.1.4.1.25461.2.1.2.1.19.8.14.0] | |
| paloalto_Dos_RuleDropClBlkDur | Palo Alto Dos Classified Profile Bulk Duration | count | It monitors the palo alto Dos classified profile bulk duration.[PAN-COMMON-MIB::panFlowDosRuleDropClBlkDur:1.3.6.1.4.1.25461.2.1.2.1.19.8.25.0] | |
| paloalto_Dos_ClMaxSessLimit | Palo Alto Dos Classified Profile Bulk Duration | count | It monitors the palo alto Dos classified profile bulk duration.[PAN-COMMON-MIB::panFlowDosRuleDropClBlkDur:1.3.6.1.4.1.25461.2.1.2.1.19.8.25.0] | |
| paloalto_Dos_RuleDeny | Palo Alto Dos Deny | count | It monitors the palo alto Dos deny.[PAN-COMMON-MIB::panFlowDosRuleDeny:1.3.6.1.4.1.25461.2.1.2.1.19.8.22.0] | |
| paloalto_Dos_RuleAgRedMax | Palo Alto Dos Aggregate Profile RED Maximum | count | It monitors the palo alto Dos aggregate profile RED Maximum.[PAN-COMMON-MIB::panFlowDosRuleAgRedMax:1.3.6.1.4.1.25461.2.1.2.1.19.8.21.0] | |
| paloalto_Dos_AgMaxSessLimit | Palo Alto Dos Aggregate Profile Max Session Limit | count | It monitors the session limit for aggregate profile drop session.[PAN-COMMON-MIB::panFlowDosAgMaxSessLimit:1.3.6.1.4.1.25461.2.1.2.1.19.8.1.0] | |
| paloalto_Dos_RuleDropClassified | Palo Alto Dos classified Rate Limiting | count | It monitors the palo alto Dos classified rate limiting.[PAN-COMMON-MIB::panFlowDosRuleDropClassified:1.3.6.1.4.1.25461.2.1.2.1.19.8.28.0] | |
| paloalto_Dos_RuleAgRedAct | Palo Alto Dos Aggregate Profile RED Activate | count | It monitors the palo alto Dos aggregate profile.[PAN-COMMON-MIB::panFlowDosRuleAgRedAct:1.3.6.1.4.1.25461.2.1.2.1.19.8.20.0] | |
| paloalto_Dos_RuleDropAggr | Palo Alto Dos Aggregate Rate Limiting | count | It monitors the palo alto Dos aggregate rate limiting | |
| paloalto_Dos_SyncookieMax | Palo Alto Dos Syn Cookie Maximum | count | It monitors the palo alto Dos syn Cookie.[PAN-COMMON-MIB::panFlowDosSyncookieMax:1.3.6.1.4.1.25461.2.1.2.1.19.8.30.0] | |
| paloalto_Dos_DropIpBlocked | Palo Alto Dos Drop Ip Blocked | count | It provides the palo alto Dos drop Ip blocked.[PAN-COMMON-MIB::panFlowDosDropIpBlocked:1.3.6.1.4.1.25461.2.1.2.1.19.8.13.0] | |
| paloalto_Dos_SyncookieBlkDur | Palo Alto Dos Syn Cookie Bulk Duration | count | It monitors the palo alto Dos syn cookie bulk duration.[PAN-COMMON-MIB::panFlowDosSyncookieBlkDur:1.3.6.1.4.1.25461.2.1.2.1.19.8.29.0] | |
| paloalto_Dos_RedIcmp6 | Palo Alto Dos Red Icmp6 | count | It monitors the palo alto Dos red Icmp6.[PAN-COMMON-MIB::panFlowDosRedIcmp6:1.3.6.1.4.1.25461.2.1.2.1.19.8.15.0] | |
| paloalto_Dos_RuleDropClRedAct | Palo Alto Dos Classified Profile RED Threshold | count | It monitors the palo alto Dos classified profile RED threshold.[PAN-COMMON-MIB::panFlowDosRuleDropClRedAct:1.3.6.1.4.1.25461.2.1.2.1.19.8.26.0] | |
| paloalto_Dos_ClSyncookieBlkDur | Palo Alto Dos Classified Profile Syn Cookie Bulk Duration | count | It monitors the palo alto DOS classified profile syn cookie bulk duration.[PAN-COMMON-MIB::panFlowDosClSyncookieBlkDur:1.3.6.1.4.1.25461.2.1.2.1.19.8.6.0] | |
| paloalto_Dos_RuleDrop | Palo Alto Dos Drop | count | It monitors the palo alto Dos drop.[PAN-COMMON-MIB::panFlowDosRuleDrop:1.3.6.1.4.1.25461.2.1.2.1.19.8.23.0] | |
| paloalto_Dos_ClSyncookieMax | Palo Alto Dos Classified Profile Syn Cookie Maximum Threshold | count | It provides the palo alto Dos classified profile syn cookie maximum threshold.[panFlowDosClSyncookieMax:1.3.6.1.4.1.25461.2.1.2.1.19.8.7.0] | |
| paloalto_Dos_RedTcp | Palo Alto Dos Red Tcp | count | It monitors the Palo Alto Dos red Tcp.[PAN-COMMON-MIB::panFlowDosRedTcp:1.3.6.1.4.1.25461.2.1.2.1.19.8.17.0] | |
| paloalto_Dos_PolicyDeny | Palo Alto Dos Policy Deny | count | It monitors the palo alto Policy Deny.[PAN-COMMON-MIB::panFlowPolicyDeny:1.3.6.1.4.1.25461.2.1.2.1.19.8.10.0] | |
| paloalto_Dos_BlkHwEntries | Palo Alto Dos Hardware Block Entry Count | count | It monitors the palo alto dos hardware block entry count. [ PAN-COMMON-MIB::panFlowDosBlkHwEntries:1.3.6.1.4.1.25461.2.1.2.1.19.8.34.0 ] | |
| paloalto_Dos_BlkSwEntries | Palo Alto Dos Software Block Entry Count | count | It monitors the palo alto dos software block entry count. [PAN-COMMON-MIB::panFlowDosBlkSwEntries:1.3.6.1.4.1.25461.2.1.2.1.19.8.33.0] | |
| paloalto_Dos_BlkNumEntries | Palo Alto Dos Block Entry Count | count | It monitors the palo alto dos block entry count. [PAN-COMMON-MIB:: panFlowDosBlkNumEntries : 1.3.6.1.4.1.25461.2.1.2.1.19.8.2.0 ] |
Palo Alto Firewall
Description
Template to monitor Palo Alto Firewall.
Prerequisites
No prerequisite
Supported Metric
| Monitor Name | Metric Name | Metric Display Name | Unit | Description |
|---|---|---|---|---|
| PA-FW - Global Protect Gateway Active tunnels | paloalto.global.protect.gateway.active.tunnels | Global Protect Gateway Active Tunnels | Provides the number of active tunnels. [OID: 1.3.6.1.4.1.25461.2.1.2.5.1.3] | |
| PA-FW - Global Protect Gateway Utilization | paloalto.global.protect.gateway.utilization | Global Protect Gateway Utilization | % | GlobalProtect Gateway utilization percentage |
| PA-FW - Panorama Server Connection Status | paloalto.connection.status.to.panorama.server | Panorama Server Connection Status | Provides the current connection status to Panorama Server. Possible status values are connected and not-connected. [OID: 1.3.6.1.4.1.25461.2.1.2.4.1.0] | |
| paloalto.connection.status.to.panorama2.server | Panorama2 Server Connection Status | Provides the current connection status to Panorama 2 Server. Possible status values are connected and not-connected. [OID: 1.3.6.1.4.1.25461.2.1.2.4.2.0] | ||
| PA-FW - Session Utilization | paloalto.session.utilization | Session Utilization | % | Provides the session table utilization percentage. Values should be between 0 and 100. [OID: 1.3.6.1.4.1.25461.2.1.2.3.1] |
| paloalto.session.active.tcp | Active TCP sessions | Total number of active TCP sessions. [OID: 1.3.6.1.4.1.25461.2.1.2.3.4.0] | ||
| paloalto.session.active.udp | Active UDP sessions | Total number of active UDP sessions. [OID: 1.3.6.1.4.1.25461.2.1.2.3.5.0] | ||
| paloalto.session.active.icmp | Active ICMP sessions | Total number of active ICMP sessions. [OID: 1.3.6.1.4.1.25461.2.1.2.3.6.0] | ||
| paloalto.session.active | Total Active Sessions | Total number of active sessions (including tcp, udp and icmp sessions). [OID: 1.3.6.1.4.1.25461.2.1.2.3.3.0] | ||
| paloalto.ssl.proxy.utilization | SSL Proxy Utilization | % | Provides the SSL proxy Session utilization percentage. Values should be between 0 and 100.[OID: 1.3.6.1.4.1.25461.2.1.2.3.8] | |
| paloalto.session.max | Max Supported Sessions | Total number of sessions supported. [1.3.6.1.4.1.25461.2.1.2.3.2.0] | ||
| PA-FW - Vsys Session Utilization | paloalto.vsys.session.utilization | Vsys Session Utilization | % | Vsys utilization percentage, if session limit is configured.If session limit is not configured, this value is '0' |
Palo Alto Firewall - v2
Description
Template to monitor Palo Alto Firewall.
Prerequisites
Device should support PAN-COMMON-MIB
Supported Metric
| Monitor Name | Metric Name | Metric Display Name | Unit | Description |
|---|---|---|---|---|
| PA-FW - Global Protect Gateway Active tunnels | paloalto.global.protect.gateway.active.tunnels | Global Protect Gateway Active Tunnels | Provides the number of active tunnels. [OID: 1.3.6.1.4.1.25461.2.1.2.5.1.3] | |
| PA-FW - Session Utilization | paloalto.session.active | Total Active Sessions | Total number of active sessions (including tcp, udp and icmp sessions). [OID: 1.3.6.1.4.1.25461.2.1.2.3.3.0] | |
| paloalto.session.active.tcp | Active TCP sessions | Total number of active TCP sessions. [OID: 1.3.6.1.4.1.25461.2.1.2.3.4.0] | ||
| paloalto.session.max | Max Supported Sessions | Total number of sessions supported. [1.3.6.1.4.1.25461.2.1.2.3.2.0] | ||
| paloalto.session.active.udp | Active UDP sessions | Total number of active UDP sessions. [OID: 1.3.6.1.4.1.25461.2.1.2.3.5.0] | ||
| paloalto.session.active.icmp | Active ICMP sessions | Total number of active ICMP sessions. [OID: 1.3.6.1.4.1.25461.2.1.2.3.6.0] | ||
| paloalto.session.utilization | Session Utilization | % | Provides the session table utilization percentage. Values should be between 0 and 100. [OID: 1.3.6.1.4.1.25461.2.1.2.3.1] | |
| paloalto.ssl.proxy.utilization | SSL Proxy Utilization | % | Provides the SSL proxy Session utilization percentage. Values should be between 0 and 100.[OID: 1.3.6.1.4.1.25461.2.1.2.3.8] | |
| PA-FW - Panorama Server Connection Status | paloalto.connection.status.to.panorama2.server | Panorama2 Server Connection Status | Provides the current connection status to Panorama 2 Server. Possible status values are connected and not-connected. [OID: 1.3.6.1.4.1.25461.2.1.2.4.2.0] | |
| paloalto.connection.status.to.panorama.server | Panorama Server Connection Status | Provides the current connection status to Panorama Server. Possible status values are connected and not-connected. [OID: 1.3.6.1.4.1.25461.2.1.2.4.1.0] | ||
| PA-FW - Vsys Session Utilization | paloalto.vsys.session.utilization | Vsys Session Utilization | % | Vsys utilization percentage, if session limit is configured.If session limit is not configured, this value is '0' |
| PA-FW - Global Protect Gateway Utilization | paloalto.global.protect.gateway.utilization | Global Protect Gateway Utilization | % | GlobalProtect Gateway utilization percentage |
| Palo Alto FW - Vsys Active Session | paloalto_vsys_ActiveSessions | Palo Alto vSys Active Sessions | count | It monitor active sessions on the Vsys. [PAN-COMMON-MIB :: panVsysName : 1.3.6.1.4.1.25461.2.1.2.3.9.1.2 , panVsysActiveSessions : 1.3.6.1.4.1.25461.2.1.2.3.9.1.4] |
Palo Alto Firewall - HA State - Primary
Description
Monitors the Palo Alto firewall’s high-availability(HA) state of Active/Primary node and this template should be applied only on Primary node. Apply this template only when failover configured on these nodes. [panSysHAState - 1.3.6.1.4.1.25461.2.1.2.1.11.0]
Prerequisites
No prerequisite
Supported Metric
| Monitor Name | Metric Name | Metric Display Name | Unit | Description |
|---|---|---|---|---|
| PA-FW - HA State - Primary | paloalto.primary.node.ha.state | HA State - Primary | Monitors the Palo Alto Active/Primary node's high-availability(HA) state and alerts if it equals to Passive. [OID: 1.3.6.1.4.1.25461.2.1.2.1.11.0 - panSysHAState] |
Palo Alto Firewall - Performance - HR-MIB
Description
Template to monitor cpu utilization and memory utilization for palo alto firewall.
Prerequisites
No prerequisite
Supported Metric
| Monitor Name | Metric Name | Metric Display Name | Unit | Description |
|---|---|---|---|---|
| Memory Utilization - HR-MIB | system.memory.util.percent | Memory Utilization | % | This monitor provides physical and virtual memory utilization using HOST-RESOURCES-MIB. [OID: 1.3.6.1.2.1.25.2.3.1.5, 1.3.6.1.2.1.25.2.3.1.6, 1.3.6.1.2.1.25.2.3.1.4] |
| system.memory.used | Memory Used | Bytes | Represents the amount of memory allocated. [OID: 1.3.6.1.2.1.25.2.3.1.6] | |
| system.memory.free | Memory Free | Bytes | Represents the free system memory. [OID: 1.3.6.1.2.1.25.2.3.1.5, 1.3.6.1.2.1.25.2.3.1.6, 1.3.6.1.2.1.25.2.3.1.4] | |
| Palo Alto CPU Utilization - HR-MIB | paloalto_mgmtplane_cpu_Utilization | Palo Alto Management Plane CPU Utilization | % | It provides the CPU load average over last 60 seconds. This value will match the value shown on the GUI dashboard > resource information > % CPU in PAN-OS 3.x.[HOST-RESOURCES-MIB::hrProcessorLoad.1:1.3.6.1.2.1.25.3.3.1.2.1] |
| paloalto_dataplane_cpu_Utilization | Palo Alto Data Plane CPU Utilization | % | It provides the CPU load average on data plane over last 60 seconds.[HOST-RESOURCES-MIB::hrProcessorLoad.2:1.3.6.1.2.1.25.3.3.1.2.2] |
Palo Alto Firewall - Performance - HR-MIB - v2
Description
Template to monitor cpu utilization , memory utilization and disk utilization for palo alto firewall. [HOST-RESOURCES-MIB::hrProcessorLoad.1:1.3.6.1.2.1.25.3.3.1.2.1, hrProcessorLoad.2:1.3.6.1.2.1.25.3.3.1.2.2 , hrStorageDescr:1.3.6.1.2.1.25.2.3.1.3, hrStorageType:1.3.6.1.2.1.25.2.3.1.2, hrStorageAllocationUnits : 1.3.6.1.2.1.25.2.3.1.4 , hrStorageSize:1.3.6.1.2.1.25.2.3.1.5, hrStorageUsed:1.3.6.1.2.1.25.2.3.1.6 ].
Prerequisites
Device must have support for HOST-RESOURCES-MIB.
Supported Metrics
| Monitor Name | Metric Name | Metric Display Name | Unit | Description |
|---|---|---|---|---|
| Palo Alto CPU Utilization - HR-MIB | paloalto_mgmtplane_cpu_Utilization | Palo Alto Management Plane CPU Utilization | % | It provides the CPU load average over last 60 seconds. This value will match the value shown on the GUI dashboard-> resource information-> % CPU in PAN-OS 3.x.[HOST-RESOURCES-MIB::hrProcessorLoad.1: 1.3.6.1.2.1.25.3.3.1.2.1] |
| paloalto_dataplane_cpu_Utilization | Palo Alto Data Plane CPU Utilization | % | It provides the CPU load average on data plane over last 60 seconds.[HOST-RESOURCES-MIB::hrProcessorLoad.2:1.3.6.1.2.1.25.3.3.1.2.2] | |
| Memory Utilization - HR-MIB | system.memory.util.percent | Memory Utilization | % | This monitor provides physical and virtual memory utilization using HOST-RESOURCES-MIB. [OID: 1.3.6.1.2.1.25.2.3.1.5, 1.3.6.1.2.1.25.2.3.1.6, 1.3.6.1.2.1.25.2.3.1.4] |
| system.memory.free | Memory Free | Bytes | Represents the free system memory. [OID: 1.3.6.1.2.1.25.2.3.1.5, 1.3.6.1.2.1.25.2.3.1.6, 1.3.6.1.2.1.25.2.3.1.4] | |
| system.memory.used | Memory Used | Bytes | Represents the amount of memory allocated. [OID: 1.3.6.1.2.1.25.2.3.1.6] | |
| Storage Utilization - HR-MIB | system.disk.util.percent | Disk Utilization | % | Monitors the disk utilization. [OIDs: 1.3.6.1.2.1.25.2.3.1.4, 1.3.6.1.2.1.25.2.3.1.5, 1.3.6.1.2.1.25.2.3.1.6] |
Palo Alto M-100 Appliance Monitors
Description
Template to monitor Palo Alto M-100 appliance. It monitors the parameters like the number of Active Sessions (TCP, UDP and ICMP), Session Utilization Percentage, Maximum Sessions, Fan and Temperature Status, Log Collector Log Rate and Log Collector Disk Usage, vSys Session Utilization, Global Protect Gateway Active Tunnels, GlobalProtect Gateway utilization percentage, Panorama connection status and SSL proxy Session utilization percentage.
Prerequisites
No prerequisite
Supported Metric
| Monitor Name | Metric Name | Metric Display Name | Unit | Description |
|---|---|---|---|---|
| PA-FW - Global Protect Gateway Active tunnels | paloalto.global.protect.gateway.active.tunnels | Global Protect Gateway Active Tunnels | Provides the number of active tunnels. [OID: 1.3.6.1.4.1.25461.2.1.2.5.1.3] | |
| PA-FW - Global Protect Gateway Utilization | paloalto.global.protect.gateway.utilization | Global Protect Gateway Utilization | % | GlobalProtect Gateway utilization percentage |
| PA-FW - Panorama Server Connection Status | paloalto.connection.status.to.panorama.server | Panorama Server Connection Status | Provides the current connection status to Panorama Server. Possible status values are connected and not-connected. [OID: 1.3.6.1.4.1.25461.2.1.2.4.1.0] | |
| paloalto.connection.status.to.panorama2.server | Panorama2 Server Connection Status | Provides the current connection status to Panorama 2 Server. Possible status values are connected and not-connected. [OID: 1.3.6.1.4.1.25461.2.1.2.4.2.0] | ||
| PA-FW - Session Utilization | paloalto.session.utilization | Session Utilization | % | Provides the session table utilization percentage. Values should be between 0 and 100. [OID: 1.3.6.1.4.1.25461.2.1.2.3.1] |
| paloalto.session.active.tcp | Active TCP sessions | Total number of active TCP sessions. [OID: 1.3.6.1.4.1.25461.2.1.2.3.4.0] | ||
| paloalto.session.active.udp | Active UDP sessions | Total number of active UDP sessions. [OID: 1.3.6.1.4.1.25461.2.1.2.3.5.0] | ||
| paloalto.session.active.icmp | Active ICMP sessions | Total number of active ICMP sessions. [OID: 1.3.6.1.4.1.25461.2.1.2.3.6.0] | ||
| paloalto.session.active | Total Active Sessions | Total number of active sessions (including tcp, udp and icmp sessions). [OID: 1.3.6.1.4.1.25461.2.1.2.3.3.0] | ||
| paloalto.ssl.proxy.utilization | SSL Proxy Utilization | % | Provides the SSL proxy Session utilization percentage. Values should be between 0 and 100.[OID: 1.3.6.1.4.1.25461.2.1.2.3.8] | |
| paloalto.session.max | Max Supported Sessions | Total number of sessions supported. [1.3.6.1.4.1.25461.2.1.2.3.2.0] | ||
| PA-FW - Vsys Session Utilization | paloalto.vsys.session.utilization | Vsys Session Utilization | % | Vsys utilization percentage, if session limit is configured.If session limit is not configured, this value is '0' |
| PA-FW - Log Collector Disk Usage | paloalto.lc.disk.usage | Log Collector Disk Usage | MB | The Log disk usage on the Log Collector. [OID: 1.3.6.1.4.1.25461.2.1.2.6.1.3.1.2] |
| PA-FW - Log Collector Log Rate | paloalto.lc.log.rate | Log Collector Write Log Rate | psec | Represents the write rate in logs/s on the Log Collection. [OID: 1.3.6.1.4.1.25461.2.1.2.6.1.1.0] |
Palo Alto CPU Average Utilization - HR-MIB
Description
Monitors the average, over the last minute, of the percentage of time that this processor was not idle. It will calculate average utilization of all cores. i.e (core1_util + core2_util + core3_util +..+ coreN_util)/no_of_cores). HOST-RESOURCES-MIB::hrProcessorLoad - 1.3.6.1.2.1.25.3.3.1.2.
Prerequisites
Device must have support for HOST-RESOURCES-MIB
Supported Metric
| Monitor Name | Metric Name | Metric Display Name | Unit | Description |
|---|---|---|---|---|
| CPU Average Utilization - HR-MIB | system_cpu_avg_Utilization | System CPU Average Utilization | % | The average, over the last minute, of the percentage of time that this processor was not idle. It will calculate average utilization of all cores. i.e (core1_util + core2_util + core3_util +..+ coreN_util)/no_of_cores). HOST-RESOURCES-MIB::hrProcessorLoad - 1.3.6.1.2.1.25.3.3.1.2. |
Panasonic - Camera Health
Description
Template to monitor the panasonic camera health status like Camera Power Status,RS-485 Status,Storage Status,Storage Free Percent,Temperature Sensor Status,Pan Status,Tilt Status, Zoom status,Focus Status,IR LED Status,Fan Status,Heater Status,Defroster Status. PANA-CAM-MIB
Prerequisites
No prerequisite
Supported Metric
| Monitor Name | Metric Name | Metric Display Name | Unit | Description |
|---|---|---|---|---|
| Panasonic - Camera Defroster Status | pana.cam.defroster.state | Camera Defroster Status | It monitors the panasonic camera defroster status. [PANA-CAM-MIB::defrosterState - 1.3.6.1.4.1.258.5100.100.1.18.2.1.3] | |
| Panasonic - Camera Fan Status | pana.cam.fan.state | Camera Fan Status | It monitors the panasonic camera fan status. [PANA-CAM-MIB::fanState - 1.3.6.1.4.1.258.5100.100.1.16.2.1.3] | |
| Panasonic - Camera Health | pana.cam.rs485.state | Camera RS-485 Status | It monitors the panasonic camera RS-485 status[PANA-CAM-MIB::rs485State - 1.3.6.1.4.1.258.5100.100.1.7.1.0] | |
| pana.cam.power.state | Camera Power Status | It monitors the panasonic camera power supply status[PANA-CAM-MIB::pwState - 1.3.6.1.4.1.258.5100.100.1.2.1.0] | ||
| pana.cam.pan.state | Camera Pan Status | It monitors the panasonic camera pan status[PANA-CAM-MIB::panState - 1.3.6.1.4.1.258.5100.100.1.13.1.1.0] | ||
| pana.cam.focus.state | Camera Focus Status | It monitors the panasonic camera focus status[PANA-CAM-MIB::focusState - 1.3.6.1.4.1.258.5100.100.1.13.4.1.0] | ||
| pana.cam.zoom.state | Camera Zoom status | It monitors the panasonic camera zoom status[PANA-CAM-MIB::zoomState - 1.3.6.1.4.1.258.5100.100.1.13.3.1.0] | ||
| pana.cam.tilt.state | Camera Tilt Status | It monitors the panasonic camera tilt status[PANA-CAM-MIB::tiltState - 1.3.6.1.4.1.258.5100.100.1.13.2.1.0] | ||
| Panasonic - Camera Heater Status | pana.cam.heater.state | Camera Heater Status | It monitors the panasonic camera heater status. [PANA-CAM-MIB::heaterState - 1.3.6.1.4.1.258.5100.100.1.17.2.1.3] | |
| Panasonic - Camera IR LED Status | pana.cam.ir.led.state | Camera IR LED Status | It monitors the panasonic camera IR LED status. [PANA-CAM-MIB::irLEDState - 1.3.6.1.4.1.258.5100.100.1.15.2.1.3] | |
| Panasonic - Camera Storage | pana.cam.storage.free.percent | Camera Storage Free Percent | % | It monitors the panasonic camera free storage in percentage. [PANA-CAM-MIB::storageRemainingCapacity - 1.3.6.1.4.1.258.5100.100.1.10.2.1.4] |
| pana.cam.storage.state | Camera Storage Status | It monitors the panasonic camera storage status[PANA-CAM-MIB::storageState - 1.3.6.1.4.1.258.5100.100.1.10.2.1.3] | ||
| Panasonic - Camera Temperature Sensor Status | pana.cam.temp.sensor.state | Camera Temperature Sensor Status | It monitors the panasonic camera temperature sensor status. [PANA-CAM-MIB::tempSensorState - 1.3.6.1.4.1.258.5100.100.1.11.2.1.3] |
Ping Monitor - G2
Description
Checks the reachability of a device in a network and measures the packet loss and round-trip time for messages sent from the OpsRamp Gateway to the device and back with new engine.
Prerequisites
No prerequisite
Supported Metric
| Monitor Name | Metric Name | Metric Display Name | Unit | Description |
|---|---|---|---|---|
| Ping Monitor - G2 | system.ping.pl | PING | Checks device connectivity using the ICMP. Measure the packet loss percent | |
| system.ping.rta | PING | NULL | Checks device connectivity using the ICMP. Measure the Round Trip time |
Power Ethernet PSE Status - G2
Description
Monitors the operational status of the main PSE. [POWER-ETHERNET-MIB]
Prerequisites
No prerequisite
Supported Metric
| Monitor Name | Metric Name | Metric Display Name | Unit | Description |
|---|---|---|---|---|
| Power Source Entity(PSE) Status | pse.oper.status | Power Source Entity (PSE) Operational Status | Monitors the operational status of the main PSE. Possible values are 1- on, 2 - off, 3- faulty. [OID: 1.3.6.1.2.1.105.1.3.1.1.3] |
Printer Error State - HR-MIB
Description
Template to monitor the printer error conditions like low paper, no paper, low toner, no toner, door open, jammed, offline, service requested, input tray missing, output tray missing, marker supply missing, output near full, output full, input tray empty, and overdue preventive maintenance.
Prerequisites
NULL
Supported Metric
| Monitor Name | Metric Name | Metric Display Name | Unit | Description |
|---|---|---|---|---|
| Printer Error State HR-MIB | hr_printer_ServiceRequestedState | HR Printer ServiceRequested State | Monitors the HR Printer ServiceRequested State.[1.3.6.1.2.1.25.3.5.1.2] | |
| hr_printer_OfflineState | HR Printer Offline State | Monitors the HR Printer Offline State.[1.3.6.1.2.1.25.3.5.1.2] | ||
| hr_printer_OutputNearFullState | HR Printer OutputNearFull State | Monitors the HR Printer OutputNearFull State.[1.3.6.1.2.1.25.3.5.1.2] | ||
| hr_printer_NoTonerState | HR Printer NoToner State | HR Printer NoToner State.[1.3.6.1.2.1.25.3.5.1.2] | ||
| hr_printer_InputTrayMissingState | HR Printer Input Tray Missing State | Monitors the HR Printer Input Tray Missing State | ||
| hr_printer_NoPaperState | HR Printer NoPaper State | Monitors the HR Printer NoPaper State.[1.3.6.1.2.1.25.3.5.1.2] | ||
| hr_printer_LowTonerState | HR Printer LowToner State | Monitors the HR Printer LowToner State.[1.3.6.1.2.1.25.3.5.1.2] | ||
| hr_printer_OverduePreventMaint_State | HR Printer OverduePreventMaintenance State | Monitors the HR Printer OverduePreventMaintenance State | ||
| hr_printer_JammedState | HR Printer Jammed State | Monitors the HR Printer Jammed State.[1.3.6.1.2.1.25.3.5.1.2] | ||
| hr_printer_DoorOpenState | HR Printer DoorOpen State | Monitors the HR Printer DoorOpen State.[1.3.6.1.2.1.25.3.5.1.2] | ||
| hr_printer_lowPaperState | HR Printer lowPaper State | Monitors the HR Printer lowPaper State.[1.3.6.1.2.1.25.3.5.1.2] | ||
| hr_printer_MarkerSupplyState | HR Printer MarkerSupply State | Monitors the HR Printer MarkerSupply State.[1.3.6.1.2.1.25.3.5.1.2] | ||
| hr_printer_OutputTrayMissingState | HR Printer Output Tray Missing State | Monitors the HR Printer Output Tray Missing State.[1.3.6.1.2.1.25.3.5.1.2] | ||
| hr_printer_InputTrayEmptyState | HR Printer InputTrayEmpty State | Monitors the HR Printer InputTrayEmpty State.[1.3.6.1.2.1.25.3.5.1.2] | ||
| hr_printer_OutputFullState | HR Printer OutputFull State | Monitors the HR Printer OutputFull State.[1.3.6.1.2.1.25.3.5.1.2] |
Printer Health & Statistics
Description
Monitors the printer health and hardware statistics like printer status, printer cover status, printer marker status, input status, input current level and output status.
Prerequisites
Device should have support for Printer-MIB & HOST-RESOURCES-MIB.
Supported Metric
| Monitor Name | Metric Name | Metric Display Name | Unit | Description |
|---|---|---|---|---|
| Printer Status - HR-MIB | printer_Status | Printer Status | Monitors the current status of this printer device.[HOST-RESOURCES-MIB :: hrPrinterStatus : 1.3.6.1.2.1.25.3.5.1.1].Possible values are other(1),unknown(2),idle(3),printing(4),warmup(5). | |
| Printer Cover Status - PRINTER-MIB | printer_cover_Status | Printer Cover Status | Monitors the status of this cover sub-unit.[Printer-MIB :: prtCoverDescription : 1.3.6.1.2.1.43.6.1.1.2 , prtCoverStatus : 1.3.6.1.2.1.43.6.1.1.3].Possible values are other(1),unknown(2),coverOpen(3),coverClosed(4),interlockOpen(5),interlockClosed(6). | |
| Printer Marker Status - PRINTER-MIB | printer_marker_Status | Printer Marker Status | Monitors the current status of this marker sub-unit.[Printer-MIB :: prtMarkerStatus : 1.3.6.1.2.1.43.10.2.1.15].Possible values are Available and Idle(0),Available and Standby(2),Available and Active(4),Available and Busy(6),Unavailable and OnRequest(1),Unavailable because Broken(3),Unknown(5). | |
| Printer Input Status - PRINTER-MIB | printer_input_Status | Printer Input Status | Monitors the current status of this input sub-unit. [ Printer-MIB :: prtInputStatus : 1.3.6.1.2.1.43.8.2.1.11 ] Possible values are : 0 : Available and Idle , 1 : Unavailable and OnRequest , 2 : Available and Standby , 3 : Unavailable because Broken , 4 : Available and Active , 5 : Unknown, 6 : Available and Busy. | |
| printer_input_currentlevel_Items | Printer Input Current Level Items | Monitors the current capacity of the input sub-unit in input sub-unit capacity units i.e., items. [ Printer-MIB :: prtInputCurrentLevel : 1.3.6.1.2.1.43.8.2.1.10 ]. | ||
| Printer Output Status - PRINTER-MIB | printer_output_Status | Printer Output Status | Monitors the current status of this output sub-unit. [ Printer-MIB :: prtOutputStatus : 1.3.6.1.2.1.43.9.2.1.6 ] Possible values are : 0 : Available and Idle , 1 : Unavailable and OnRequest , 2 : Available and Standby , 3 : Unavailable because Broken , 4 : Available and Active , 5 : Unknown, 6 : Available and Busy. |
Printer Marker Supply Level - Ext
Description
Monitors the printer marker supply level for toner,ink and toner cartridge. Validated on HP PageWide Pro 477dw MFP, HP Color LaserJet MFP M480 and HP Color LaserJet MFP M277n (SysObjOID : 1.3.6.1.4.1.11.2.3.9.1 ). [ Printer-MIB :: prtMarkerSuppliesType : 1.3.6.1.2.1.43.11.1.1.5 , prtMarkerSuppliesDescription : 1.3.6.1.2.1.43.11.1.1.6 , prtMarkerSuppliesSupplyUnit : 1.3.6.1.2.1.43.11.1.1.7 , prtMarkerSuppliesLevel : 1.3.6.1.2.1.43.11.1.1.9 ].
Prerequisites
Device should have support for Printer-MIB.
Supported Metric
| Monitor Name | Metric Name | Metric Display Name | Unit | Description |
|---|---|---|---|---|
| Printer Marker Supply Level - Ext | printer_marker_supply_toner_Percent | Printer Marker Supply Toner Percent | % | Monitors the printer marker supply level for the toner in percentage. [ Printer-MIB :: prtMarkerSuppliesType : 1.3.6.1.2.1.43.11.1.1.5 , prtMarkerSuppliesDescription : 1.3.6.1.2.1.43.11.1.1.6 , prtMarkerSuppliesSupplyUnit : 1.3.6.1.2.1.43.11.1.1.7 , prtMarkerSuppliesLevel : 1.3.6.1.2.1.43.11.1.1.9 ]. |
| printer_marker_supply_tonerCartridge_Percent | Printer Marker Supply Toner Cartridge Percent | % | Monitors the printer marker supply level for the toner cartridge in percentage. [ Printer-MIB :: prtMarkerSuppliesType : 1.3.6.1.2.1.43.11.1.1.5 , prtMarkerSuppliesDescription : 1.3.6.1.2.1.43.11.1.1.6 , prtMarkerSuppliesSupplyUnit : 1.3.6.1.2.1.43.11.1.1.7 , prtMarkerSuppliesLevel : 1.3.6.1.2.1.43.11.1.1.9 ]. | |
| printer_marker_supply_ink_Percent | Printer Marker Supply Ink Percent | % | Monitors the printer marker supply level for the ink in percentage. [ Printer-MIB :: prtMarkerSuppliesType : 1.3.6.1.2.1.43.11.1.1.5 , prtMarkerSuppliesDescription : 1.3.6.1.2.1.43.11.1.1.6 , prtMarkerSuppliesSupplyUnit : 1.3.6.1.2.1.43.11.1.1.7 , prtMarkerSuppliesLevel : 1.3.6.1.2.1.43.11.1.1.9 ]. |
Process Monitor - SNMP V2
Description
This monitor allows monitoring processes count, as well as CPU (%) and memory (Mbytes) usage for process matching the filter. This monitor looks up of the combined process name [1.3.6.1.2.1.25.4.2.1.2] and parameters [1.3.6.1.2.1.25.4.2.1.5] to find the unique match. This template is supported by VG v2.70 or above. [OIDs: Memory - 1.3.6.1.2.1.25.5.1.1.2, CPU - 1.3.6.1.2.1.25.5.1.1.1]
Prerequisites
No prerequisite
Supported Metric
| Monitor Name | Metric Name | Metric Display Name | Unit | Description |
|---|---|---|---|---|
| Process Monitor - SNMP | process.count | Process Count | Monitors the running processes count which satisfies the match criteria. This monitor looks up of the combined process name and parameters to find the unique match. [Process Name - 1.3.6.1.2.1.25.4.2.1.2, Process Parameters - 1.3.6.1.2.1.25.4.2.1.5] | |
| process.memory.usage | Process Memory Usage | MB | Monitors the total memory utilization of all processes which satisfies the match criteria. [OIDs: Process Name - 1.3.6.1.2.1.25.4.2.1.2, Process Parameters - 1.3.6.1.2.1.25.4.2.1.5, Process Memory - 1.3.6.1.2.1.25.5.1.1.2] | |
| process.cpu.usage | Process CPU Usage | % | Monitors the total CPU utilization of all processes which satisfies the match criteria. [OIDs: Process Name - 1.3.6.1.2.1.25.4.2.1.2, Process Parameters - 1.3.6.1.2.1.25.4.2.1.5, Process CPU - 1.3.6.1.2.1.25.5.1.1.1] |
Process Monitor (Full Path) - SNMP V2
Description
This monitor allows monitoring processes count, as well as CPU (%) and memory (Mbytes) usage for process matching the filter. This monitor looks up of the combined process full path [1.3.6.1.2.1.25.4.2.1.4] and parameters [1.3.6.1.2.1.25.4.2.1.5] to find the unique match. This template will be supported by VG v2.70 or above. [OIDs: Memory - 1.3.6.1.2.1.25.5.1.1.2, CPU - 1.3.6.1.2.1.25.5.1.1.1].The updated monitor will involve the removal of whitespaces from the process name.
Prerequisites
No prerequisite
Supported Metric
| Monitor Name | Metric Name | Metric Display Name | Unit | Description |
|---|---|---|---|---|
| Process Monitor (Full Path) - SNMP | process.count | Process Count | Monitors the total CPU utilization of all processes which satisfies the match criteria. [OIDs: Process Path - 1.3.6.1.2.1.25.4.2.1.4, Process Parameters - 1.3.6.1.2.1.25.4.2.1.5, Process CPU - 1.3.6.1.2.1.25.5.1.1.1]. | |
| process.memory.usage | Process Memory Usage | MB | Monitors the total memory utilization of all processes which satisfies the match criteria. [OIDs: Process Path - 1.3.6.1.2.1.25.4.2.1.4, Process Parameters - 1.3.6.1.2.1.25.4.2.1.5, Process Memory - 1.3.6.1.2.1.25.5.1.1.2] | |
| process.cpu.usage | Process CPU Usage | % | Monitors the total CPU utilization of all processes which satisfies the match criteria. [OIDs: Process Name - 1.3.6.1.2.1.25.4.2.1.2, Process Parameters - 1.3.6.1.2.1.25.4.2.1.5, Process CPU - 1.3.6.1.2.1.25.5.1.1.1] |
QCT Rack Server BMC - Hardware
Description
Template to monitor QCT (Quanta Cloud Technology) Rack Server Baseboard Management Controller (BMC) hardware components like Agent Chassis Status, System Hardware Status - Overall, Fan Status and Fan speed, Temperature Status and Temperature Reading, Voltage Status and Voltage Reading, HDD Status, PowerWatt Status and PowerWatt reading. [QCT-RACK-MIB]
Prerequisites
Device should support QCT-RACK-MIB OIDs and SNMP credentials should be enabled against to the device in portal.
Supported Metric
| Monitor Name | Metric Name | Metric Display Name | Unit | Description |
|---|---|---|---|---|
| QCT Rack Server BMC - Agent Chassis Status | qct.rack.bmc.chassis.status | Chassis Status | Monitors the QCT (Quanta Cloud Technology) rack server baseboard management controller (BMC) agent chassis status. [QCT-RACK-MIB::agentChassisStatus - 1.3.6.1.4.1.7244.1.2.1.1.4.0] | |
| QCT Rack Server BMC - Fan Status and Reading | qct.rack.bmc.fan.status | Fan Status | Monitors the QCT (Quanta Cloud Technology) rack server baseboard management controller (BMC) fan status. Possible status values are 1: other, 2: unknown, 3: ok, 4: nonCriticalUpper, 5: criticalUpper, 6: nonRecoverableUpper, 7: nonCriticalLower, 8: criticalLower, 9: nonRecoverableLower, 10: failed. [QCT-RACK-MIB::fanDeviceInfoLocationName - 1.3.6.1.4.1.7244.1.2.1.3.3.1.3; fanDeviceInfoStatus - 1.3.6.1.4.1.7244.1.2.1.3.3.1.2; fanDeviceReading - 1.3.6.1.4.1.7244.1.2.1.3.3.1.4] | |
| qct.rack.bmc.fan.speed | Fan Speed | rpm | Monitors the QCT (Quanta Cloud Technology) rack server baseboard management controller (BMC) fan rotation speed. If this value cannot be determined by software, then a value of -99 will be returned. [QCT-RACK-MIB::fanDeviceInfoLocationName - 1.3.6.1.4.1.7244.1.2.1.3.3.1.3; fanDeviceInfoStatus - 1.3.6.1.4.1.7244.1.2.1.3.3.1.2; fanDeviceReading - 1.3.6.1.4.1.7244.1.2.1.3.3.1.4] | |
| QCT Rack Server BMC - HDD | qct.rack.bmc.hdd.status | HDD Status | Monitors the QCT (Quanta Cloud Technology) rack server baseboard management controller (BMC) HDD status. Possible status values are 1: other, 2: unknown, 3: ok, 4: nonCriticalUpper, 5: criticalUpper, 6: nonRecoverableUpper, 7: nonCriticalLower, 8: criticalLower, 9: nonRecoverableLower, 10: failed. [QCT-RACK-MIB::hddDriveInfoLocationName - 1.3.6.1.4.1.7244.1.2.1.3.8.1.3; hddDriveInfoStatus - 1.3.6.1.4.1.7244.1.2.1.3.8.1.2] | |
| QCT Rack Server BMC - PowerWatt | qct.rack.bmc.powerwatt.status | PowerWatt Status | Monitors the QCT (Quanta Cloud Technology) rack server baseboard management controller (BMC) powerWatt status. Possible status values are 1: other, 2: unknown, 3: ok, 4: nonCriticalUpper, 5: criticalUpper, 6: nonRecoverableUpper, 7: nonCriticalLower, 8: criticalLower, 9: nonRecoverableLower, 10: failed. [QCT-RACK-MIB::powerWattDeviceInfoLocationName - 1.3.6.1.4.1.7244.1.2.1.3.9.1.3; powerWattDeviceInfoStatus - 1.3.6.1.4.1.7244.1.2.1.3.9.1.2; powerWattDeviceReading - 1.3.6.1.4.1.7244.1.2.1.3.9.1.4] | |
| qct.rack.bmc.powerwatt.reading | PowerWatt Reading | Monitors the QCT (Quanta Cloud Technology) rack server baseboard management controller (BMC) powerWatt reading. [QCT-RACK-MIB::powerWattDeviceInfoLocationName - 1.3.6.1.4.1.7244.1.2.1.3.9.1.3; powerWattDeviceInfoStatus - 1.3.6.1.4.1.7244.1.2.1.3.9.1.2; powerWattDeviceReading - 1.3.6.1.4.1.7244.1.2.1.3.9.1.4] | ||
| QCT Rack Server BMC - System Hardware Status - Overall | qct.rack.bmc.system.voltage.status.overall | Voltage Status Overall | Monitors the QCT (Quanta Cloud Technology) rack server baseboard management controller (BMC) system overall Voltage Status. [QCT-RACK-MIB::voltageStatusOverall - 1.3.6.1.4.1.7244.1.2.1.2.1.0; voltageStatusList - 1.3.6.1.4.1.7244.1.2.1.2.2.0] | |
| qct.rack.bmc.system.fan.status.overall | Fan Status Overall | Monitors the QCT (Quanta Cloud Technology) rack server baseboard management controller (BMC) system overall Fan Status. [QCT-RACK-MIB::fanStatusOverall - 1.3.6.1.4.1.7244.1.2.1.2.3.0; fanStatusList - 1.3.6.1.4.1.7244.1.2.1.2.4.0] | ||
| qct.rack.bmc.system.temperature.status.overall | Temperature Status Overall | Monitors the QCT (Quanta Cloud Technology) rack server baseboard management controller (BMC) system overall Temperature Status. [QCT-RACK-MIB::temperatureStatusOverall - 1.3.6.1.4.1.7244.1.2.1.2.5.0; temperatureStatusList - 1.3.6.1.4.1.7244.1.2.1.2.6.0] | ||
| qct.rack.bmc.system.powersupply.redundancy.status | Power Supply Redundancy Status | Monitors the QCT (Quanta Cloud Technology) rack server baseboard management controller (BMC) system overall Power Supply Redundancy Status. [QCT-RACK-MIB:: powerSupplyRedundancy - 1.3.6.1.4.1.7244.1.2.1.2.7.0] | ||
| qct.rack.bmc.system.powersupply0.status | Power SUPPLY 0 Status | Monitors the QCT (Quanta Cloud Technology) rack server baseboard management controller (BMC) system Power SUPPLY 0 Status. [QCT-RACK-MIB:: powerSupply0Status - 1.3.6.1.4.1.7244.1.2.1.2.8.0] | ||
| qct.rack.bmc.system.powersupply1.status | Power SUPPLY 1 Status | Monitors the QCT (Quanta Cloud Technology) rack server baseboard management controller (BMC) system Power SUPPLY 1 Status. [QCT-RACK-MIB::powerSupply1Status - 1.3.6.1.4.1.7244.1.2.1.2.9.0] | ||
| qct.rack.bmc.system.powerwatt.status.overall | Power Watt Status Overall | Monitors the QCT (Quanta Cloud Technology) rack server baseboard management controller (BMC) system power Watt Status Overall. [QCT-RACK-MIB::powerWattStatusOverall - 1.3.6.1.4.1.7244.1.2.1.2.10.0; powerWattStatusList - 1.3.6.1.4.1.7244.1.2.1.2.11.0] | ||
| QCT Rack Server BMC - Temperature Status and Reading | qct.rack.bmc.temperature.status | Temperature Status | Monitors the QCT (Quanta Cloud Technology) rack server baseboard management controller (BMC) temperature status. Possible status values are 1: other, 2: unknown, 3: ok, 4: nonCriticalUpper, 5: criticalUpper, 6: nonRecoverableUpper, 7: nonCriticalLower, 8: criticalLower, 9: nonRecoverableLower, 10: failed. [QCT-RACK-MIB::temperatureDeviceInfoLocationName - 1.3.6.1.4.1.7244.1.2.1.3.4.1.3; temperatureDeviceInfoStatus - 1.3.6.1.4.1.7244.1.2.1.3.4.1.2; temperatureDeviceReading - 1.3.6.1.4.1.7244.1.2.1.3.4.1.4] | |
| qct.rack.bmc.temperature.reading | Temperature Reading (in Centigrade) | C | Monitors the QCT (Quanta Cloud Technology) rack server baseboard management controller (BMC) temperature reading in Centigrade. [QCT-RACK-MIB::temperatureDeviceInfoLocationName - 1.3.6.1.4.1.7244.1.2.1.3.4.1.3; temperatureDeviceInfoStatus - 1.3.6.1.4.1.7244.1.2.1.3.4.1.2; temperatureDeviceReading - 1.3.6.1.4.1.7244.1.2.1.3.4.1.4] | |
| QCT Rack Server BMC - Voltage Status and Reading | qct.rack.bmc.voltage.status | Voltage Status | Monitors the QCT (Quanta Cloud Technology) rack server baseboard management controller (BMC) voltage status. Possible status values are 1: other, 2: unknown, 3: ok, 4: nonCriticalUpper, 5: criticalUpper, 6: nonRecoverableUpper, 7: nonCriticalLower, 8: criticalLower, 9: nonRecoverableLower, 10: failed. [QCT-RACK-MIB::voltageDeviceInfoLocationName - 1.3.6.1.4.1.7244.1.2.1.3.5.1.3; voltageDeviceInfoStatus - 1.3.6.1.4.1.7244.1.2.1.3.5.1.2; voltageDeviceReading - 1.3.6.1.4.1.7244.1.2.1.3.5.1.4] | |
| qct.rack.bmc.voltage.reading | Voltage Reading (in Volts) | v | Monitors the QCT (Quanta Cloud Technology) rack server baseboard management controller (BMC) voltage reading in volts. [QCT-RACK-MIB::voltageDeviceInfoLocationName - 1.3.6.1.4.1.7244.1.2.1.3.5.1.3; voltageDeviceInfoStatus - 1.3.6.1.4.1.7244.1.2.1.3.5.1.2; voltageDeviceReading - 1.3.6.1.4.1.7244.1.2.1.3.5.1.4] |
QLogic - FC Qx Port Operational Status
Description
Template to monitor QLogic FC Qx Port Operational Status. sysObjectID : 1.3.6.1.4.1.3873.1.14
Prerequisites
No prerequisite
Supported Metric
| Monitor Name | Metric Name | Metric Display Name | Unit | Description |
|---|---|---|---|---|
| QLogic - FC Qx Port Operational Status | qlogic.fc.qx.port.operational.status | FC Qx Port Operational Status | It monitors the current operational status of the QxPort.Possible values are online(1), offline(2), testing(3), linkFailure(4).Component or instance is represented as Module of the FC Qx Port and Index of the FC Qx Port with dotted notation.[QLOGIC-MIB::fcQxPortPhysOperStatus:1.3.6.1.4.1.1663.1.3.10.1.1.4]. |
Quantum Storage - Library & Drive Status
Description
Monitors the quantum storage logical library status , physical drive SCSI state , drive health status , physical library’s overall online status..[ADIC-TAPE-LIBRARY-MIB :: logicalLibraryName : 1.3.6.1.4.1.3764.1.10.10.13.2.1.2 , logicalLibraryState : 1.3.6.1.4.1.3764.1.10.10.13.2.1.8 , phDriveState : 1.3.6.1.4.1.3764.1.10.10.11.3.1.10 , phDriveRasStatus : 1.3.6.1.4.1.3764.1.10.10.11.3.1.11 , physicalLibraryState : 1.3.6.1.4.1.3764.1.10.10.14.1.0].
Prerequisites
Device must support for ADIC-TAPE-LIBRARY-MIB
Supported Metric
| Monitor Name | Metric Name | Metric Display Name | Unit | Description |
|---|---|---|---|---|
| Quantum Storage - Logical Library Status | quantum_storage_LogicalLibraryState | Quantum Storage Logical Library State | Monitors the quantum storage logical library status.[ADIC-TAPE-LIBRARY-MIB :: logicalLibraryState : 1.3.6.1.4.1.3764.1.10.10.13.2.1.8].Possible values are online(1) , onlinePending(2) , offline(3), offlinePending(4), shutdownPending(5). | |
| Quantum Storage - Physical Drive Status | quantum_storage_PhDriveState | Quantum Storage Physical Drive State | Monitors the quantum storage physical drive SCSI State.[ADIC-TAPE-LIBRARY-MIB :: phDriveState : 1.3.6.1.4.1.3764.1.10.10.11.3.1.10].Possible values are online(1) , onlinePending(2) , offline(3), offlinePending(4), shutdownPending(5) | |
| quantum_storage_PhDriveRasStatus | Quantum Storage Physical Drive Health Status | Monitors the quantum storage physical drive health status.[ADIC-TAPE-LIBRARY-MIB :: phDriveRasStatus : 1.3.6.1.4.1.3764.1.10.10.11.3.1.11].Possibe values are good(1) , failed(2), degraded(3), warning(4) , informational(5) , unknown(6) , invalid(7). | ||
| Quantum Storage - Physical Library Status | quantum_storage_PhysicalLibraryState | Quantum Storage Physical Library State | Monitors the quantum storage physical library's overall online status.[ADIC-TAPE-LIBRARY-MIB :: physicalLibraryState : 1.3.6.1.4.1.3764.1.10.10.14.1.0].Possible values are online(1) , onlinePending(2) , offline(3), offlinePending(4), shutdownPending(5). |
Quantum Storage - Ras Subsystem Status
Description
Monitors the quantum storage Ras subsystem status like power status,cooling status,control status,connectivity status,robotics status,media status,drive status,libraryGlobalStatus,fibre channel port Ras status.[ADIC-TAPE-LIBRARY-MIB :: powerStatus : 1.3.6.1.4.1.3764.1.10.10.12.1 , coolingStatus : 1.3.6.1.4.1.3764.1.10.10.12.2 , controlStatus : 1.3.6.1.4.1.3764.1.10.10.12.3 , connectivityStatus : 1.3.6.1.4.1.3764.1.10.10.12.4 , roboticsStatus : 1.3.6.1.4.1.3764.1.10.10.12.5 , mediaStatus : 1.3.6.1.4.1.3764.1.10.10.12.6 , driveStatus : 1.3.6.1.4.1.3764.1.10.10.12.7 , libraryGlobalStatus : 1.3.6.1.4.1.3764.1.10.10.1.8.0 , fcPortRasStatus : 1.3.6.1.4.1.3764.1.10.10.15.1.1.9 ]
Prerequisites
Device must support ADIC-TAPE-LIBRARY-MIB
Supported Metric
| Monitor Name | Metric Name | Metric Display Name | Unit | Description |
|---|---|---|---|---|
| Quantum Storage - Fibre Channel Port Ras Status | quantum_storage_FcPortRasStatus | Quantum Storage Fibre Channel Port Ras Status | Monitors the quantum storage fibre channel port Ras status.[ADIC-TAPE-LIBRARY-MIB :: fcPortRasStatus : 1.3.6.1.4.1.3764.1.10.10.15.1.1.9].Possible values are good(1) , failed(2), degraded(3), warning(4) , informational(5) , unknown(6) , invalid(7). | |
| Quantum Storage - Ras Subsystem Status | quantum_storage_ras_PowerStatus | Quantum Storage Ras Power Supply Status | Monitors the overall quantum storage Ras power supply Status.[ADIC-TAPE-LIBRARY-MIB :: powerStatus : 1.3.6.1.4.1.3764.1.10.10.12.1.0].Possible values are good(1) , failed(2), degraded(3), warning(4) , informational(5) , unknown(6) , invalid(7). | |
| quantum_storage_ras_CoolingStatus | Quantum Storage Ras cooling fans Status | Monitors the overall quantum storage Ras cooling fans Status.[ADIC-TAPE-LIBRARY-MIB :: coolingStatus : 1.3.6.1.4.1.3764.1.10.10.12.2.0].Posssible values are good(1) , failed(2), degraded(3), warning(4) , informational(5) , unknown(6) , invalid(7). | ||
| quantum_storage_ras_ControlStatus | Quantum Storage Ras control subsystem status | Monitors the overall quantum storage Ras control subsystem status.[ADIC-TAPE-LIBRARY-MIB :: controlStatus : 1.3.6.1.4.1.3764.1.10.10.12.3.0].Possible values are good(1) , failed(2), degraded(3), warning(4) , informational(5) , unknown(6) , invalid(7). | ||
| quantum_storage_ras_ConnectivityStatus | Quantum Storage Ras Connectivity Status | Monitors the overall quantum storage Ras connectivity Status.[ADIC-TAPE-LIBRARY-MIB :: connectivityStatus : 1.3.6.1.4.1.3764.1.10.10.12.4.0].Possible values are good(1) , failed(2), degraded(3), warning(4) , informational(5) , unknown(6) , invalid(7). | ||
| quantum_storage_ras_RoboticsStatus | Quantum Storage Ras robotics Status | Monitors the overall quantum storage Ras robotics Status.[ADIC-TAPE-LIBRARY-MIB :: roboticsStatus : 1.3.6.1.4.1.3764.1.10.10.12.5.0].Possible values are good(1) , failed(2), degraded(3), warning(4) , informational(5) , unknown(6) , invalid(7). | ||
| quantum_storage_ras_MediaStatus | Quantum Storage Ras Media Status | Monitors the overall quantum storage Ras media Status.[ADIC-TAPE-LIBRARY-MIB :: mediaStatus : 1.3.6.1.4.1.3764.1.10.10.12.6.0] | ||
| quantum_storage_ras_DriveStatus | Quantum Storage Ras drive Status | Monitors the overall quantum storage Ras drive Status.[ADIC-TAPE-LIBRARY-MIB :: driveStatus : 1.3.6.1.4.1.3764.1.10.10.12.7.0].Possible values are good(1) , failed(2), degraded(3), warning(4) , informational(5) , unknown(6) , invalid(7). | ||
| quantum_storage_LibraryGlobalStatus | Quantum Storage Library Global Status | Monitors the Current status of the entire library system (including all attached drive).[ADIC-TAPE-LIBRARY-MIB :: libraryGlobalStatus : 1.3.6.1.4.1.3764.1.10.10.1.8.0].Possible values are good(1) , failed(2), degraded(3), warning(4) , informational(5) , unknown(6) , invalid(7) |
RabbitMQ - Nodes Performance and Health
Description
Template to monitor the RabbitMQ Nodes attributes like Nodes Disk Free Alarm, Nodes Disk Free Limit, Nodes FD Used, Nodes Memory Alarm, Nodes Memory Used, Nodes Running, Nodes Run Queue, Nodes Sockets Used. Validated on RabbitMQ v3.7.8
Prerequisites
No prerequisite
Supported Metric
| Monitor Name | Metric Name | Metric Display Name | Unit | Description |
|---|---|---|---|---|
| RabbitMQ - Nodes Performance and Health | rabbitmq.nodes.disk_free_alarm | RabbitMQ Nodes Disk Free Alarm | NULL | Does the node have disk alarm |
| rabbitmq.nodes.disk_free_limit | RabbitMQ Nodes Disk Free Limit | NULL | Free limit disk space | |
| rabbitmq.nodes.sockets_used | RabbitMQ Nodes Sockets Used | NULL | Number of file descriptors used as sockets | |
| rabbitmq.nodes.running | RabbitMQ Nodes Running | NULL | Is the node running or not | |
| rabbitmq.nodes.mem_alarm | Rabbitmq Nodes Memory Alarm | NULL | Does the host has memory alarm | |
| rabbitmq.nodes.mem_used | RabbitMQ Nodes Memory Used | NULL | Memory used in bytes | |
| rabbitmq.nodes.fd_used | RabbitMQ Nodes FD Used | NULL | Used file descriptors | |
| rabbitmq.nodes.run_queue | RabbitMQ Nodes Run Queue | NULL | Average number of Erlang processes waiting to run |
RabbitMQ - Overall Statistics
Description
Template to monitor the RabbitMQ Overall Statistics attributes like Overview Object Totals Connections, Overview Object Totals Consumers, Overview Object Totals Queues, Overview QueueTotals Messages Count, Overview QueueTotals Messages Details Rate, Overview QueueTotals Messages Ready count, Overview QueueTotals Messages Ready Details Rate, Overview QueueTotals Messages Unacknowledged Count, Overview QueueTotals Messages Unacknowledged Details Rate.
Prerequisites
Validated on RabbitMQ v3.7.8
Supported Metric
| Monitor Name | Metric Name | Metric Display Name | Unit | Description |
|---|---|---|---|---|
| RabbitMQ - Overall Statistics | rabbitmq.overview.queue_totals.messages_unacknowledged.count | RabbitMQ Overview QueueTotals Messages Unacknowledged Count | NULL | Number of unacknowledged messages |
| rabbitmq.overview.object_totals.queues | RabbitMQ Overview Object Totals Queues | NULL | Total number of queues | |
| rabbitmq.overview.queue_totals.messages_ready_details.rate | RabbitMQ Overview QueueTotals Messages Ready Details Rate | NULL | Rate of number of messages ready for delivery | |
| rabbitmq.overview.object_totals.channels | RabbitMQ Overview ObjectTotals Channels | NULL | Total number of channels | |
| rabbitmq.overview.object_totals.connections | RabbitMQ Overview Object Totals Connections | NULL | Total number of object Connections | |
| rabbitmq.overview.object_totals.consumers | RabbitMQ Overview Object Totals Consumers | NULL | Total number of consumers | |
| rabbitmq.overview.queue_totals.messages_details.rate | RabbitMQ Overview QueueTotals Messages Details Rate | NULL | Rate of number of messages (ready plus unacknowledged) | |
| rabbitmq.overview.queue_totals.messages.count | RabbitMQ Overview QueueTotals Messages Count | NULL | Total number of messages (ready plus unacknowledged) | |
| rabbitmq.overview.queue_totals.messages_ready.count | RabbitMQ Overview QueueTotals Messages Ready count | NULL | Number of messages ready for delivery | |
| rabbitmq.overview.queue_totals.messages_unacknowledged_details.rate | RabbitMQ Overview QueueTotals Messages Unacknowledged Details Rate | NULL | Rate of number of unacknowledged messages |
RabbitMQ - Overall Statistics - v2
Description
Template to monitor the RabbitMQ Overall Statistics attributes like Overview Object Totals Connections, Overview Object Totals Consumers, Overview Object Totals Queues, Overview QueueTotals Messages Count, Overview QueueTotals Messages Details Rate, Overview QueueTotals Messages Ready count, Overview QueueTotals Messages Ready Details Rate, Overview QueueTotals Messages Unacknowledged Count, Overview QueueTotals Messages Unacknowledged Details Rate, Overview Object Totals Channels, Overview MessageStats Publish, Overview MessageStats Publish Details Rate, Overview MessageStats DeliverGet, Overview MessageStats DeliverGet Details Rate.
Prerequisites
Validated on RabbitMQ v3.6.10 and and this requires gateway 14.1.0 or later.
Supported Metric
| Monitor Name | Metric Name | Metric Display Name | Unit | Description |
|---|---|---|---|---|
| RabbitMQ - Overall Statistics - v2 | rabbitmq.overview.queue_totals.messages_unacknowledged.count | RabbitMQ Overview QueueTotals Messages Unacknowledged Count | NULL | Number of unacknowledged messages |
| rabbitmq.overview.object_totals.queues | RabbitMQ Overview Object Totals Queues | NULL | Total number of queues | |
| rabbitmq.overview.queue_totals.messages_ready_details.rate | RabbitMQ Overview QueueTotals Messages Ready Details Rate | NULL | Rate of number of messages ready for delivery | |
| rabbitmq.overview.object_totals.channels | RabbitMQ Overview ObjectTotals Channels | NULL | Total number of channels | |
| rabbitmq.overview.object_totals.connections | RabbitMQ Overview Object Totals Connections | NULL | Total number of object Connections | |
| rabbitmq.overview.object_totals.consumers | RabbitMQ Overview Object Totals Consumers | NULL | Total number of consumers | |
| rabbitmq.overview.queue_totals.messages_details.rate | RabbitMQ Overview QueueTotals Messages Details Rate | NULL | Rate of number of messages (ready plus unacknowledged) | |
| rabbitmq.overview.queue_totals.messages.count | RabbitMQ Overview QueueTotals Messages Count | NULL | Total number of messages (ready plus unacknowledged) | |
| rabbitmq.overview.queue_totals.messages_ready.count | RabbitMQ Overview QueueTotals Messages Ready count | NULL | Number of messages ready for delivery | |
| rabbitmq.overview.queue_totals.messages_unacknowledged_details.rate | RabbitMQ Overview QueueTotals Messages Unacknowledged Details Rate | NULL | Rate of number of unacknowledged messages | |
| rabbitmq.overview.message_stats.publish_details.rate | RabbitMQ Overview MessageStats Publish Details Rate | psec | Rate of messages published per second | |
| rabbitmq.overview.message_stats.publish.count | RabbitMQ Overview MessageStats Publish Count | count | Count of messages published | |
| rabbitmq.overview.message_stats.deliver_get_details.rate | RabbitMQ Overview MessageStats DeliverGet Details Rate | psec | Rate per second of the sum of messages delivered in acknowledgement mode to consumers, in no-acknowledgement mode to consumers, in acknowledgement mode in response to basic.get, and in no-acknowledgement mode in response to basic.get | |
| rabbitmq.overview.message_stats.deliver_get.count | RabbitMQ Overview MessageStats DeliverGet Count | count | Sum of messages delivered in acknowledgement mode to consumers, in no-acknowledgement mode to consumers, in acknowledgement mode in response to basic.get, and in no-acknowledgement mode in response to basic.get |
RabbitMQ - Queues Statistics
Description
Template to monitor the RabbitMQ Queue Statistics attributes like Queues Consumers, Queues Consumer Utilisation, Queues Memory, Queues Messages, Queues Messages Ready, Queues Messages Ready Details Rate, Queues Messages Unacknowledged, Queues Messages Unacknowledged Details Rate.
Prerequisites
Validated on RabbitMQ v3.7.8
Supported Metric
| Monitor Name | Metric Name | Metric Display Name | Unit | Description |
|---|---|---|---|---|
| RabbitMQ - Queues Statistics | rabbitmq.queues.messages_unacknowledged | RabbitMQ Queues Messages Unacknowledged | NULL | Number of messages delivered to clients but not yet acknowledged |
| rabbitmq.queues.messages | RabbitMQ Queues Messages | NULL | Count of the total messages in the queue | |
| rabbitmq.queues.messages_ready | RabbitMQ Queues Messages Ready | NULL | Number of messages ready to be delivered to clients | |
| rabbitmq.queues.messages_ready_details.rate | RabbitMQ Queues Messages Ready Details Rate | NULL | Number per second of messages ready to be delivered to clients | |
| rabbitmq.queues.memory | RabbitMQ Queues Memory | NULL | Bytes of memory consumed by the Erlang process associated with the queue, including stack, heap and internal structures | |
| rabbitmq.queues.consumers | RabbitMQ Queues Consumers | NULL | Number of active consumers, consumers that can immediately receive any messages sent to the queue | |
| rabbitmq.queues.messages_unacknowledged_details.rate | RabbitMQ Queues Messages Unacknowledged Details Rate | NULL | Number per second of messages delivered to clients but not yet acknowledged | |
| rabbitmq.queues.consumer_utilisation | RabbitMQ Queues Consumer Utilisation | NULL | The ratio of time that a queue's consumers can take new messages |
RabbitMQ Aliveness Check Status
Description
This template monitors the RabbitMQ aliveness-check status of vhosts.
Prerequisites
Validated on RabbitMQ v3.6.10 and and this requires gateway 14.1.0 or later.
Supported Metric
| Monitor Name | Metric Name | Metric Display Name | Unit | Description |
|---|---|---|---|---|
| RabbitMQ Aliveness Check Status | rabbitmq.aliveness_check.status | RabbitMQ Aliveness Check Status | NULL | status of a vhost |
RADIUS Authentication Status Check
Note
This template will be deprecated soon.Description
It monitors Radius attributes like Radius Authentication Status. Checks the authentication for access Success or Failure to the end device. Alerts when the status is FAILURE.
Prerequisites
No prerequisite
Supported Metric
| Monitor Name | Metric Name | Metric Display Name | Unit | Description |
|---|---|---|---|---|
| RADIUS Authentication Status Check | radius.auth.status | RADIUS Authentication Status | NULL | Monitor tries to connect to end server via RADIUS check. If successful , the server/end device is reachable. |
Radware Alteon Hardware
Description
Monitors the Radware Alteon hardware statistics like temperature, fan and power supply. [ALTEON-CHEETAH-SWITCH-MIB :: hwTemperatureStatus : 1.3.6.1.4.1.1872.2.5.1.3.1.3.0 , hwFanStatus : 1.3.6.1.4.1.1872.2.5.1.3.1.4.0 , hwPowerSupplyStatus : 1.3.6.1.4.1.1872.2.5.1.3.1.29.2.0]
Prerequisites
No prerequisite
Supported Metric
| Monitor Name | Metric Name | Metric Display Name | Unit | Description |
|---|---|---|---|---|
| Radware Alteon - Hardware | radware_alteon_HwTemperatureStatus | Radware Alteon Hardware Temperature Status | Monitors the Radware Alteon Hardware Temperature Status. [ALTEON-CHEETAH-SWITCH-MIB :: hwTemperatureStatus : 1.3.6.1.4.1.1872.2.5.1.3.1.3.0 ] Possible values are : 1 : ok , 2 : exceed . | |
| radware_alteon_HwFanStatus | Radware Alteon Hardware Fan Status | Monitors the Radware Alteon Hardware Fan Status. [ALTEON-CHEETAH-SWITCH-MIB :: hwFanStatus : 1.3.6.1.4.1.1872.2.5.1.3.1.4.0 ] Possible values are : 1 : ok , 2 : fail. | ||
| radware_alteon_HwPowerSupplyStatus | Radware Alteon Hardware PowerSupply Status | Monitors the Radware Alteon Hardware PowerSupply Status. [ALTEON-CHEETAH-SWITCH-MIB :: hwPowerSupplyStatus : 1.3.6.1.4.1.1872.2.5.1.3.1.29.2.0 ] Possible values are : 1 : singlePowerSupplyOk , 2 : firstPowerSupplyFailed , 3 : secondPowerSupplyFailed , 4 : doublePowerSupplyOk , 5 : unknownPowerSupplyFailed. |
Radware Alteon System Performance - MP & SP
Description
Monitors the Radware Alteon Management Processor(MP) and Switch Processor(SP) System Performance statistics like cpu and memory. [ALTEON-CHEETAH-SWITCH-MIB :: mpCpuStatsUtil64Seconds : 1.3.6.1.4.1.1872.2.5.1.2.2.3.0 , mpMemStatsTotal : 1.3.6.1.4.1.1872.2.5.1.2.8.1.0 , mpMemStatsFree : 1.3.6.1.4.1.1872.2.5.1.2.8.3.0 , spStatsCpuUtil64Seconds : 1.3.6.1.4.1.1872.2.5.1.2.4.1.1.4 , spMemUsageStatsCurrentMemory : 1.3.6.1.4.1.1872.2.5.1.2.4.4.1.2 , spMemUsageStatsHiWaterMark : 1.3.6.1.4.1.1872.2.5.1.2.4.4.1.3 ]
Prerequisites
No prerequisite
Supported Metric
| Monitor Name | Metric Name | Metric Display Name | Unit | Description |
|---|---|---|---|---|
| Radware Alteon Management Processor(MP) - System Performance | radware_alteon_MpMemoryUtilization | Radware Alteon Mp Memory Utilization | % | Monitors the Radware Alteon Mp Memory Utilization.[ALTEON-CHEETAH-SWITCH-MIB :: mpMemStatsTotal : 1.3.6.1.4.1.1872.2.5.1.2.8.1.0 , mpMemStatsFree : 1.3.6.1.4.1.1872.2.5.1.2.8.3.0 ] |
| radware_alteon_MpCpuStatsUtil64Seconds | Radware Alteon Mp Cpu Statistics Utilization | % | Monitors the utilization of MP CPU over 64 seconds in percentage. [ALTEON-CHEETAH-SWITCH-MIB :: mpCpuStatsUtil64Seconds : 1.3.6.1.4.1.1872.2.5.1.2.2.3.0 ] | |
| Radware Alteon Switch Processor(SP) - CPU Utilization | radware_alteon_SpStatsCpuUtil64Seconds | Radware Alteon Sp Statistics Cpu Utilization | % | Monitors the utilization of this SP over 64 seconds in percentage. [ALTEON-CHEETAH-SWITCH-MIB :: spStatsCpuUtil64Seconds : 1.3.6.1.4.1.1872.2.5.1.2.4.1.1.4 ] |
| Radware Alteon Switch Processor(SP) - Memory Utilization | radware_alteon_SpMemUsageStatsHiWaterMark | Radware Alteon Sp Memory High WaterMark | KB | Monitors the high watermark of memory usage in KiloBytes. [ALTEON-CHEETAH-SWITCH-MIB :: spMemUsageStatsHiWaterMark : 1.3.6.1.4.1.1872.2.5.1.2.4.4.1.3 ] |
| radware_alteon_SpMemUsageStatsCurrentMemory | Radware Alteon Sp Memory Used | KB | Monitors the current memory usage of SP in KiloBytes. [ALTEON-CHEETAH-SWITCH-MIB :: spMemUsageStatsCurrentMemory : 1.3.6.1.4.1.1872.2.5.1.2.4.4.1.2 ] | |
| radware_alteon_SpMemoryUtilization | Radware Alteon Sp Memory Utilization | % | Monitors the Radware Alteon Sp Memory Utilization. There is a chance utilization can cross 100%. |
Radware Apsolute - CPU Utilization
Description
Template to monitor the CPU utilization of Radware device models running on APSolute os.This template is applicable on radware switches,routers,load balancers and firewalls.
Prerequisites
No prerequisite
Supported Metric
| Monitor Name | Metric Name | Metric Display Name | Unit | Description |
|---|---|---|---|---|
| Radware Apsolute CPU Utilization | radware_CPU_Utilization | Radware CPU Utilization | % | Monitors the Radware CPU utilization.[RADWARE-MIB::rsWSDRSResourceUtilization:1.3.6.1.4.1.89.35.1.54.0] |
Radware Defense Pro Firewall - Hardware
Description
This template is applicable on Radware defense pro version 8.26.3.0 Firewalls.Monitors the parameters like fan,power supply,temperature,Disk utilization.
Prerequisites
No prerequisite
Supported Metric
| Monitor Name | Metric Name | Metric Display Name | Unit | Description |
|---|---|---|---|---|
| Radware Firewall CPU Temperature | radware_firewall_CPUTemperature | Radware Firewall CPU Temperature | Celsius | Provides the Radware firewall CPU temperature.[RADWARE-MIB::rsHWCPUTemperatureIndex:1.3.6.1.4.1.89.35.1.165.1.1] |
| Radware Firewall Disk Utilization | radware_firewall_DiskUsed | Radware Firewall Disk Used | GB | Provides the Radware firewall disk used.[RADWARE-MIB::rsSysUtilDiskUsed:1.3.6.1.4.1.89.35.1.212.0] |
| radware_firewall_DiskCapacity | Radware Firewall Disk Capacity | GB | Provides the Radware firewall disk capacity.[RADWARE-MIB::rsSysUtilDiskCapacity:1.3.6.1.4.1.89.35.1.211.0] | |
| radware_firewall_DiskUtilization | Radware Firewall Disk Utilization | % | Provides the Radware firewall disk utilization.[RADWARE-MIB::rsSysUtilDiskUtilization:1.3.6.1.4.1.89.35.1.213.0] | |
| Radware Firewall Fan Status | radware_firewall_FansStatus | Radware Firewall Fans Status | Monitors the Radware firewall fan status.Possible values are OK, Fail.[RADWARE-MIB::rsSystemFansStatus:1.3.6.1.4.1.89.35.1.162.1.2] | |
| Radware Firewall Power Supply Status | radware_firewall_DualPsuStatus | Radware Firewall Power Supply Status | Monitors the Radware firewall Power supply status.Possible values are 0=singlePwrSupplyOk,1=firstPwrSupplyFailed,2=secondPwrSupplyFailed,3=doublePwrSupplyOk,4=unknownPwrSupplyFailed.[RADWARE-MIB::rdwrDualPsuStatus:1.3.6.1.4.1.89.35.1.163.0] |
Radware Defense Pro Firewall - Performance
Description
This template is applicable on Radware defense pro version 8.26.3.0 Firewalls.Monitors the parameters like CPU and memory statistics
Prerequisites
No prerequisite
Supported Metric
| Monitor Name | Metric Name | Metric Display Name | Unit | Description |
|---|---|---|---|---|
| Radware Firewall Memory Utilization | radware_firewall_RAMCapacity | Radware Firewall RAM Capacity | GB | Provides the Radware firewall RAM capacity.[RADWARE-MIB::rsSysUtilRAMCapacity:1.3.6.1.4.1.89.35.1.214.0] |
| radware_firewall_RAMUtilization | Radware Firewall RAM Utilization | % | Provides the Radware firewall RAM utilization.[RADWARE-MIB::rsSysUtilRAMUtilization:1.3.6.1.4.1.89.35.1.216.0] | |
| radware_firewall_RAMUsed | Radware Firewall RAM Used | GB | Provides the Radware firewall RAM used.[RADWARE-MIB::rsSysUtilRAMUsed:1.3.6.1.4.1.89.35.1.215.0] | |
| Radware Firewall Resource CPU Utilization | radware_firewall_Resource_Utilization | Radware Firewall Resource CPU Utilization | % | Monitors the Radware firewall resource CPU utilization.[RADWARE-MIB::rsWSDRSResourceUtilization:1.3.6.1.4.1.89.35.1.54.0] |
Raritan PDU2
Description
Template to monitor Raritan PDU2 parameters like Inlet Sensors Values, Inlet Sensors State, Outlet State, Overcurrent Protector Values, Overcurrent Protector State.Enterprise OID : 1.3.6.1.4.1.13742.6. PDU2-MIB
Prerequisites
No prerequisite
Supported Metric
| Monitor Name | Metric Name | Metric Display Name | Unit | Description |
|---|---|---|---|---|
| Raritan PDU2 | raritan_pdu_outlet_state | Raritan PDU Outlet State | It monitors the Raritan PDU Outlet Switching State.[PDU2-MIB :: outletSwitchingState : 1.3.6.1.4.1.13742.6.4.1.2.1.3].Possible values are unavailable(-1) , open(0) , closed(1) , belowLowerCritical(2) , belowLowerWarning(3) , normal(4) , aboveUpperWarning(5) , aboveUpperCritical(6) , on(7) , off(8) , detected(9) , notDetected(10) , alarmed(11) , ok(12) , fail(14) , yes(15) , no(16) , standby(17) , one(18) , two(19) , inSync(20) , outOfSync(21) , i1OpenFault(22) , i1ShortFault(23) , i2OpenFault(24) , i2ShortFault(25) , fault(26) , warning(27) , critical(28) , selfTest(29) , nonRedundant(30). | |
| raritan_pdu_inlet_rmsVoltage_sensorvalue | Raritan PDU Inlet Rms Voltage Sensorvalue | v | It monitors the Raritan pdu2 inlet Rms Voltage Sensor Value.[PDU2-MIB :: measurementsUnitSensorValue : 1.3.6.1.4.1.13742.6.5.2.3.1.4.1.1.4] | |
| raritan_pdu_overcurrent_state | Raritan PDU Over Current State | It monitors the Raritan PDU Over Current State.[PDU2-MIB :: measurementsOverCurrentProtectorSensorState : 1.3.6.1.4.1.13742.6.5.3.3.1.3].Possible values are unavailable(-1) , open(0) , closed(1) , belowLowerCritical(2) , belowLowerWarning(3) , normal(4) , aboveUpperWarning(5) , aboveUpperCritical(6) , on(7) , off(8) , detected(9) , notDetected(10) , alarmed(11) , ok(12) , fail(14) , yes(15) , no(16) , standby(17) , one(18) , two(19) , inSync(20) , outOfSync(21) , i1OpenFault(22) , i1ShortFault(23) , i2OpenFault(24) , i2ShortFault(25) , fault(26) , warning(27) , critical(28) , selfTest(29) , nonRedundant(30). | ||
| raritan_pdu_inlet_activePower_sensorvalue | Raritan PDU Inlet Active Power Sensorvalue | W | It monitors the Raritan Pdu2 Inlet Active Power Sensor Value.[PDU2-MIB :: measurementsUnitSensorValue : 1.3.6.1.4.1.13742.6.5.2.3.1.4.1.1.5] | |
| raritan_pdu_inlet_sensor_state | Raritan PDU Inlet Sensor State | Monitors the Raritan PDU Inlet Sensors State.[PDU2-MIB :: measurementsInletSensorState : 1.3.6.1.4.1.13742.6.5.2.3.1.3.1.1.4].Possible values are unavailable(-1) , open(0) , closed(1) , belowLowerCritical(2) , belowLowerWarning(3) , normal(4) , aboveUpperWarning(5) , aboveUpperCritical(6) , on(7) , off(8) , detected(9) , notDetected(10) , alarmed(11) , ok(12) , fail(14) , yes(15) , no(16) , standby(17) , one(18) , two(19) , inSync(20) , outOfSync(21) , i1OpenFault(22) , i1ShortFault(23) , i2OpenFault(24) , i2ShortFault(25) , fault(26) , warning(27) , critical(28) , selfTest(29) , nonRedundant(30). | ||
| raritan_pdu_inlet_rmsCurrent_sensorvalue | Raritan PDU Inlet Rms Current Sensor Value | amps | It monitors the Raritan pdu Inlet Rms Current Sensor Value.[PDU2-MIB :: measurementsUnitSensorValue : 1.3.6.1.4.1.13742.6.5.2.3.1.4.1.1.1] | |
| raritan_pdu_inlet_frequency_sensorvalue | Raritan PDU Inlet Frequency Sensorvalue | It monitors the Raritan Pdu2 Inlet Frequency Sensor Value.[PDU2-MIB :: measurementsUnitSensorValue : 1.3.6.1.4.1.13742.6.5.2.3.1.4.1.1.23] |
Redis Performance Template
Description
Redis Performance Template
Prerequisites
No prerequisite
Supported Metric
| Monitor Name | Metric Name | Metric Display Name | Unit | Description |
|---|---|---|---|---|
| Redis Performance Monitor | redis.uptime | Redis-Uptime | m | Checks the uptime of the Redis service. |
| redis.clients.blocked | Redis Clients Blocked | count | Number of clients pending on a blocking call. | |
| redis.clients.biggest.inputbuf | Redis Clients Biggest Input Buf | count | Biggest input buffer among current client connections. | |
| redis.clients.longest.outputlist | Redis Clients Longest Output List | count | Longest output list among current client connections. | |
| redis.keys.total | Redis Total Keys | NULL | Provides the total number of keys from all the DBs. | |
| redis.keys.evicted | Redis Keys Evicted | count | Number of evicted keys due to maxmemory limit. | |
| redis.keys.expired | redis.keys.expired | count | Total number of key expiration events. | |
| redis.pubsub.channels | Redis Pubsub Channels | count | Global number of pub/sub channels with client subscriptions. | |
| redis.pubsub.patterns | Redis Pubsub Patterns | count | Global number of pub/sub pattern with client subscriptions. | |
| redis.perf.latest_fork_usec | Redis Latest Fork Usec | microsec | Duration of the latest fork operation in microseconds. | |
| redis.net.clients | Redis Connected Clients | count | Number of client connections (excluding connections from slaves). | |
| redis.net.slaves | Redis Connected Slaves | count | Number of connected slaves. | |
| redis.net.rejected | Redis Connections Rejected | count | Number of connections rejected because of maxclients limit. | |
| redis.changes | Redis Changes | count | Number of changes since the last save. | |
| redis.rdb.changes | Redis RDB Changes | count | Number of changes since the last dump. | |
| redis.rdb.last.bgsavetime | Redis RDB Last Bgsave Time | s | Duration of the last RDB save operation in seconds. | |
| redis.aof.last.rewritetime | Redis AOF Last Rewrite Time | s | Duration of the last AOF rewrite operation in seconds. | |
| redis.aof.size | Redis AOF Size | Bytes | AOF current file size in MB. | |
| redis.mem.used | Redis Mem Used | Bytes | Total number of Mbytes allocated by Redis using its allocator (either standard libc, jemalloc, or an alternative allocator such as tcmalloc). | |
| redis.mem.rss | Redis Mem RSS | Bytes | Number of bytes that Redis allocated as seen by the operating system (a.k.a resident set size). This is the number reported by tools such as top and ps. | |
| redis.mem.lua | Redis Mem LUA | Bytes | Number of Mbytes used by the Lua engine. | |
| Number of Mbytes used by the Lua engine. | Redis Mem Peak | Bytes | Peak memory consumed by Redis (in Mbytes). | |
| redis.mem.fragmentation.ratio | Redis Mem Fragmentation Ratio | % | Ratio between rss memory used and total memory used. | |
| redis.replica.last.io.Secondsago | Redis Replica Last IO Seconds Ago | s | Number of seconds since the last interaction with master. | |
| redis.replica.syncleftbytes | Redis Replica Sync Left Bytes | Bytes | Number of bytes left before SYNCing is complete | |
| redis.replica.linkstatus | Redis Replica Link Status | NULL | Status of the link (0: up, 1: down). | |
| redis.stats.keyspace_hits | Redis Keyspace Hits | count | Number of successful lookup of keys in the main dictionary per second. | |
| redis.keyspace.misses | Redis Keyspace Misses | count | Number of failed lookup of keys in the main dictionary per second. | |
| redis.key.hits_rate | Redis Key Hits Rate | hps | The rate of successful lookup of keys in the main dictionary. | |
| redis.key.misses_rate | Redis Key Miss Rate | mps | The rate of failed lookup of keys in the main dictionary. | |
| redis.connections | Redis Connections | count | The number of connections accepted by the server per second. | |
| redis.net.commands | Redis Commands | count | The number of commands processed by the server |
Resin CacheStore -ClusterServer Template
Description
Resin CacheStore -ClusterServer Template
Prerequisites
No prerequisite
Supported Metric
| Monitor Name | Metric Name | Metric Display Name | Unit | Description |
|---|---|---|---|---|
| Resin CacheStore -ClusterServer Monitor | resin.cachestore.data.count | Resin CacheStore Data Count | NULL | Gives datacount of cachestore |
| resin.cachestore.load.fail.count.total | Resin CacheStore Load Fail Count Total | NULL | Gives loadfailcount of cachestore | |
| resin.cachestore.save.count.total | Resin CacheStore Save Count Total | NULL | Gives savecounttotal of cache store | |
| resin.cachestore.save.fail.count.total | Resin CacheStore Save Fail Count Total | NULL | Gives savefail count total of cachestore | |
| resin.clusterserver.server.cpu.load.average | Resin ClusterServer Server CPU Load Avg | NULL | The load average of the backend server | |
| resin.clusterserver.connection.fail.count.total | Resin ClusterServer Connection Fail Count Total | NULL | The total number of failed connections attempts to the target server | |
| resin.clusterserver.latency.factor | Resin ClusterServer Latency Factor | ms | The latency factor of the backend server |
Resin Memory - Web App Template
Description
Resin Memory - Web App Template
Prerequisites
No prerequisite
Supported Metric
| Monitor Name | Metric Name | Metric Display Name | Unit | Description |
|---|---|---|---|---|
| Resin Memory Monitor | resin.memory.eden.free | Resin Memory Eden Free | MB | Current free Eden memory |
| resin.memory.tenured.free | Resin Memory Tenured Free | MB | Current free Tenured memory | |
| resin.memory.tenured.max | Resin Memory Tenured Max | MB | Max allocated Tenured memory | |
| resin.memory.tenured.used | Resin Memory Tenured Used | MB | Current used Tenured memory | |
| resin.memory.tenured.committed | Resin Memory Tenured Committed | MB | Current allocated Tenured memory | |
| resin.memory.perm.gen.max | Resin Memory Perm Gen Max | MB | Max allocated PermGen memory | |
| resin.memory.survivor.committed | Resin Memory Survivor Committed | MB | Current allocated Survivor memory | |
| resin.memory.garbage.collection.time | Resin Memory Garbage Collection Time | ms | Current total GC time | |
| resin.memory.eden.max | Resin Memory Eden Max | MB | Max allocated Eden memory | |
| resin.memory.perm.gen.committed | Resin Memory Perm Gen Committed | MB | Current allocated PermGen memory | |
| resin.memory.garbage.collection.count | Resin Memory Garbage Collection Count | NULL | Current total GC count | |
| resin.memory.eden.used | Resin Memory Eden Used | MB | Current used Eden memory | |
| resin.memory.survivor.free | memory Utilization | MB | Current free Survivor memory | |
| resin.memory.perm.gen.free | Resin Memory Perm Gen Free | MB | Current free PermGen memory | |
| resin.memory.eden.committed | Resin Memory Eden Committed | MB | Current allocated Eden memory | |
| resin.memory.survivor.max | Resin Memory Survivor Max | MB | Max allocated Survivor memory | |
| resin.memory.survivor.used | Resin Memory Survivor Used | MB | Current used Survivor memory | |
| resin.memory.perm.gen.used | Resin Memory Perm Gen Used | MB | Current used PermGen memory | |
| resin.memory.code.cache.free | Resin Memory Code Cache Free | MB | Current free CodeCache memory | |
| resin.memory.code.cache.max | Resin Memory Code Cache Max | MB | Max allocated CodeCache memory | |
| resin.memory.code.cache.commmitted | Resin Memory Code Cache Commmitted | MB | Current allocated CodeCache memory | |
| resin.memory.code.cache.used | Resin Memory Code Cache Used | MB | Current used CodeCache memory | |
| Resin Webapp Monitor | resin.webapp.request.count | Resin WebApp Request Count | NULL | The current number of requests served by the web-app |
| resin.webapp.request.count.total | Resin WebApp Request Count Total | NULL | The total number of requests served by the web-app since starting | |
| resin.webapp.client.disconnect.count.total | Resin WebApp Client Disconnect Count Total | NULL | The total number of times a client has disconnected before a request completed | |
| resin.webapp.request.read.bytes.total | Resin WebApp Request Read Bytes Total | Bytes | The total number of bytes received in client requests | |
| resin.webapp.redeploy.check.interval | Resin WebApp Redeploy Check Interval | ms | The configured millisecond interval between checks for the need to redeploy | |
| resin.webapp.request.time.total | Resin WebApp Request Time Total | ms | The total real (wall-clock) time in milliseconds taken by requests served by the web-app | |
| resin.webapp.request.write.bytes.total | Resin WebApp Request Write Bytes Total | NULL | The total number of bytes sent to clients | |
| resin.webapp.status500.count.total | Resin WebApp Status500 Count Total | NULL | The total number of 500 status errors |
Resin ThreadPool - Server Template
Description
Resin ThreadPool and Server Template
Prerequisites
No prerequisite
Supported Metric
| Monitor Name | Metric Name | Metric Display Name | Unit | Description |
|---|---|---|---|---|
| Resin Server Monitor | resin.server.memory.free.min | Resin Server Memory Free Min | MB | The minimum free heap memory for GC and restart |
| resin.server.request.count.total | Resin Server Request Count Total | NULL | The total number of requests serviced by the server since it started | |
| resin.server.run.time.memory.free | Resin Server Run Time Memory Free | Bytes | The current free amount of memory available for the JVM, in bytes | |
| resin.server.thread.keep.alive.count | Resin Server Thread Keep Alive Count | NULL | The current number of connections that are in the keepalive state and are using a thread to maintain the connection | |
| resin.server.request.write.bytes.total | Resin Server Request Write Bytes Total | NULL | The total number of bytes that requests serviced by this server have written | |
| resin.server.uptime | Resin Server UP Time | ms | The time in milliseconds since the last start | |
| resin.server.thread.active.count | Resin Server Thread Active Count | NULL | The current number of threads that are servicing requests | |
| resin.server.keep.alive.count.total | Resin Server Keep Alive Count Total | NULL | The total number of requests that have ended up in the keepalive state | |
| resin.server.cpu.load.avg | Resin Server CPU Load Avg | m | The current CPU load average | |
| Resin Thread Pool Monitor | resin.threadpool.thread.wait.count | Resin ThreadPool Thread Wait Count | NULL | The current number of wait threads |
| resin.threadpool.thread.idle.min | Resin ThreadPool Thread Idle Min | NULL | The configured minimum number of idle threads | |
| resin.threadpool.thread.idle.max | Resin ThreadPool Thread Idle Max | NULL | The configured maximum number of idle threads | |
| resin.threadpool.thread.priority.min | Resin ThreadPool Thread Priority Min | NULL | The priority thread gap | |
| resin.threadpool.thread.count | Resin ThreadPool Thread Count | NULL | The current number of managed threads | |
| resin.threadpool.thread.priority.queue.size | Resin ThreadPool Thread Priority Queue Size | NULL | The priority queue size | |
| resin.threadpool.thread.idle.count | Resin ThreadPool Thread Idle Count | NULL | The current number of idle threads | |
| resin.threadpool.thread.max | Resin ThreadPool Thread Max | NULL | The configured maximum number of threads | |
| resin.threadpool.thread.create.count.total | Resin ThreadPool Thread Create Count Total | NULL | The total number of created threads | |
| resin.threadpool.thread.overflow.count.total | Resin ThreadPool Thread Overflow Count Total | NULL | The total number of overflow threads | |
| resin.threadpool.thread.task.queue.size | Resin ThreadPool Thread Task Queue Size | NULL | The task queue size | |
| resin.threadpool.thread.executor.max | Resin ThreadPool Thread Executor Max | NULL | The configured maximum number of executor threads | |
| resin.threadpool.thread.active.count | Resin ThreadPool Thread Active Count | NULL | The current number of active threads | |
| resin.threadpool.thread.starting.count | Resin ThreadPool Thread Starting Count | NULL | The current number of starting threads |
Siemens SCALANCE Switch - Hardware and SFP Statistics
Description
Monitors the Siemens SCALANCE Switch Statistics like Port Block State, Port Link State, PowerSupply1 State, PowerSupply2 State, SFP Stats like Temperature, Voltage, Current, RxPower and TxPower. Validated on Siemens SCALANCE Switch, Model : SCALANCE XR528-6M (6GK5528-0AR00-2AR2), SysObjectID : 1.3.6.1.4.1.4329.6.1.2.1.5. [ SN-MSPS-SCXNG-MIB :: snMspsPortBlockState : 1.3.6.1.4.1.4329.20.1.1.1.1.29.90.1.15, snMspsPortLinkState : 1.3.6.1.4.1.4329.20.1.1.1.1.29.90.1.50 , snMspsPowerSupply1State : 1.3.6.1.4.1.4329.20.1.1.1.1.28.5, snMspsPowerSupply2State : 1.3.6.1.4.1.4329.20.1.1.1.1.28.6, snMspssfpTemperature : 1.3.6.1.4.1.4329.20.1.1.1.1.46.10.1.10, snMspssfpVoltage : 1.3.6.1.4.1.4329.20.1.1.1.1.46.10.1.13, snMspssfpCurrent : 1.3.6.1.4.1.4329.20.1.1.1.1.46.10.1.16, snMspssfpRxPower : 1.3.6.1.4.1.4329.20.1.1.1.1.46.10.1.19, snMspssfpTxPower : 1.3.6.1.4.1.4329.20.1.1.1.1.46.10.1.22 ].
Prerequisites
Device must have support for the SN-MSPS-SCXNG-MIB.
Supported Metric
| Monitor Name | Metric Name | Metric Display Name | Unit | Description |
|---|---|---|---|---|
| Siemens SCALANCE Switch - Power Supply State | siemens_scalance_powersupply1_State | Siemens Scalance Power Supply1 State | Monitors the siemens scalance power supply1 state. [ SN-MSPS-SCXNG-MIB :: snMspsPowerSupply1State : 1.3.6.1.4.1.4329.20.1.1.1.1.28.5.0 ]. possible values are 1 - inactive, 2 - active, 3 - not-present. | |
| siemens_scalance_powersupply2_State | Siemens Scalance Power Supply2 State | Monitors the siemens scalance power supply2 state. [ SN-MSPS-SCXNG-MIB :: snMspsPowerSupply2State : 1.3.6.1.4.1.4329.20.1.1.1.1.28.6.0 ]. possible values are 1 - inactive, 2 - active, 3 - not-present | ||
| Siemens SCALANCE Switch - SFP Stats | siemens_scalance_sfp_Temperature | Siemens Scalance SFP Temperature | Celsius | Monitors the siemens scalance sfp temperature. [ SN-MSPS-SCXNG-MIB :: snMspssfpTemperature : 1.3.6.1.4.1.4329.20.1.1.1.1.46.10.1.10 ]. |
| siemens_scalance_sfp_Voltage | Siemens Scalance SFP Voltage | v | Monitors the siemens scalance sfp voltage. [ SN-MSPS-SCXNG-MIB :: snMspssfpVoltage : 1.3.6.1.4.1.4329.20.1.1.1.1.46.10.1.13 ]. | |
| siemens_scalance_sfp_Current | Siemens Scalance SFP Current | amps | Monitors the siemens scalance sfp current. [ SN-MSPS-SCXNG-MIB :: snMspssfpCurrent : 1.3.6.1.4.1.4329.20.1.1.1.1.46.10.1.16 ]. | |
| siemens_scalance_sfp_rx_power_microWatts | Siemens Scalance SFP Rx Power Micro Watts | Monitors the siemens scalance sfp rx power. [ SN-MSPS-SCXNG-MIB :: snMspssfpRxPower : 1.3.6.1.4.1.4329.20.1.1.1.1.46.10.1.19 ]. | ||
| siemens_scalance_sfp_tx_power_microWatts | Siemens Scalance SFP Tx Power Micro Watts | Monitors the siemens scalance sfp tx power. [ SN-MSPS-SCXNG-MIB :: snMspssfpTxPower : 1.3.6.1.4.1.4329.20.1.1.1.1.46.10.1.22 ]. | ||
| Siemens SCALANCE Switch - Port Stats | siemens_scalance_port_BlockState | Siemens Scalance Port Block State | Monitors the siemens scalance port block state. [ SN-MSPS-SCXNG-MIB :: snMspsPortBlockState : 1.3.6.1.4.1.4329.20.1.1.1.1.29.90.1.15 ] Possible Values are : 0 - not-available, 1 - forwarding, 2 - ring-redundancy, 3 - spanning-tree, 4 - loop-detected, 5 - down-in-bundle, 6 - la-loop-detected, 7 - la-spanning-tree, 8 - link-down, 9 - admin-down, 10 - power-down, 11 - standby, 12 - link-check, 13 - mrp-interconnection. | |
| siemens_scalance_port_LinkState | Siemens Scalance Port Link State | Monitors the siemens scalance port link state. [ SN-MSPS-SCXNG-MIB :: snMspsPortLinkState : 1.3.6.1.4.1.4329.20.1.1.1.1.29.90.1.50 ]. Possible Values are 1 - up, 2 - down |
Siemens SCALANCE Switch - Performance - Ext
Description
Monitors the Siemens SCALANCE Switch - Performance - Ext Statistics like RAM, CPU, and Diagnostics Usage and Status. Validated on Siemens SCALANCE Switch, Model : SCALANCE XR528-6M (6GK5528-0AR00-2AR2), SysObjectID : 1.3.6.1.4.1.4329.6.1.2.1.5. [ SN-MSPS-SCXNG-MIB :: snMspsDiagnosticsUsageStatus : 1.3.6.1.4.1.4329.20.1.1.1.1.79.3.1.10 , snMspsDiagnosticsUsageValue : 1.3.6.1.4.1.4329.20.1.1.1.1.79.3.1.13] .
Prerequisites
Device must have support for the SN-MSPS-SCXNG-MIB.
Supported Metric
| Monitor Name | Metric Name | Metric Display Name | Unit | Description |
|---|---|---|---|---|
| Siemens SCALANCE Switch - Performance - Ext | siemens_scalance_diagnostics_usage_value | Siemens Scalance Diagnostics Usage Value | % | Monitors the siemens scalance diagnostics usage value.[ SN-MSPS-SCXNG-MIB :: snMspsDiagnosticsUsageValue : 1.3.6.1.4.1.4329.20.1.1.1.1.79.3.1.13]. |
| siemens_scalance_diagnostics_usage_status | Siemens Scalance Diagnostics Usage Status | Monitors the siemens scalance diagnostics usage status. [ SN-MSPS-SCXNG-MIB :: snMspsDiagnosticsUsageStatus : 1.3.6.1.4.1.4329.20.1.1.1.1.79.3.1.10 ]. possible values are 1: ok, 2: warning, 3: critical, 4: invalid, 5: initial | ||
| siemens_scalance_diagnostics_cpu_usage_value | Siemens Scalance Diagnostics CPU Usage Value | % | Monitors the siemens scalance diagnostics usage value.[ SN-MSPS-SCXNG-MIB :: snMspsDiagnosticsUsageValue : 1.3.6.1.4.1.4329.20.1.1.1.1.79.3.1.13]. | |
| siemens_scalance_diagnostics_cpu_usage_status | Siemens Scalance Diagnostics CPU Usage Status | Monitors the siemens scalance diagnostics cpu usage status. [ SN-MSPS-SCXNG-MIB :: snMspsDiagnosticsUsageStatus : 1.3.6.1.4.1.4329.20.1.1.1.1.79.3.1.10 ]. possible values are 1: ok, 2: warning, 3: critical, 4: invalid, 5: initial | ||
| siemens_scalance_diagnostics_memory_usage_value | Siemens Scalance Diagnostics Memory Usage Value | % | Monitors the siemens scalance diagnostics memory usage value.[ SN-MSPS-SCXNG-MIB :: snMspsDiagnosticsUsageValue : 1.3.6.1.4.1.4329.20.1.1.1.1.79.3.1.13]. | |
| siemens_scalance_diagnostics_memory_usage_status | Siemens Scalance Diagnostics Memory Usage Status | Monitors the siemens scalance diagnostics memory usage status. [ SN-MSPS-SCXNG-MIB :: snMspsDiagnosticsUsageStatus : 1.3.6.1.4.1.4329.20.1.1.1.1.79.3.1.10 ]. possible values are 1: ok, 2: warning, 3: critical, 4: invalid, 5: initial |
Server Technology Sentry3 PDU
Description
Monitors the Server Technology Sentry3 pdu tower status and tower infeed count, infeed statistics like infeed status, infeed load status, infeed load value, infeed outlet count, infeed capacity, infeed voltage and infeed power, environmental monitor status, sensor status, temperature sensor status and value, humidity sensor status and value. Validated on Server Technology Sentry3 PDU ( SysObjOID : 1.3.6.1.4.1.1718.3 ).[ Sentry3-MIB :: towerStatus : 1.3.6.1.4.1.1718.3.2.1.1.4 , towerInfeedCount : 1.3.6.1.4.1.1718.3.2.1.1.5 , towerCapabilities : 1.3.6.1.4.1.1718.3.2.1.1.8 , infeedStatus : 1.3.6.1.4.1.1718.3.2.2.1.5 , infeedLoadStatus : 1.3.6.1.4.1.1718.3.2.2.1.6 , infeedLoadValue : 1.3.6.1.4.1.1718.3.2.2.1.7 , infeedOutletCount : 1.3.6.1.4.1.1718.3.2.2.1.9 , infeedCapacity : 1.3.6.1.4.1.1718.3.2.2.1.10 , infeedVoltage : 1.3.6.1.4.1.1718.3.2.2.1.11 , infeedPower : 1.3.6.1.4.1.1718.3.2.2.1.12 , envMonStatus : 1.3.6.1.4.1.1718.3.2.4.1.4 , tempHumidSensorStatus : 1.3.6.1.4.1.1718.3.2.5.1.4 , tempHumidSensorTempStatus : 1.3.6.1.4.1.1718.3.2.5.1.5 , tempHumidSensorTempValue : 1.3.6.1.4.1.1718.3.2.5.1.6 , tempHumidSensorHumidStatus : 1.3.6.1.4.1.1718.3.2.5.1.9 , tempHumidSensorHumidValue : 1.3.6.1.4.1.1718.3.2.5.1.10 ].
Prerequisites
Device must have support for Sentry3-MIB.
Supported Metric
| Monitor Name | Metric Name | Metric Display Name | Unit | Description |
|---|---|---|---|---|
| Server Technology Sentry3 - Tower | sentry3_tower_Status | Sentry3 Tower Status | Monitors the operational status of the tower. [Sentry3-MIB :: towerStatus : 1.3.6.1.4.1.1718.3.2.1.1.4] Possible values: 0 - normal, 1 - noComm, 2 - fanFail, 3 - overTemp, 4 - nvmFail, 5 - outOfBalance. | |
| sentry3_tower_infeed_Count | Sentry3 Tower Infeed Count | count | Monitors the number of input feeds on the tower. [Sentry3-MIB :: towerInfeedCount : 1.3.6.1.4.1.1718.3.2.1.1.5] | |
| Server Technology Sentry3 - Infeed | sentry3_infeed_Status | Sentry3 Infeed Status | Monitors the status of the input feed line. [Sentry3-MIB :: infeedStatus : 1.3.6.1.4.1.1718.3.2.2.1.5] Possible values: 0 - off, 1 - on, 2 - offWait, 3 - onWait, 4 - offError, 5 - onError, 6 - noComm, 7 - reading, 8 - offFuse, 9 - onFuse. | |
| sentry3_infeed_load_Status | Sentry3 Infeed Load Status | Monitors the status of the load measured on the input feed line. [Sentry3-MIB :: infeedLoadStatus : 1.3.6.1.4.1.1718.3.2.2.1.6] Possible values: 0 - normal, 1 - notOn, 2 - reading, 3 - loadLow, 4 - loadHigh, 5 - overLoad, 6 - readError, 7 - noComm. | ||
| sentry3_infeed_load_Value | Sentry3 Infeed Load Value | amps | Monitors the load measured on the input feed line. [Sentry3-MIB :: infeedLoadValue : 1.3.6.1.4.1.1718.3.2.2.1.7] | |
| sentry3_infeed_outlet_Count | Sentry3 Infeed Outlet Count | count | Monitors the number of controlled and/or monitored outlets on the input feed. [Sentry3-MIB :: infeedOutletCount : 1.3.6.1.4.1.1718.3.2.2.1.9] | |
| sentry3_infeed_Capacity | Sentry3 Infeed Capacity | amps | Monitors the load capacity of the input feed line. [Sentry3-MIB :: infeedCapacity : 1.3.6.1.4.1.1718.3.2.2.1.10] | |
| sentry3_infeed_Voltage | Sentry3 Infeed Voltage | v | Monitors the line-to-line voltage of the input feed. [Sentry3-MIB :: infeedVoltage : 1.3.6.1.4.1.1718.3.2.2.1.11] | |
| sentry3_infeed_Power | Sentry3 Infeed Power | W | Monitors the active power consumption of the input feed phase. [Sentry3-MIB :: infeedPower : 1.3.6.1.4.1.1718.3.2.2.1.12] | |
| Server Technology Sentry3 - Environmental Monitor Status | sentry3_environmental_monitor_Status | Sentry3 Environmental Monitor Status | Monitors the operational status of the environmental monitor. [Sentry3-MIB :: envMonStatus : 1.3.6.1.4.1.1718.3.2.4.1.4] Possible values: 0 - normal, 1 - noComm. | |
| Server Technology Sentry3 - Temperature and Humidity | sentry3_sensor_Status | Sentry3 Sensor Status | Monitors the operational status of the temperature/humidity sensor. [Sentry3-MIB :: tempHumidSensorStatus : 1.3.6.1.4.1.1718.3.2.5.1.4] Possible values: 0 - found, 1 - notFound, 2 - lost, 3 - noComm. | |
| sentry3_temperature_sensor_Status | Sentry3 Temperature Sensor Status | Monitors the status of the temperature sensor. [Sentry3-MIB :: tempHumidSensorTempStatus : 1.3.6.1.4.1.1718.3.2.5.1.5] Possible values: 0 - normal, 1 - notFound, 2 - reading, 3 - tempLow, 4 - tempHigh, 5 - readError, 6 - lost, 7 - noComm. | ||
| sentry3_temperature_sensor_Value | Sentry3 Temperature Sensor Value | Celsius | Monitors the temperature measured by the sensor. [Sentry3-MIB :: tempHumidSensorTempValue : 1.3.6.1.4.1.1718.3.2.5.1.6] | |
| sentry3_humidity_sensor_Status | Sentry3 Humidity Sensor Status | Monitors the status of the humidity sensor. [Sentry3-MIB :: tempHumidSensorHumidStatus : 1.3.6.1.4.1.1718.3.2.5.1.9] Possible values: 0 - normal, 1 - notFound, 2 - reading, 3 - humidLow, 4 - humidHigh, 5 - readError, 6 - lost, 7 - noComm. | ||
| sentry3_humidity_sensor_value_PercentageRelativeHumidity | Sentry3 Humidity Sensor Value Percentage Relative Humidity | Monitors the humidity measured by the sensor in percentage relative humidity. [Sentry3-MIB :: tempHumidSensorHumidValue : 1.3.6.1.4.1.1718.3.2.5.1.10] |
Server Technology Sentry4 PDU
Description
Monitors the Server Technology Sentry4 pdu unit status, input cord statistics, line current statistics, phase statistics, branch statistics, outlet statistics, temperature sensor value and status, humidity sensor value and status and fan sensor value and status. Validated on Server Technology Sentry4 PDU ( SysObjOID : 1.3.6.1.4.1.1718.4 ).[ Sentry4-MIB :: st4UnitStatus : 1.3.6.1.4.1.1718.4.1.2.3.1.1 , st4InputCordOutletCount : 1.3.6.1.4.1.1718.4.1.3.2.1.24 , st4InputCordState : 1.3.6.1.4.1.1718.4.1.3.3.1.1 , st4InputCordStatus : 1.3.6.1.4.1.1718.4.1.3.3.1.2 , st4InputCordActivePower : 1.3.6.1.4.1.1718.4.1.3.3.1.3 , st4InputCordApparentPower : 1.3.6.1.4.1.1718.4.1.3.3.1.5 , st4InputCordPowerUtilized : 1.3.6.1.4.1.1718.4.1.3.3.1.7 , st4InputCordEnergy : 1.3.6.1.4.1.1718.4.1.3.3.1.10 , st4InputCordFrequency : 1.3.6.1.4.1.1718.4.1.3.3.1.11 , st4LineCurrentCapacity : 1.3.6.1.4.1.1718.4.1.4.2.1.6 , st4LineState : 1.3.6.1.4.1.1718.4.1.4.3.1.1 , st4LineStatus : 1.3.6.1.4.1.1718.4.1.4.3.1.2 , st4LineCurrent : 1.3.6.1.4.1.1718.4.1.4.3.1.3 , st4LineCurrentUtilized : 1.3.6.1.4.1.1718.4.1.4.3.1.5 , st4PhaseState : 1.3.6.1.4.1.1718.4.1.5.3.1.1 , st4PhaseStatus : 1.3.6.1.4.1.1718.4.1.5.3.1.2 , st4PhaseVoltage : 1.3.6.1.4.1.1718.4.1.5.3.1.3 , st4PhaseCurrent : 1.3.6.1.4.1.1718.4.1.5.3.1.6 , st4PhaseActivePower : 1.3.6.1.4.1.1718.4.1.5.3.1.8 , st4PhaseApparentPower : 1.3.6.1.4.1.1718.4.1.5.3.1.9 , st4PhaseEnergy : 1.3.6.1.4.1.1718.4.1.5.3.1.13 , st4BranchCurrentCapacity : 1.3.6.1.4.1.1718.4.1.7.2.1.6 , st4BranchState : 1.3.6.1.4.1.1718.4.1.7.3.1.1 , st4BranchStatus : 1.3.6.1.4.1.1718.4.1.7.3.1.2 , st4BranchCurrent : 1.3.6.1.4.1.1718.4.1.7.3.1.3 , st4BranchCurrentUtilized : 1.3.6.1.4.1.1718.4.1.7.3.1.5 , st4OutletState : 1.3.6.1.4.1.1718.4.1.8.3.1.1 , st4OutletStatus : 1.3.6.1.4.1.1718.4.1.8.3.1.2 , st4OutletCurrent : 1.3.6.1.4.1.1718.4.1.8.3.1.3 , st4OutletCurrentUtilized : 1.3.6.1.4.1.1718.4.1.8.3.1.5 , st4OutletVoltage : 1.3.6.1.4.1.1718.4.1.8.3.1.6 , st4OutletActivePower : 1.3.6.1.4.1.1718.4.1.8.3.1.7 , st4OutletApparentPower : 1.3.6.1.4.1.1718.4.1.8.3.1.9 , st4OutletEnergy : 1.3.6.1.4.1.1718.4.1.8.3.1.14 , st4TempSensorValue : 1.3.6.1.4.1.1718.4.1.9.3.1.1 , st4TempSensorStatus : 1.3.6.1.4.1.1718.4.1.9.3.1.2 , st4HumidSensorValue : 1.3.6.1.4.1.1718.4.1.10.3.1.1 , st4HumidSensorStatus : 1.3.6.1.4.1.1718.4.1.10.3.1.2 , st4FanSensorValue : 1.3.6.1.4.1.1718.4.1.14.3.1.1 , st4FanSensorStatus : 1.3.6.1.4.1.1718.4.1.14.3.1.2 ].
Prerequisites
Device must have support for Sentry4-MIB.
Supported Metric
| Monitor Name | Metric Name | Metric Display Name | Unit | Description |
|---|---|---|---|---|
| Server Technology Sentry4 - Unit Status | sentry4_unit_Status | Sentry4 Unit Status | Monitors the status of the unit. [ Sentry4-MIB :: st4UnitStatus : 1.3.6.1.4.1.1718.4.1.2.3.1.1 ] Possible values are : 0 : normal , 1 : disabled , 2 : purged , 5 : reading , 6 : settle , 7 : notFound , 8 : lost , 9 : readError , 10 : noComm , 11 : pwrError , 12 : breakerTripped , 13 : fuseBlown , 14 : lowAlarm , 15 : lowWarning , 16 : highWarning , 17 : highAlarm , 18 : alarm , 19 : underLimit , 20 : overLimit , 21 : nvmFail , 22 : profileError , 23 : conflict. | |
| Server Technology Sentry4 - Input Cord | sentry4_input_cord_outlet_Count | Sentry4 Input Cord Outlet Count | count | Monitors the number of outlets powered from the input cord. [ Sentry4-MIB :: st4InputCordOutletCount : 1.3.6.1.4.1.1718.4.1.3.2.1.24 ]. |
| sentry4_input_cord_State | Sentry4 Input Cord State | Monitors the on/off state of the input cord. [ Sentry4-MIB :: st4InputCordState : 1.3.6.1.4.1.1718.4.1.3.3.1.1 ] Possible values are : 0 : unknown , 1 : on , 2 : off. | ||
| sentry4_input_cord_Status | Sentry4 Input Cord Status | Monitors the status of the input cord. [ Sentry4-MIB :: st4InputCordStatus : 1.3.6.1.4.1.1718.4.1.3.3.1.2 ] Possible values are : 0 : normal , 1 : disabled , 2 : purged , 5 : reading , 6 : settle , 7 : notFound , 8 : lost , 9 : readError , 10 : noComm , 11 : pwrError , 12 : breakerTripped , 13 : fuseBlown , 14 : lowAlarm , 15 : lowWarning , 16 : highWarning , 17 : highAlarm , 18 : alarm , 19 : underLimit , 20 : overLimit , 21 : nvmFail , 22 : profileError , 23 : conflict. | ||
| sentry4_input_cord_active_Power | Sentry4 Input Cord Active Power | W | Monitors the measured active power of the input cord in Watts. [ Sentry4-MIB :: st4InputCordActivePower : 1.3.6.1.4.1.1718.4.1.3.3.1.3 ] | |
| sentry4_input_cord_apparent_power_VoltAmps | Sentry4 Input Cord Apparent Power VoltAmps | Monitors the measured apparent power of the input cord in Volt-Amps. [ Sentry4-MIB :: st4InputCordApparentPower : 1.3.6.1.4.1.1718.4.1.3.3.1.5 ] | ||
| sentry4_input_cord_power_Utilized | Sentry4 Input Cord Power Utilized | % | Monitors the amount of the input cord power capacity used. [ Sentry4-MIB :: st4InputCordPowerUtilized : 1.3.6.1.4.1.1718.4.1.3.3.1.7 ] | |
| sentry4_input_cord_energy_KilowattHours | Sentry4 Input Cord Energy Kilowatt Hours | Monitors the total energy consumption of loads through the input cord in Kilowatt-Hours. [ Sentry4-MIB :: st4InputCordEnergy : 1.3.6.1.4.1.1718.4.1.3.3.1.10 ] | ||
| sentry4_input_cord_Frequency | Sentry4 Input Cord Frequency | Hz | Monitors the frequency of the input cord voltage in Hertz. [ Sentry4-MIB :: st4InputCordFrequency : 1.3.6.1.4.1.1718.4.1.3.3.1.11 ] | |
| Server Technology Sentry4 - Line Current | sentry4_line_current_Capacity | Sentry4 Line Current Capacity | amps | Monitors the current capacity of the line in Amps. [ Sentry4-MIB :: st4LineCurrentCapacity : 1.3.6.1.4.1.1718.4.1.4.2.1.6 ] |
| sentry4_line_State | Sentry4 Line State | Monitors the on/off state of the line. [ Sentry4-MIB :: st4LineState : 1.3.6.1.4.1.1718.4.1.4.3.1.1 ] Possible values are : 0 : unknown , 1 : on , 2 : off. | ||
| sentry4_line_Status | Sentry4 Line Status | Monitors the status of the line. [ Sentry4-MIB :: st4LineStatus : 1.3.6.1.4.1.1718.4.1.4.3.1.2 ] Possible values are : 0 : normal , 1 : disabled , 2 : purged , 5 : reading , 6 : settle , 7 : notFound , 8 : lost , 9 : readError , 10 : noComm , 11 : pwrError , 12 : breakerTripped , 13 : fuseBlown , 14 : lowAlarm , 15 : lowWarning , 16 : highWarning , 17 : highAlarm , 18 : alarm , 19 : underLimit , 20 : overLimit , 21 : nvmFail , 22 : profileError , 23 : conflict. | ||
| sentry4_line_Current | Sentry4 Line Current | amps | Monitors the measured current on the line in Amps. [ Sentry4-MIB :: st4LineCurrent : 1.3.6.1.4.1.1718.4.1.4.3.1.3 ]. | |
| sentry4_line_current_Utilized | Sentry4 Line Current Utilized | % | Monitors the mount of the line current capacity used in percent. [ Sentry4-MIB :: st4LineCurrentUtilized : 1.3.6.1.4.1.1718.4.1.4.3.1.5 ]. | |
| Server Technology Sentry4 - Phase | sentry4_phase_State | Sentry4 Phase State | Monitors the on/off state of the phase. [ Sentry4-MIB :: st4PhaseState : 1.3.6.1.4.1.1718.4.1.5.3.1.1 ] Possible values are : 0 : unknown , 1 : on , 2 : off. | |
| sentry4_phase_Status | Sentry4 Phase Status | Monitors the status of the phase. [ Sentry4-MIB :: st4PhaseStatus : 1.3.6.1.4.1.1718.4.1.5.3.1.2 ] Possible values are : 0 : normal , 1 : disabled , 2 : purged , 5 : reading , 6 : settle , 7 : notFound , 8 : lost , 9 : readError , 10 : noComm , 11 : pwrError , 12 : breakerTripped , 13 : fuseBlown , 14 : lowAlarm , 15 : lowWarning , 16 : highWarning , 17 : highAlarm , 18 : alarm , 19 : underLimit , 20 : overLimit , 21 : nvmFail , 22 : profileError , 23 : conflict. | ||
| sentry4_phase_Voltage | Sentry4 Phase Voltage | v | Monitors the measured voltage on the phase in Volts. [ Sentry4-MIB :: st4PhaseVoltage : 1.3.6.1.4.1.1718.4.1.5.3.1.3 ]. | |
| sentry4_phase_Current | Sentry4 Phase Current | amps | Monitors the measured current on the phase in Amps. [ Sentry4-MIB :: st4PhaseCurrent : 1.3.6.1.4.1.1718.4.1.5.3.1.6 ]. | |
| sentry4_phase_active_Power | Sentry4 Phase Active Power | W | Monitors the measured active power on the phase in Watts. [ Sentry4-MIB :: st4PhaseActivePower : 1.3.6.1.4.1.1718.4.1.5.3.1.8 ] | |
| sentry4_phase_apparent_power_VoltAmps | Sentry4 Phase Active Power | Monitors the measured apparent power on the phase in Volt-Amps. [ Sentry4-MIB :: st4PhaseApparentPower : 1.3.6.1.4.1.1718.4.1.5.3.1.9 ]. | ||
| sentry4_phase_energy_KilowattHours | Sentry4 Phase Energy Kilowatt Hours | Monitors the total energy consumption of loads through the phase in Kilowatt-Hours. [ Sentry4-MIB :: st4PhaseEnergy : 1.3.6.1.4.1.1718.4.1.5.3.1.13 ]. | ||
| Server Technology Sentry4 - Branch | sentry4_branch_current_Capacity | Sentry4 Branch Current Capacity | amps | Monitors the current capacity of the branch in Amps. [ Sentry4-MIB :: st4BranchCurrentCapacity : 1.3.6.1.4.1.1718.4.1.7.2.1.6 ] |
| sentry4_branch_State | Sentry4 Branch State | Monitors the on/off state of the branch. [ Sentry4-MIB :: st4BranchState : 1.3.6.1.4.1.1718.4.1.7.3.1.1 ] Possible values are : 0 : unknown , 1 : on , 2 : off. | ||
| sentry4_branch_Status | Sentry4 Branch Status | Monitors the status of the branch. [ Sentry4-MIB :: st4BranchStatus : 1.3.6.1.4.1.1718.4.1.7.3.1.2 ] Possible values are : 0 : normal , 1 : disabled , 2 : purged , 5 : reading , 6 : settle , 7 : notFound , 8 : lost , 9 : readError , 10 : noComm , 11 : pwrError , 12 : breakerTripped , 13 : fuseBlown , 14 : lowAlarm , 15 : lowWarning , 16 : highWarning , 17 : highAlarm , 18 : alarm , 19 : underLimit , 20 : overLimit , 21 : nvmFail , 22 : profileError , 23 : conflict. | ||
| sentry4_branch_Current | Sentry4 Branch Current | amps | Monitors the measured current on the branch in Amps. [ Sentry4-MIB :: st4BranchCurrent : 1.3.6.1.4.1.1718.4.1.7.3.1.3 ]. | |
| sentry4_branch_current_Utilized | Sentry4 Branch Current Utilized | % | Monitors the amount of the branch current capacity used in percent. [ Sentry4-MIB :: st4BranchCurrentUtilized : 1.3.6.1.4.1.1718.4.1.7.3.1.5 ]. | |
| Server Technology Sentry4 - Outlet | sentry4_outlet_State | Sentry4 Outlet State | Monitors the on/off state of the outlet. [ Sentry4-MIB :: st4OutletState : 1.3.6.1.4.1.1718.4.1.8.3.1.1 ] Possible values are : 0 : unknown , 1 : on , 2 : off. | |
| sentry4_outlet_Status | Sentry4 Outlet Status | Monitors the status of the outlet. [ Sentry4-MIB :: st4OutletStatus : 1.3.6.1.4.1.1718.4.1.8.3.1.2 ] Possible values are : 0 : normal , 1 : disabled , 2 : purged , 5 : reading , 6 : settle , 7 : notFound , 8 : lost , 9 : readError , 10 : noComm , 11 : pwrError , 12 : breakerTripped , 13 : fuseBlown , 14 : lowAlarm , 15 : lowWarning , 16 : highWarning , 17 : highAlarm , 18 : alarm , 19 : underLimit , 20 : overLimit , 21 : nvmFail , 22 : profileError , 23 : conflict.. | ||
| sentry4_outlet_Current | Sentry4 Outlet Current | amps | Monitors the measured current on the outlet in Amps. [ Sentry4-MIB :: st4OutletCurrent : 1.3.6.1.4.1.1718.4.1.8.3.1.3 ]. | |
| sentry4_outlet_current_Utilized | Sentry4 Outlet Current Utilized | % | Monitors the amount of the outlet current capacity used in percent. [ Sentry4-MIB :: st4OutletCurrentUtilized : 1.3.6.1.4.1.1718.4.1.8.3.1.5 ]. | |
| sentry4_outlet_Voltage | Sentry4 Outlet Voltage | v | Monitors the measured voltage of the outlet in Volts. [ Sentry4-MIB :: st4OutletVoltage : 1.3.6.1.4.1.1718.4.1.8.3.1.6 ]. | |
| sentry4_outlet_active_Power | Sentry4 Outlet Active Power | W | Monitors the measured active power of the outlet in Watts. [ Sentry4-MIB :: st4OutletActivePower : 1.3.6.1.4.1.1718.4.1.8.3.1.7 ]. | |
| sentry4_outlet_apparent_power_VoltAmps | Sentry4 Outlet Apparent Power VoltAmps | Monitors the measured apparent power of the outlet in Volt-Amps. [ Sentry4-MIB :: st4OutletApparentPower : 1.3.6.1.4.1.1718.4.1.8.3.1.9 ]. | ||
| sentry4_outlet_energy_WattHours | Sentry4 Outlet Energy WattHours | Monitors the total energy consumption of the device plugged into the outlet in Watt-Hours. [ Sentry4-MIB :: st4OutletEnergy : 1.3.6.1.4.1.1718.4.1.8.3.1.14 ] | ||
| Server Technology Sentry4 - Humidity | sentry4_humidity_sensor_Status | Sentry4 Humidity Sensor Status | Monitors the status of the humidity sensor. [ Sentry4-MIB :: st4HumidSensorStatus : 1.3.6.1.4.1.1718.4.1.10.3.1.2 ] Possible values are : 0 : normal , 1 : disabled , 2 : purged , 5 : reading , 6 : settle , 7 : notFound , 8 : lost , 9 : readError , 10 : noComm , 11 : pwrError , 12 : breakerTripped , 13 : fuseBlown , 14 : lowAlarm , 15 : lowWarning , 16 : highWarning , 17 : highAlarm , 18 : alarm , 19 : underLimit , 20 : overLimit , 21 : nvmFail , 22 : profileError , 23 : conflict. | |
| sentry4_humidity_sensor_value_PercentageRelativeHumidity | Sentry4 Humidity Sensor Value Percentage Relative Humidity | Monitors the humidity on the sensor in percentage relative humidity. [ Sentry4-MIB :: st4HumidSensorValue : 1.3.6.1.4.1.1718.4.1.10.3.1.1 ]. | ||
| Server Technology Sentry4 - Temperature | sentry4_temperature_sensor_Value | Sentry4 Temperature Sensor Value | Celsius | Monitors the measured temperature on the sensor in degrees. [ Sentry4-MIB :: st4TempSensorValue : 1.3.6.1.4.1.1718.4.1.9.3.1.1 ]. |
| sentry4_temperature_sensor_Status | Sentry4 Temperature Sensor Status | Monitors the status of the temperature sensor. [ Sentry4-MIB :: st4TempSensorStatus : 1.3.6.1.4.1.1718.4.1.9.3.1.2 ] Possible values are : 0 : normal , 1 : disabled , 2 : purged , 5 : reading , 6 : settle , 7 : notFound , 8 : lost , 9 : readError , 10 : noComm , 11 : pwrError , 12 : breakerTripped , 13 : fuseBlown , 14 : lowAlarm , 15 : lowWarning , 16 : highWarning , 17 : highAlarm , 18 : alarm , 19 : underLimit , 20 : overLimit , 21 : nvmFail , 22 : profileError , 23 : conflict. | ||
| Server Technology Sentry4 - Fan | sentry4_fan_sensor_Value | Sentry4 Fan Sensor Value | rpm | Monitors the measured fan speed of the sensor in rotations per minute. [ Sentry4-MIB :: st4FanSensorValue : 1.3.6.1.4.1.1718.4.1.14.3.1.1 ]. |
| sentry4_fan_sensor_Status | Sentry4 Fan Sensor Status | Monitors the status of the fan sensor. [ Sentry4-MIB :: st4FanSensorStatus : 1.3.6.1.4.1.1718.4.1.14.3.1.2 ] Possible values are : 0 : normal , 1 : disabled , 2 : purged , 5 : reading , 6 : settle , 7 : notFound , 8 : lost , 9 : readError , 10 : noComm , 11 : pwrError , 12 : breakerTripped , 13 : fuseBlown , 14 : lowAlarm , 15 : lowWarning , 16 : highWarning , 17 : highAlarm , 18 : alarm , 19 : underLimit , 20 : overLimit , 21 : nvmFail , 22 : profileError , 23 : conflict.. |
SNMP Response Status
Description
Indicates whether the target device responds to SNMP polling on the configured OID. The default OID is sysUpTime (1.3.6.1.2.1.1.3.0), which is present on all SNMP-enabled devices. A custom OID can be configured via monitor input "snmp_poll_Oid" and supports the leading dot format (e.g. .1.3.6.1.2.1.1.3.0). Possible values are: 1 (RESPONDING) if the device successfully responds to SNMP GET or WALK, 2 (Not_ RESPONDING) if the device times out or rejects authentication due to being unreachable, wrong credentials, a firewall blocking SNMP, or SNMP not being enabled on the device. 3 (NO_SUCH_INSTANCE_OR_NO_SUCH_OBJECT) if the device is reachable via SNMP but the configured OID does not exist on it. 4 (OTHER_EXCEPTION_OCCURED) for unexpected errors such as IO failures or parse errors. 0 (INVALID_INPUT_OID_FORMAT) if the configured OID does not match numeric dotted notation.
Prerequisites
Device must have SNMP enabled with valid credentials configured.
Supported Metric
| Monitor Name | Metric Name | Metric Display Name | Metric Description | Unit | Metric Category |
|---|---|---|---|---|---|
| SNMP Response Status | snmp_response_Status | SNMP Response Status | Indicates whether the target device responds to SNMP polling on the configured OID. The default OID is sysUpTime (1.3.6.1.2.1.1.3.0), which is present on all SNMP-enabled devices. A custom OID can be configured via monitor input \"snmp_poll_Oid\" and supports the leading dot format (e.g. .1.3.6.1.2.1.1.3.0). Possible values are: 1 (RESPONDING) if the device successfully responds to SNMP GET or WALK, 2 (Not_ RESPONDING) if the device times out or rejects authentication due to being unreachable, wrong credentials, a firewall blocking SNMP, or SNMP not being enabled on the device. 3 (NO_SUCH_INSTANCE_OR_NO_SUCH_OBJECT) if the device is reachable via SNMP but the configured OID does not exist on it. 4 (OTHER_EXCEPTION_OCCURED) for unexpected errors such as IO failures or parse errors. 0 (INVALID_INPUT_OID_FORMAT) if the configured OID does not match numeric dotted notation. | AVAILABILITY |
SNMP Interface - 32-bit Counter
Description
Monitors the Interface Status,Utilization,Traffic,Errors and Discards Rate. It uses the 32 bit counter oids to monitor Traffic and Utilization.
Prerequisites
No prerequisite
Supported Metric
| Monitor Name | Metric Name | Metric Display Name | Unit | Description |
|---|---|---|---|---|
| SNMP Interface - 32-bit Counter | network.interface.status | Interface Status | This metric represents the status of the interface based on the values derived from ifAdminStatus and ifOperStatus. It generates alerts if interface operational status is not in Up or Dormant state even interface admin status is Up.[OID: ifOperStatus-1.3.6.1.2.1.2.2.1.8; ifAdminStatus-1.3.6.1.2.1.2.2.1.7] | |
| network.interface.traffic.in | Interface Traffic In | bps | This metric calculates the network interface Octets received on the interface. Raw value from the interface will be captured which comes in bytes and will be converted to bits using the expression.[OID: ifInOctets - 1.3.6.1.2.1.2.2.1.10] | |
| network.interface.traffic.out | Interface Traffic Out | bps | This metric calculates the network interface Octets transmitted on the interface. Raw value from the interface will be captured which comes in bytes and will be converted to bits using the expression.[OID: ifOutOctets - 1.3.6.1.2.1.2.2.1.16] | |
| network.interface.utilization.in | Interface Utilization In | % | This metric calculates the network traffic in utilization. To calculate this,Interface speed is required. Raw interface speed is captured from interface and expression calculates the incoming utilization percentage based on the Traffic in metric.[OID: ifSpeed - 1.3.6.1.2.1.2.2.1.5; ifInOctets - 1.3.6.1.2.1.2.2.1.10] | |
| network.interface.utilization.out | Interface Utilization Out | % | This metric calculates the network traffic out utilization. To calculate this,Interface speed is required. SNMP based Interface speed is considered as input for this expression calculates the outgoing utilization percentage based on the Traffic out metric.[OID: ifSpeed - 1.3.6.1.2.1.2.2.1.5,ifOutOctets - 1.3.6.1.2.1.2.2.1.16] | |
| network.interface.errors.in | Interface Errors In | packet/min | It monitors the number of inbound packets that contained errors preventing them from being deliverable to a higher-layer protocol. Raw values from the interface is captured and the expression converts it to minutes.[OID: ifInErrors - 1.3.6.1.2.1.2.2.1.14] | |
| network.interface.errors.out | Interface Errors Out | packet/min | It monitors the number of outbound packets that could not be transmitted because of errors. Raw values from the interface is captured and the expression converts it to minutes.[OID: ifOutErrors - 1.3.6.1.2.1.2.2.1.20] | |
| network.interface.discards.in | Interface Discards In | packet/min | It monitors the number of inbound packets which were chosen to be discarded even though no errors had been detected to prevent their being deliverable to a higher-layer protocol. One possible reason for discarding such a packet could be to free up buffer space.[OID: ifInDiscards - 1.3.6.1.2.1.2.2.1.13] | |
| network.interface.discards.out | Interface Discards Out | packet/min | It monitors the number of outbound packets which were chosen to be discarded even though no errors had been detected to prevent their being transmitted. One possible reason for discarding such a packet could be to free up buffer space.[OID: ifOutDiscards - 1.3.6.1.2.1.2.2.1.19] |
SNMP Interface - 32-bit Counter - v2
Description
Monitors the Interface Status, Utilization, Traffic, Errors and Discards Rate. It uses the 32 bit counter oids to monitor Traffic and Utilization.
Prerequisites
No prerequisite
Supported Metric
| Monitor Name | Metric Name | Metric Display Name | Unit | Description |
|---|---|---|---|---|
| SNMP Interface - 32-bit Counter - v2 | network.interface.status | Interface Status | This metric represents the status of the interface based on the values derived from ifAdminStatus and ifOperStatus. It generates alerts if interface operational status is not in Up or Dormant state even interface admin status is Up.[OID: ifOperStatus-1.3.6.1.2.1.2.2.1.8; ifAdminStatus-1.3.6.1.2.1.2.2.1.7] | |
| network.interface.traffic.in | Interface Traffic In | bps | This metric calculates the network interface Octets received on the interface. Raw value from the interface will be captured which comes in bytes and will be converted to bits using the expression.[OID: ifInOctets - 1.3.6.1.2.1.2.2.1.10] | |
| network.interface.traffic.out | Interface Traffic Out | bps | This metric calculates the network interface Octets transmitted on the interface. Raw value from the interface will be captured which comes in bytes and will be converted to bits using the expression.[OID: ifOutOctets - 1.3.6.1.2.1.2.2.1.16] | |
| network.interface.utilization.in | Interface Utilization In | % | This metric calculates the network traffic in utilization. To calculate this,Interface speed is required. Raw interface speed is captured from interface and expression calculates the incoming utilization percentage based on the Traffic in metric.[OID: ifSpeed - 1.3.6.1.2.1.2.2.1.5; ifInOctets - 1.3.6.1.2.1.2.2.1.10] | |
| network.interface.utilization.out | Interface Utilization Out | % | This metric calculates the network traffic out utilization. To calculate this,Interface speed is required. SNMP based Interface speed is considered as input for this expression calculates the outgoing utilization percentage based on the Traffic out metric.[OID: ifSpeed - 1.3.6.1.2.1.2.2.1.5,ifOutOctets - 1.3.6.1.2.1.2.2.1.16] | |
| network.interface.errors.in | Interface Errors In | packet/min | It monitors the number of inbound packets that contained errors preventing them from being deliverable to a higher-layer protocol. Raw values from the interface is captured and the expression converts it to minutes.[OID: ifInErrors - 1.3.6.1.2.1.2.2.1.14] | |
| network.interface.errors.out | Interface Errors Out | packet/min | It monitors the number of outbound packets that could not be transmitted because of errors. Raw values from the interface is captured and the expression converts it to minutes.[OID: ifOutErrors - 1.3.6.1.2.1.2.2.1.20] | |
| network.interface.discards.in | Interface Discards In | packet/min | It monitors the number of inbound packets which were chosen to be discarded even though no errors had been detected to prevent their being deliverable to a higher-layer protocol. One possible reason for discarding such a packet could be to free up buffer space.[OID: ifInDiscards - 1.3.6.1.2.1.2.2.1.13] | |
| network.interface.discards.out | Interface Discards Out | packet/min | It monitors the number of outbound packets which were chosen to be discarded even though no errors had been detected to prevent their being transmitted. One possible reason for discarding such a packet could be to free up buffer space.[OID: ifOutDiscards - 1.3.6.1.2.1.2.2.1.19] |
SNMP Interface - 32-bit Counter - v3
Description
Monitors the Interface Status, Utilization, Traffic, Errors and Discards Rate. It uses the 32 bit counter oids to monitor Traffic and Utilization.
Prerequisites
Device must have support for IF-MIB
Supported Metric
| Monitor Name | Metric Name | Metric Display Name | Unit | Description |
|---|---|---|---|---|
| SNMP Interface - 32-bit Counter - v3 | network.interface.status | Interface Status | This metric represents the status of the interface based on the values derived from ifAdminStatus and ifOperStatus. It generates alerts if interface operational status is not in Up or Dormant state even interface admin status is Up. Possible values are : 1 : up , 2 : down , 3 : testing , 4 : unknown , 5 : dormant , 6 : notPresent , 7 : lowerLayerDown.[OID: ifOperStatus-1.3.6.1.2.1.2.2.1.8; ifAdminStatus-1.3.6.1.2.1.2.2.1.7] | |
| network.interface.traffic.in | Interface Traffic In | bps | This metric calculates the network interface Octets received on the interface. Raw value from the interface will be captured which comes in bytes and will be converted to bits using the expression. [OID: ifInOctets - 1.3.6.1.2.1.2.2.1.10] | |
| network.interface.traffic.out | Interface Traffic Out | bps | This metric calculates the network interface Octets transmitted on the interface. Raw value from the interface will be captured which comes in bytes and will be converted to bits using the expression.[OID: ifOutOctets - 1.3.6.1.2.1.2.2.1.16] | |
| network.interface.utilization.in | Interface Utilization In | % | This metric calculates the network traffic in utilization. To calculate this,Interface speed is required. Raw interface speed is captured from interface and expression calculates the incoming utilization percentage based on the Traffic in metric.[OID: ifSpeed - 1.3.6.1.2.1.2.2.1.5; ifInOctets - 1.3.6.1.2.1.2.2.1.10] | |
| network.interface.utilization.out | Interface Utilization Out | % | This metric calculates the network traffic out utilization. To calculate this, Interface speed is required. SNMP based Interface speed is considered as input for this expression calculates the outgoing utilization percentage based on the Traffic out metric. [OID: ifSpeed - 1.3.6.1.2.1.2.2.1.5, ifOutOctets - 1.3.6.1.2.1.2.2.1.16] | |
| network.interface.errors.in | Interface Errors In | packet/min | It monitors the number of inbound packets that contained errors preventing them from being deliverable to a higher-layer protocol. Raw values from the interface is captured and the expression converts it to minutes. [OID: ifInErrors - 1.3.6.1.2.1.2.2.1.14] | |
| network.interface.errors.out | Interface Errors Out | packet/min | It monitors the number of outbound packets that could not be transmitted because of errors. Raw values from the interface is captured and the expression converts it to minutes. [OID: ifOutErrors - 1.3.6.1.2.1.2.2.1.20] | |
| network.interface.discards.in | Interface Discards In | packet/min | It monitors the number of inbound packets which were chosen to be discarded even though no errors had been detected to prevent their being deliverable to a higher-layer protocol. One possible reason for discarding such a packet could be to free up buffer space. [OID: ifInDiscards - 1.3.6.1.2.1.2.2.1.13] | |
| network.interface.discards.out | Interface Discards Out | packet/min | It monitors the number of outbound packets which were chosen to be discarded even though no errors had been detected to prevent their being transmitted. One possible reason for discarding such a packet could be to free up buffer space. [OID: ifOutDiscards - 1.3.6.1.2.1.2.2.1.19] |
SNMP Interface Additional Statistics - 32-bit Counter
Description
Monitors the network interface In packets , Out packets , in unicast packets, out unicast packets, in multicast packets, out multicast packets, in broadcast packets, out broadcast packets and in unknown protocols dropped. Validated on Cisco WS-C2960X-48TS-LL (SysObjID : 1.3.6.1.4.1.9.1.1703 ). [ IF-MIB :: ifInUcastPkts : 1.3.6.1.2.1.2.2.1.11 , ifInMulticastPkts : 1.3.6.1.2.1.31.1.1.1.2 , ifInBroadcastPkts : 1.3.6.1.2.1.31.1.1.1.3 , ifOutUcastPkts : 1.3.6.1.2.1.2.2.1.17 , ifOutMulticastPkts : 1.3.6.1.2.1.31.1.1.1.4 , ifOutBroadcastPkts : 1.3.6.1.2.1.31.1.1.1.5 , ifInUnknownProtos : 1.3.6.1.2.1.2.2.1.15 ].
Prerequisites
Device must have support for IF-MIB.
Supported Metric
| Monitor Name | Metric Name | Metric Display Name | Unit | Metric Category | Description |
|---|---|---|---|---|---|
| SNMP Interface Additional Statistics - 32-bit Counter | network_interface_out_BroadcastPackets | Network Interface Broadcast Packets Out | packets/sec | PERFORMANCE | Monitors the rate per second, at which the outbound broadcast packets that are transmitted out of this interface during the last polling period. [ IF-MIB :: ifOutBroadcastPkts : 1.3.6.1.2.1.31.1.1.1.5 ] |
| network_interface_in_BroadcastPackets | Network Interface Broadcast Packets In | packets/sec | PERFORMANCE | Monitors the rate per second, at which the inbound broadcast packets that are received by an interface during the last polling period. [ IF-MIB :: ifInBroadcastPkts : 1.3.6.1.2.1.31.1.1.1.3 ] | |
| network_interface_in_UnicastPackets | Network Interface Unicast Packets In | packets/sec | PERFORMANCE | Monitors the rate per second, at which the inbound Unicast packets that are received by an interface during the last polling period. [ IF-MIB :: ifInUcastPkts : 1.3.6.1.2.1.2.2.1.11 ] | |
| network_interface_out_UnicastPackets | Network Interface Unicast Packets Out | packets/sec | PERFORMANCE | Monitors the rate per second, at which the outbound Unicast packets that are transmitted out of this interface during the last polling period. [ IF-MIB :: ifOutUcastPkts : 1.3.6.1.2.1.2.2.1.17 ] | |
| network_interface_in_MulticastPackets | Network Interface Multicast Packets In | packets/sec | PERFORMANCE | Monitors the rate per second, at which the inbound Multicast packets that are received by an interface during the last polling period. [ IF-MIB :: ifInMulticastPkts : 1.3.6.1.2.1.31.1.1.1.2 ] | |
| network_interface_out_MulticastPackets | Network Interface Multicast Packets Out | packets/sec | PERFORMANCE | Monitors the rate per second, at which the outbound Multicast packets that are transmitted out of this interface during the last polling period. [ IF-MIB :: ifOutMulticastPkts : 1.3.6.1.2.1.31.1.1.1.4 ] | |
| network_interface_in_UnknownProtosDropped | Network Interface In Unknown Protocols Dropped | count | PERFORMANCE | Monitors the number of packets or transmission units dropped because of an unknown or unsupported protocol. The value is returned as zero by any interface, which has no concept of protocol. [ IF-MIB :: ifInUnknownProtos : 1.3.6.1.2.1.2.2.1.15 ] | |
| network_interface_packets_In | Network Interface Packets In | packets/sec | PERFORMANCE | Monitors the rate per second, at which the total number of packets that are received by an interface during the last polling period. [ IF-MIB :: ifInUcastPkts : 1.3.6.1.2.1.2.2.1.11 , ifInMulticastPkts : 1.3.6.1.2.1.31.1.1.1.2 , ifInBroadcastPkts : 1.3.6.1.2.1.31.1.1.1.3 ] | |
| network_interface_packets_Out | Network Interface Packets Out | packets/sec | PERFORMANCE | Monitors the rate per second, at which the total packets transmitted out of this interface during the last polling period. [ IF-MIB :: ifOutUcastPkts : 1.3.6.1.2.1.2.2.1.17 , ifOutMulticastPkts : 1.3.6.1.2.1.31.1.1.1.4 , ifOutBroadcastPkts : 1.3.6.1.2.1.31.1.1.1.5 ] |
SNMP Interface - 64-bit Counter
Description
Monitors the Interface Status,Utilization,Traffic,Errors and Discards Rate. It uses 64 bit counter snmp oids to monitor Traffic and Utilization.
Prerequisites
No prerequisite
Supported Metric
| Monitor Name | Metric Name | Metric Display Name | Unit | Description |
|---|---|---|---|---|
| SNMP Interface - 64-bit Counter | network.interface.status | Interface Status | This metric represents the status of the interface based on the values derived from ifAdminStatus and ifOperStatus. It generates alerts if interface operational status is not in Up or Dormant state even interface admin status is Up.[OID: ifOperStatus-1.3.6.1.2.1.2.2.1.8; ifAdminStatus-1.3.6.1.2.1.2.2.1.7] | |
| network.interface.traffic.in | Interface Traffic In | bps | This metric calculates the network interface Octets received on the interface. Raw value from the interface will be captured which comes in bytes and will be converted to bits using the expression.[OID: ifInOctets - 1.3.6.1.2.1.2.2.1.10] | |
| network.interface.traffic.out | Interface Traffic Out | bps | This metric calculates the network interface Octets transmitted on the interface. Raw value from the interface will be captured which comes in bytes and will be converted to bits using the expression.[OID: ifOutOctets - 1.3.6.1.2.1.2.2.1.16] | |
| network.interface.utilization.in | Interface Utilization In | % | This metric calculates the network traffic in utilization. To calculate this,Interface speed is required. Raw interface speed is captured from interface and expression calculates the incoming utilization percentage based on the Traffic in metric.[OID: ifSpeed - 1.3.6.1.2.1.2.2.1.5; ifInOctets - 1.3.6.1.2.1.2.2.1.10] | |
| network.interface.utilization.out | Interface Utilization Out | % | This metric calculates the network traffic out utilization. To calculate this,Interface speed is required. SNMP based Interface speed is considered as input for this expression calculates the outgoing utilization percentage based on the Traffic out metric.[OID: ifSpeed - 1.3.6.1.2.1.2.2.1.5,ifOutOctets - 1.3.6.1.2.1.2.2.1.16] | |
| network.interface.errors.in | Interface Errors In | packet/min | It monitors the number of inbound packets that contained errors preventing them from being deliverable to a higher-layer protocol. Raw values from the interface is captured and the expression converts it to minutes.[OID: ifInErrors - 1.3.6.1.2.1.2.2.1.14] | |
| network.interface.errors.out | Interface Errors Out | packet/min | It monitors the number of outbound packets that could not be transmitted because of errors. Raw values from the interface is captured and the expression converts it to minutes.[OID: ifOutErrors - 1.3.6.1.2.1.2.2.1.20] | |
| network.interface.discards.in | Interface Discards In | packet/min | It monitors the number of inbound packets which were chosen to be discarded even though no errors had been detected to prevent their being deliverable to a higher-layer protocol. One possible reason for discarding such a packet could be to free up buffer space.[OID: ifInDiscards - 1.3.6.1.2.1.2.2.1.13] | |
| network.interface.discards.out | Interface Discards Out | packet/min | It monitors the number of outbound packets which were chosen to be discarded even though no errors had been detected to prevent their being transmitted. One possible reason for discarding such a packet could be to free up buffer space.[OID: ifOutDiscards - 1.3.6.1.2.1.2.2.1.19] |
SNMP Interface - 64-bit Counter - v2
Description
Monitors the Interface Status,Utilization,Traffic,Errors and Discards Rate. It uses 64 bit counter snmp oids to monitor Traffic and Utilization.
Prerequisites
No prerequisite
Supported Metric
| Monitor Name | Metric Name | Metric Display Name | Unit | Description |
|---|---|---|---|---|
| SNMP Interface - 64-bit Counter - v2 | network.interface.status | Interface Status | This metric represents the status of the interface based on the values derived from ifAdminStatus and ifOperStatus. It generates alerts if interface operational status is not in Up or Dormant state even interface admin status is Up.[OID: ifOperStatus-1.3.6.1.2.1.2.2.1.8; ifAdminStatus-1.3.6.1.2.1.2.2.1.7] | |
| network.interface.traffic.in | Interface Traffic In | bps | This metric calculates the network interface Octets received on the interface. Raw value from the interface will be captured which comes in bytes and will be converted to bits using the expression.[OID: ifInOctets - 1.3.6.1.2.1.2.2.1.10] | |
| network.interface.traffic.out | Interface Traffic Out | bps | This metric calculates the network interface Octets transmitted on the interface. Raw value from the interface will be captured which comes in bytes and will be converted to bits using the expression.[OID: ifOutOctets - 1.3.6.1.2.1.2.2.1.16] | |
| network.interface.utilization.in | Interface Utilization In | % | This metric calculates the network traffic in utilization. To calculate this,Interface speed is required. Raw interface speed is captured from interface and expression calculates the incoming utilization percentage based on the Traffic in metric.[OID: ifSpeed - 1.3.6.1.2.1.2.2.1.5; ifInOctets - 1.3.6.1.2.1.2.2.1.10] | |
| network.interface.utilization.out | Interface Utilization Out | % | This metric calculates the network traffic out utilization. To calculate this,Interface speed is required. SNMP based Interface speed is considered as input for this expression calculates the outgoing utilization percentage based on the Traffic out metric.[OID: ifSpeed - 1.3.6.1.2.1.2.2.1.5,ifOutOctets - 1.3.6.1.2.1.2.2.1.16] | |
| network.interface.errors.in | Interface Errors In | packet/min | It monitors the number of inbound packets that contained errors preventing them from being deliverable to a higher-layer protocol. Raw values from the interface is captured and the expression converts it to minutes.[OID: ifInErrors - 1.3.6.1.2.1.2.2.1.14] | |
| network.interface.errors.out | Interface Errors Out | packet/min | It monitors the number of outbound packets that could not be transmitted because of errors. Raw values from the interface is captured and the expression converts it to minutes.[OID: ifOutErrors - 1.3.6.1.2.1.2.2.1.20] | |
| network.interface.discards.in | Interface Discards In | packet/min | It monitors the number of inbound packets which were chosen to be discarded even though no errors had been detected to prevent their being deliverable to a higher-layer protocol. One possible reason for discarding such a packet could be to free up buffer space.[OID: ifInDiscards - 1.3.6.1.2.1.2.2.1.13] | |
| network.interface.discards.out | Interface Discards Out | packet/min | It monitors the number of outbound packets which were chosen to be discarded even though no errors had been detected to prevent their being transmitted. One possible reason for discarding such a packet could be to free up buffer space.[OID: ifOutDiscards - 1.3.6.1.2.1.2.2.1.19] |
SNMP Interface - 64-bit Counter - v3
Description
Monitors the Interface Status,Utilization,Traffic,Errors and Discards Rate. It uses 64 bit counter snmp oids to monitor Traffic and Utilization.
Prerequisites
No prerequisite
Supported Metric
| Monitor Name | Metric Name | Metric Display Name | Unit | Description |
|---|---|---|---|---|
| SNMP Interface - 64-bit Counter - v3 | network.interface.status | Interface Status | This metric represents the status of the interface based on the values derived from ifAdminStatus and ifOperStatus. It generates alerts if interface operational status is not in Up or Dormant state even interface admin status is Up. [OID: ifOperStatus-1.3.6.1.2.1.2.2.1.8; ifAdminStatus-1.3.6.1.2.1.2.2.1.7] | |
| network.interface.traffic.in | Interface Traffic In | bps | This metric calculates the network interface Octets received on the interface. Raw value from the interface will be captured which comes in bytes and will be converted to bits using the expression. [OID: ifHCInOctets - 1.3.6.1.2.1.31.1.1.1.6] | |
| network.interface.traffic.out | Interface Traffic Out | bps | This metric calculates the network interface Octets transmitted on the interface. Raw value from the interface will be captured which comes in bytes and will be converted to bits using the expression. [OID: ifHCOutOctets - 1.3.6.1.2.1.31.1.1.1.10] | |
| network.interface.utilization.in | Interface Utilization In | % | This metric calculates the network traffic in utilization. To calculate this, Interface speed is required. Raw interface speed is captured from interface and expression calculates the incoming utilization percentage based on the Traffic in metric. [OID: ifHighSpeed - 1.3.6.1.2.1.31.1.1.1.15; ifHCInOctets - 1.3.6.1.2.1.31.1.1.1.6] | |
| network.interface.utilization.out | Interface Utilization Out | % | This metric calculates the network traffic out utilization. To calculate this, Interface speed is required. SNMP based Interface speed is considered as input for this expression calculates the outgoing utilization percentage based on the Traffic out metric. [OID: ifHighSpeed - 1.3.6.1.2.1.31.1.1.1.15, ifHCOutOctets - 1.3.6.1.2.1.31.1.1.1.10] | |
| network.interface.errors.in | Interface Errors In | packet/min | It monitors the number of inbound packets that contained errors preventing them from being deliverable to a higher-layer protocol. Raw values from the interface is captured and the expression converts it to minutes. [OID: ifInErrors - 1.3.6.1.2.1.2.2.1.14] | |
| network.interface.errors.out | Interface Errors Out | packet/min | It monitors the number of outbound packets that could not be transmitted because of errors. Raw values from the interface is captured and the expression converts it to minutes. [OID: ifOutErrors - 1.3.6.1.2.1.2.2.1.20] | |
| network.interface.discards.in | Interface Discards In | packet/min | It monitors the number of inbound packets which were chosen to be discarded even though no errors had been detected to prevent their being deliverable to a higher-layer protocol. One possible reason for discarding such a packet could be to free up buffer space. [OID: ifInDiscards - 1.3.6.1.2.1.2.2.1.13] | |
| network.interface.discards.out | Interface Discards Out | packet/min | It monitors the number of outbound packets which were chosen to be discarded even though no errors had been detected to prevent their being transmitted. One possible reason for discarding such a packet could be to free up buffer space. [OID: ifOutDiscards - 1.3.6.1.2.1.2.2.1.19] |
SNMP Interface Additional Statistics - 64-bit Counter
Description
Monitors the network interface In packets, Out packets , in unicast packets, out unicast packets, in multicast packets, out multicast packets, in broadcast packets and out broadcast packets. Validated on Cisco WS-C2960X-48TS-LL (SysObjID : 1.3.6.1.4.1.9.1.1703 ). [ IF-MIB :: ifHCInUcastPkts : 1.3.6.1.2.1.31.1.1.1.7 , ifHCInMulticastPkts : 1.3.6.1.2.1.31.1.1.1.8 , ifHCInBroadcastPkts : 1.3.6.1.2.1.31.1.1.1.9 , ifHCOutUcastPkts : 1.3.6.1.2.1.31.1.1.1.11 , ifHCOutMulticastPkts : 1.3.6.1.2.1.31.1.1.1.12 , ifHCOutBroadcastPkts : 1.3.6.1.2.1.31.1.1.1.13 ].
Prerequisites
Device must have support for IF-MIB.
Supported Metric
| Monitor Name | Metric Name | Metric Display Name | Unit | Metric Category | Description | |
|---|---|---|---|---|---|---|
| SNMP Interface Additional Statistics - 64-bit Counter | network_interface_out_BroadcastPackets | Network Interface Broadcast Packets Out | packets/sec | PERFORMANCE | Monitors the rate per second, at which the outbound broadcast packets that are transmitted out of this interface during the last polling period. [ IF-MIB :: ifHCOutBroadcastPkts : 1.3.6.1.2.1.31.1.1.1.13 ] | |
| network_interface_in_BroadcastPackets | Network Interface Broadcast Packets In | packets/sec | PERFORMANCE | Monitors the rate per second, at which the inbound broadcast packets that are received by an interface during the last polling period. [ IF-MIB :: ifHCInBroadcastPkts : 1.3.6.1.2.1.31.1.1.1.9 ] | ||
| network_interface_in_UnicastPackets | Network Interface Unicast Packets In | packets/sec | PERFORMANCE | Monitors the rate per second, at which the inbound Unicast packets that are received by an interface during the last polling period. [ IF-MIB :: ifHCInUcastPkts : 1.3.6.1.2.1.31.1.1.1.7 ] | ||
| network_interface_out_UnicastPackets | Network Interface Unicast Packets Out | packets/sec | PERFORMANCE | Monitors the rate per second, at which the outbound Unicast packets that are transmitted out of this interface during the last polling period. [ IF-MIB :: ifHCOutUcastPkts : 1.3.6.1.2.1.31.1.1.1.11 ] | ||
| network_interface_in_MulticastPackets | Network Interface Multicast Packets In | packets/sec | PERFORMANCE | Monitors the rate per second, at which the inbound Multicast packets that are received by an interface during the last polling period. [ IF-MIB :: ifHCInMulticastPkts : 1.3.6.1.2.1.31.1.1.1.8 ] | ||
| network_interface_out_MulticastPackets | Network Interface Multicast Packets Out | packets/sec | PERFORMANCE | Monitors the rate per second, at which the outbound Multicast packets that are transmitted out of this interface during the last polling period. [ IF-MIB :: ifHCOutMulticastPkts : 1.3.6.1.2.1.31.1.1.1.12 ] | ||
| network_interface_packets_In | Network Interface Packets In | packets/sec | PERFORMANCE | Monitors the rate per second, at which the total number of packets that are received by an interface during the last polling period. [ IF-MIB :: ifHCInUcastPkts : 1.3.6.1.2.1.31.1.1.1.7 , ifHCInMulticastPkts : 1.3.6.1.2.1.31.1.1.1.8 , ifHCInBroadcastPkts : 1.3.6.1.2.1.31.1.1.1.9 ] | ||
| network_interface_packets_Out | Network Interface Packets Out | packets/sec | PERFORMANCE | Monitors the rate per second, at which the total packets transmitted out of this interface during the last polling period. [ IF-MIB :: ifHCOutUcastPkts : 1.3.6.1.2.1.31.1.1.1.11 , ifHCOutMulticastPkts : 1.3.6.1.2.1.31.1.1.1.12 , ifHCOutBroadcastPkts : 1.3.6.1.2.1.31.1.1.1.13 ] |
SNMP Interface - 64-bit Counter - Traffic in Mbps
Description
SNMP Interface - 64-bit Counter - Traffic in Mbps
Prerequisites
No prerequisite
Supported Metric
| Monitor Name | Metric Name | Metric Display Name | Unit | Description |
|---|---|---|---|---|
| SNMP Interface - 64-bit Counter - v2 | network.interface.status | Interface Status | This metric represents the status of the interface based on the values derived from ifAdminStatus and ifOperStatus. It generates alerts if interface operational status is not in Up or Dormant state even interface admin status is Up.[OID: ifOperStatus-1.3.6.1.2.1.2.2.1.8; ifAdminStatus-1.3.6.1.2.1.2.2.1.7] | |
| network.interface.traffic.in | Interface Traffic In | bps | This metric calculates the network interface Octets received on the interface. Raw value from the interface will be captured which comes in bytes and will be converted to bits using the expression.[OID: ifInOctets - 1.3.6.1.2.1.2.2.1.10] | |
| network.interface.traffic.out | Interface Traffic Out | bps | This metric calculates the network interface Octets transmitted on the interface. Raw value from the interface will be captured which comes in bytes and will be converted to bits using the expression.[OID: ifOutOctets - 1.3.6.1.2.1.2.2.1.16] | |
| network.interface.utilization.in | Interface Utilization In | % | This metric calculates the network traffic in utilization. To calculate this,Interface speed is required. Raw interface speed is captured from interface and expression calculates the incoming utilization percentage based on the Traffic in metric.[OID: ifSpeed - 1.3.6.1.2.1.2.2.1.5; ifInOctets - 1.3.6.1.2.1.2.2.1.10] | |
| network.interface.utilization.out | Interface Utilization Out | % | This metric calculates the network traffic out utilization. To calculate this,Interface speed is required. SNMP based Interface speed is considered as input for this expression calculates the outgoing utilization percentage based on the Traffic out metric.[OID: ifSpeed - 1.3.6.1.2.1.2.2.1.5,ifOutOctets - 1.3.6.1.2.1.2.2.1.16] | |
| network.interface.errors.in | Interface Errors In | packet/min | It monitors the number of inbound packets that contained errors preventing them from being deliverable to a higher-layer protocol. Raw values from the interface is captured and the expression converts it to minutes.[OID: ifInErrors - 1.3.6.1.2.1.2.2.1.14] | |
| network.interface.errors.out | Interface Errors Out | packet/min | It monitors the number of outbound packets that could not be transmitted because of errors. Raw values from the interface is captured and the expression converts it to minutes.[OID: ifOutErrors - 1.3.6.1.2.1.2.2.1.20] | |
| network.interface.discards.in | Interface Discards In | packet/min | It monitors the number of inbound packets which were chosen to be discarded even though no errors had been detected to prevent their being deliverable to a higher-layer protocol. One possible reason for discarding such a packet could be to free up buffer space.[OID: ifInDiscards - 1.3.6.1.2.1.2.2.1.13] | |
| network.interface.discards.out | Interface Discards Out | packet/min | It monitors the number of outbound packets which were chosen to be discarded even though no errors had been detected to prevent their being transmitted. One possible reason for discarding such a packet could be to free up buffer space.[OID: ifOutDiscards - 1.3.6.1.2.1.2.2.1.19] |
SNMP Interface - 64-bit Counter - Traffic in Mbps - v2
Description
SNMP Interface - 64-bit Counter - Traffic in Mbps
Prerequisites
No prerequisite
Supported Metric
| Monitor Name | Metric Name | Metric Display Name | Unit | Description |
|---|---|---|---|---|
| SNMP Interface - 64-bit Counter - Traffic in Mbps - v2 | network.interface.status | Interface Status | This metric represents the status of the interface based on the values derived from ifAdminStatus and ifOperStatus. It generates alerts if interface operational status is not in Up or Dormant state even interface admin status is Up.[OID: ifOperStatus-1.3.6.1.2.1.2.2.1.8; ifAdminStatus-1.3.6.1.2.1.2.2.1.7] | |
| network.interface.traffic.in | Interface Traffic In | bps | This metric calculates the network interface Octets received on the interface. Raw value from the interface will be captured which comes in bytes and will be converted to bits using the expression.[OID: ifInOctets - 1.3.6.1.2.1.2.2.1.10] | |
| network.interface.traffic.out | Interface Traffic Out | bps | This metric calculates the network interface Octets transmitted on the interface. Raw value from the interface will be captured which comes in bytes and will be converted to bits using the expression.[OID: ifOutOctets - 1.3.6.1.2.1.2.2.1.16] | |
| network.interface.utilization.in | Interface Utilization In | % | This metric calculates the network traffic in utilization. To calculate this,Interface speed is required. Raw interface speed is captured from interface and expression calculates the incoming utilization percentage based on the Traffic in metric.[OID: ifSpeed - 1.3.6.1.2.1.2.2.1.5; ifInOctets - 1.3.6.1.2.1.2.2.1.10] | |
| network.interface.utilization.out | Interface Utilization Out | % | This metric calculates the network traffic out utilization. To calculate this,Interface speed is required. SNMP based Interface speed is considered as input for this expression calculates the outgoing utilization percentage based on the Traffic out metric.[OID: ifSpeed - 1.3.6.1.2.1.2.2.1.5,ifOutOctets - 1.3.6.1.2.1.2.2.1.16] | |
| network.interface.errors.in | Interface Errors In | packet/min | It monitors the number of inbound packets that contained errors preventing them from being deliverable to a higher-layer protocol. Raw values from the interface is captured and the expression converts it to minutes.[OID: ifInErrors - 1.3.6.1.2.1.2.2.1.14] | |
| network.interface.errors.out | Interface Errors Out | packet/min | It monitors the number of outbound packets that could not be transmitted because of errors. Raw values from the interface is captured and the expression converts it to minutes.[OID: ifOutErrors - 1.3.6.1.2.1.2.2.1.20] | |
| network.interface.discards.in | Interface Discards In | packet/min | It monitors the number of inbound packets which were chosen to be discarded even though no errors had been detected to prevent their being deliverable to a higher-layer protocol. One possible reason for discarding such a packet could be to free up buffer space.[OID: ifInDiscards - 1.3.6.1.2.1.2.2.1.13] | |
| network.interface.discards.out | Interface Discards Out | packet/min | It monitors the number of outbound packets which were chosen to be discarded even though no errors had been detected to prevent their being transmitted. One possible reason for discarding such a packet could be to free up buffer space.[OID: ifOutDiscards - 1.3.6.1.2.1.2.2.1.19] |
SNMP Interface - 64-bit Counter - Traffic in Mbps - v3
Description
SNMP Interface - 64-bit Counter - Traffic in Mbps
Prerequisites
No prerequisite
Supported Metric
| Monitor Name | Metric Name | Metric Display Name | Unit | Description |
|---|---|---|---|---|
| SNMP Interface - 64-bit Counter - Traffic in Mbps - v3 | network.interface.utilization.out | Interface Utilization Out | This metric calculates the network traffic out utilization. To calculate this, Interface speed is required. SNMP based Interface speed is considered as input for this expression calculates the outgoing utilization percentage based on the Traffic out metric. [OID: ifHighSpeed - 1.3.6.1.2.1.31.1.1.1.15, ifHCOutOctets - 1.3.6.1.2.1.31.1.1.1.10] | % |
| network.interface.discards.out | Interface Discards Out | It monitors the number of outbound packets which were chosen to be discarded even though no errors had been detected to prevent their being transmitted. One possible reason for discarding such a packet could be to free up buffer space. [OID: ifOutDiscards - 1.3.6.1.2.1.2.2.1.19] | packet/min | |
| network.interface.utilization.in | Interface Utilization In | This metric calculates the network traffic in utilization. To calculate this, Interface speed is required. Raw interface speed is captured from interface and expression calculates the incoming utilization percentage based on the Traffic in metric. [OID: ifHighSpeed - 1.3.6.1.2.1.31.1.1.1.15; ifHCInOctets - 1.3.6.1.2.1.31.1.1.1.6] | % | |
| network_interface_traffic_in_mbps_v3 | Interface Traffic In | This metric calculates the network interface Octets received on the interface. Raw value from the interface will be captured which comes in bytes and will be converted to Mbps using the expression. [OID: ifHCInOctets - 1.3.6.1.2.1.31.1.1.1.6] | Mbps | |
| network_interface_traffic_out_mbps_v3 | Interface Traffic Out | This metric calculates the network interface Octets transmitted on the interface. Raw value from the interface will be captured which comes in bytes and will be converted to Mbps using the expression. [OID: ifHCOutOctets - 1.3.6.1.2.1.31.1.1.1.10] | Mbps | |
| network.interface.status | Interface Status | This metric represents the status of the interface based on the values derived from ifAdminStatus and ifOperStatus. It generates alerts if interface operational status is not in Up or Dormant state even interface admin status is Up. Possible values are : 1 : up , 2 : down , 3 : testing , 4 : unknown , 5 : dormant , 6 : notPresent , 7 : lowerLayerDown.[OID: ifOperStatus-1.3.6.1.2.1.2.2.1.8; ifAdminStatus-1.3.6.1.2.1.2.2.1.7] | ||
| network.interface.errors.in | Interface Errors In | It monitors the number of inbound packets that contained errors preventing them from being deliverable to a higher-layer protocol. Raw values from the interface is captured and the expression converts it to minutes. [OID: ifInErrors - 1.3.6.1.2.1.2.2.1.14] | packet/min | |
| network.interface.errors.out | Interface Errors Out | It monitors the number of outbound packets that could not be transmitted because of errors. Raw values from the interface is captured and the expression converts it to minutes. [OID: ifOutErrors - 1.3.6.1.2.1.2.2.1.20] | packet/min | |
| network.interface.discards.in | Interface Discards In | It monitors the number of inbound packets which were chosen to be discarded even though no errors had been detected to prevent their being deliverable to a higher-layer protocol. One possible reason for discarding such a packet could be to free up buffer space. [OID: ifInDiscards - 1.3.6.1.2.1.2.2.1.13] | packet/min |
| Monitor Name | Metric Name | Metric Display Name | Unit | Description |
|---|---|---|---|---|
| SNMP Interface - 32-bit Counter - Rule based | network.interface.status | Interface Status | This metric represents the status of the interface based on the values derived from ifAdminStatus and ifOperStatus. It generates alerts if interface operational status is not in Up or Dormant state even interface admin status is Up.[OID: ifOperStatus-1.3.6.1.2.1.2.2.1.8; ifAdminStatus-1.3.6.1.2.1.2.2.1.7] | |
| network.interface.traffic.in | Interface Traffic In | bps | This metric calculates the network interface Octets received on the interface. Raw value from the interface will be captured which comes in bytes and will be converted to bits using the expression.[OID: ifInOctets - 1.3.6.1.2.1.2.2.1.10] | |
| network.interface.traffic.out | Interface Traffic Out | bps | This metric calculates the network interface Octets transmitted on the interface. Raw value from the interface will be captured which comes in bytes and will be converted to bits using the expression.[OID: ifOutOctets - 1.3.6.1.2.1.2.2.1.16] | |
| network.interface.utilization.in | Interface Utilization In | % | This metric calculates the network traffic in utilization. To calculate this,Interface speed is required. Raw interface speed is captured from interface and expression calculates the incoming utilization percentage based on the Traffic in metric.[OID: ifSpeed - 1.3.6.1.2.1.2.2.1.5; ifInOctets - 1.3.6.1.2.1.2.2.1.10] | |
| network.interface.utilization.out | Interface Utilization Out | % | This metric calculates the network traffic out utilization. To calculate this,Interface speed is required. SNMP based Interface speed is considered as input for this expression calculates the outgoing utilization percentage based on the Traffic out metric.[OID: ifSpeed - 1.3.6.1.2.1.2.2.1.5,ifOutOctets - 1.3.6.1.2.1.2.2.1.16] | |
| network.interface.errors.in | Interface Errors In | packet/min | It monitors the number of inbound packets that contained errors preventing them from being deliverable to a higher-layer protocol. Raw values from the interface is captured and the expression converts it to minutes.[OID: ifInErrors - 1.3.6.1.2.1.2.2.1.14] | |
| network.interface.errors.out | Interface Errors Out | packet/min | It monitors the number of outbound packets that could not be transmitted because of errors. Raw values from the interface is captured and the expression converts it to minutes.[OID: ifOutErrors - 1.3.6.1.2.1.2.2.1.20] | |
| network.interface.discards.in | Interface Discards In | packet/min | It monitors the number of inbound packets which were chosen to be discarded even though no errors had been detected to prevent their being deliverable to a higher-layer protocol. One possible reason for discarding such a packet could be to free up buffer space.[OID: ifInDiscards - 1.3.6.1.2.1.2.2.1.13] | |
| network.interface.discards.out | Interface Discards Out | packet/min | It monitors the number of outbound packets which were chosen to be discarded even though no errors had been detected to prevent their being transmitted. One possible reason for discarding such a packet could be to free up buffer space.[OID: ifOutDiscards - 1.3.6.1.2.1.2.2.1.19] |
SNMP Interface(All UP) - 32-bit Counter-Rule Based - v2
Description
Monitors the Interface Status,Utilization,Traffic,Errors and Discards Rate. It uses the 32 bit counter oids to monitor Traffic and Utilization. It monitors interfaces that has operational status up.
Prerequisites
No prerequisite
Supported Metric
| Monitor Name | Metric Name | Metric Display Name | Unit | Description |
|---|---|---|---|---|
| SNMP Interface - 32-bit Counter - Rule based - v2 | network.interface.status | Interface Status | This metric represents the status of the interface based on the values derived from ifAdminStatus and ifOperStatus. It generates alerts if interface operational status is not in Up or Dormant state even interface admin status is Up.[OID: ifOperStatus-1.3.6.1.2.1.2.2.1.8; ifAdminStatus-1.3.6.1.2.1.2.2.1.7] | |
| network.interface.traffic.in | Interface Traffic In | bps | This metric calculates the network interface Octets received on the interface. Raw value from the interface will be captured which comes in bytes and will be converted to bits using the expression.[OID: ifInOctets - 1.3.6.1.2.1.2.2.1.10] | |
| network.interface.traffic.out | Interface Traffic Out | bps | This metric calculates the network interface Octets transmitted on the interface. Raw value from the interface will be captured which comes in bytes and will be converted to bits using the expression.[OID: ifOutOctets - 1.3.6.1.2.1.2.2.1.16] | |
| network.interface.utilization.in | Interface Utilization In | % | This metric calculates the network traffic in utilization. To calculate this,Interface speed is required. Raw interface speed is captured from interface and expression calculates the incoming utilization percentage based on the Traffic in metric.[OID: ifSpeed - 1.3.6.1.2.1.2.2.1.5; ifInOctets - 1.3.6.1.2.1.2.2.1.10] | |
| network.interface.utilization.out | Interface Utilization Out | % | This metric calculates the network traffic out utilization. To calculate this,Interface speed is required. SNMP based Interface speed is considered as input for this expression calculates the outgoing utilization percentage based on the Traffic out metric.[OID: ifSpeed - 1.3.6.1.2.1.2.2.1.5,ifOutOctets - 1.3.6.1.2.1.2.2.1.16] | |
| network.interface.errors.in | Interface Errors In | packet/min | It monitors the number of inbound packets that contained errors preventing them from being deliverable to a higher-layer protocol. Raw values from the interface is captured and the expression converts it to minutes.[OID: ifInErrors - 1.3.6.1.2.1.2.2.1.14] | |
| network.interface.errors.out | Interface Errors Out | packet/min | It monitors the number of outbound packets that could not be transmitted because of errors. Raw values from the interface is captured and the expression converts it to minutes.[OID: ifOutErrors - 1.3.6.1.2.1.2.2.1.20] | |
| network.interface.discards.in | Interface Discards In | packet/min | It monitors the number of inbound packets which were chosen to be discarded even though no errors had been detected to prevent their being deliverable to a higher-layer protocol. One possible reason for discarding such a packet could be to free up buffer space.[OID: ifInDiscards - 1.3.6.1.2.1.2.2.1.13] | |
| network.interface.discards.out | Interface Discards Out | packet/min | It monitors the number of outbound packets which were chosen to be discarded even though no errors had been detected to prevent their being transmitted. One possible reason for discarding such a packet could be to free up buffer space.[OID: ifOutDiscards - 1.3.6.1.2.1.2.2.1.19] |
SNMP Interface(All UP) - 32-bit Counter-Rule Based - v3
Description
It monitors the interface status, interface errors in, errors out, discards in, discards out, traffic in, traffic out, utilization in and utilization out. This rule-based template monitors interfaces that are operationally up.
Prerequisites
Device must have support for IF-MIB
Supported Metric
| Monitor Name | Metric Name | Metric Display Name | Unit | Description |
|---|---|---|---|---|
| SNMP Interface - 32-bit Counter - Rule based - v3 | network.interface.status | Interface Status | This metric represents the status of the interface based on the values derived from ifAdminStatus and ifOperStatus. It generates alerts if interface operational status is not in Up or Dormant state even interface admin status is Up. Possible values are : 1 : up , 2 : down , 3 : testing , 4 : unknown , 5 : dormant , 6 : notPresent , 7 : lowerLayerDown.[OID: ifOperStatus-1.3.6.1.2.1.2.2.1.8; ifAdminStatus-1.3.6.1.2.1.2.2.1.7] | |
| network.interface.traffic.in | Interface Traffic In | bps | This metric calculates the network interface Octets received on the interface. Raw value from the interface will be captured which comes in bytes and will be converted to bits using the expression. [OID: ifInOctets - 1.3.6.1.2.1.2.2.1.10] | |
| network.interface.traffic.out | Interface Traffic Out | bps | This metric calculates the network interface Octets transmitted on the interface. Raw value from the interface will be captured which comes in bytes and will be converted to bits using the expression. [OID: ifOutOctets - 1.3.6.1.2.1.2.2.1.16] | |
| network.interface.utilization.in | Interface Utilization In | % | This metric calculates the network traffic in utilization. To calculate this, Interface speed is required. Raw interface speed is captured from interface and expression calculates the incoming utilization percentage based on the Traffic in metric. [OID: ifSpeed - 1.3.6.1.2.1.2.2.1.5; ifInOctets - 1.3.6.1.2.1.2.2.1.10] | |
| network.interface.utilization.out | Interface Utilization Out | % | This metric calculates the network traffic out utilization. To calculate this, Interface speed is required. SNMP based Interface speed is considered as input for this expression calculates the outgoing utilization percentage based on the Traffic out metric. [OID: ifSpeed - 1.3.6.1.2.1.2.2.1.5, ifOutOctets - 1.3.6.1.2.1.2.2.1.16] | |
| network.interface.errors.in | Interface Errors In | packet/min | It monitors the number of inbound packets that contained errors preventing them from being deliverable to a higher-layer protocol. Raw values from the interface is captured and the expression converts it to minutes. [OID: ifInErrors - 1.3.6.1.2.1.2.2.1.14] | |
| network.interface.errors.out | Interface Errors Out | packet/min | It monitors the number of outbound packets that could not be transmitted because of errors. Raw values from the interface is captured and the expression converts it to minutes. [OID: ifOutErrors - 1.3.6.1.2.1.2.2.1.20] | |
| network.interface.discards.in | Interface Discards In | packet/min | It monitors the number of inbound packets which were chosen to be discarded even though no errors had been detected to prevent their being deliverable to a higher-layer protocol. One possible reason for discarding such a packet could be to free up buffer space. [OID: ifInDiscards - 1.3.6.1.2.1.2.2.1.13] | |
| network.interface.discards.out | Interface Discards Out | packet/min | It monitors the number of outbound packets which were chosen to be discarded even though no errors had been detected to prevent their being transmitted. One possible reason for discarding such a packet could be to free up buffer space. [OID: ifOutDiscards - 1.3.6.1.2.1.2.2.1.19] |
SNMP Interface(All UP) - 64-bit Counter-Rule Based
Description
SNMP Interface(All UP) - 64-bit Counter-Rule Based. It monitors interfaces that has operational status up.
Prerequisites
SNMP should be enabled in end device and device should support IF-MIB.mib OIDs and SNMP credentials should be attached against the device in portal.
Supported Metric
| Monitor Name | Metric Name | Metric Display Name | Unit | Description |
|---|---|---|---|---|
| SNMP Interface - 64-bit Counter - Rule based | network.interface.status | Interface Status | None | This metric represents the status of the interface based on the values derived from ifAdminStatus and ifOperStatus. It generates alerts if interface operational status is not in Up or Dormant state even interface admin status is Up.[OID: ifOperStatus-1.3.6.1.2.1.2.2.1.8; ifAdminStatus-1.3.6.1.2.1.2.2.1.7] |
| network.interface.traffic.in | Interface Traffic In | bps | This metric calculates the network interface Octets received on the interface. Raw value from the interface will be captured which comes in bytes and will be converted to bits using the expression.[OID: ifHCInOctets - 1.3.6.1.2.1.31.1.1.1.6] | |
| network.interface.traffic.out | Interface Traffic Out | bps | This metric calculates the network interface Octets transmitted on the interface. Raw value from the interface will be captured which comes in bytes and will be converted to bits using the expression.[OID: ifHCOutOctets - 1.3.6.1.2.1.31.1.1.1.10] | |
| network.interface.utilization.in | Interface Utilization In | % | This metric calculates the network traffic in utilization. To calculate this,Interface speed is required. Raw interface speed is captured from interface and expression calculates the incoming utilization percentage based on the Traffic in metric.[OID: ifHighSpeed - 1.3.6.1.2.1.31.1.1.1.15; ifHCInOctets - 1.3.6.1.2.1.31.1.1.1.6] | |
| network.interface.utilization.out | Interface Utilization Out | % | This metric calculates the network traffic out utilization. To calculate this,Interface speed is required. SNMP based Interface speed is considered as input for this expression calculates the outgoing utilization percentage based on the Traffic out metric.[OID: ifHighSpeed - 1.3.6.1.2.1.31.1.1.1.15,ifHCOutOctets - 1.3.6.1.2.1.31.1.1.1.10] | |
| network.interface.errors.in | Interface Errors In | packet/min | It monitors the number of inbound packets that contained errors preventing them from being deliverable to a higher-layer protocol. Raw values from the interface is captured and the expression converts it to minutes.[OID: ifInErrors - 1.3.6.1.2.1.2.2.1.14] | |
| network.interface.errors.out | Interface Errors Out | packet/min | It monitors the number of outbound packets that could not be transmitted because of errors. Raw values from the interface is captured and the expression converts it to minutes.[OID: ifOutErrors - 1.3.6.1.2.1.2.2.1.20] | |
| network.interface.discards.in | Interface Discards In | packet/min | It monitors the number of inbound packets which were chosen to be discarded even though no errors had been detected to prevent their being deliverable to a higher-layer protocol. One possible reason for discarding such a packet could be to free up buffer space.[OID: ifInDiscards - 1.3.6.1.2.1.2.2.1.13] | |
| network.interface.discards.out | Interface Discards Out | packet/min | It monitors the number of outbound packets which were chosen to be discarded even though no errors had been detected to prevent their being transmitted. One possible reason for discarding such a packet could be to free up buffer space.[OID: ifOutDiscards - 1.3.6.1.2.1.2.2.1.19] |
SNMP Interface(All UP) - 64-bit Counter-Rule Based - v2
Description
SNMP Interface(All UP) - 64-bit Counter-Rule Based. It monitors interfaces that has operational status up.
Prerequisites
No prerequisite
Supported Metric
| Monitor Name | Metric Name | Metric Display Name | Unit | Description |
|---|---|---|---|---|
| SNMP Interface - 64-bit Counter - Rule based - v2 | network.interface.status | Interface Status | None | This metric represents the status of the interface based on the values derived from ifAdminStatus and ifOperStatus. It generates alerts if interface operational status is not in Up or Dormant state even interface admin status is Up.[OID: ifOperStatus-1.3.6.1.2.1.2.2.1.8; ifAdminStatus-1.3.6.1.2.1.2.2.1.7] |
| network.interface.traffic.in | Interface Traffic In | bps | This metric calculates the network interface Octets received on the interface. Raw value from the interface will be captured which comes in bytes and will be converted to bits using the expression.[OID: ifHCInOctets - 1.3.6.1.2.1.31.1.1.1.6] | |
| network.interface.traffic.out | Interface Traffic Out | bps | This metric calculates the network interface Octets transmitted on the interface. Raw value from the interface will be captured which comes in bytes and will be converted to bits using the expression.[OID: ifHCOutOctets - 1.3.6.1.2.1.31.1.1.1.10] | |
| network.interface.utilization.in | Interface Utilization In | % | This metric calculates the network traffic in utilization. To calculate this,Interface speed is required. Raw interface speed is captured from interface and expression calculates the incoming utilization percentage based on the Traffic in metric.[OID: ifHighSpeed - 1.3.6.1.2.1.31.1.1.1.15; ifHCInOctets - 1.3.6.1.2.1.31.1.1.1.6] | |
| network.interface.utilization.out | Interface Utilization Out | % | This metric calculates the network traffic out utilization. To calculate this,Interface speed is required. SNMP based Interface speed is considered as input for this expression calculates the outgoing utilization percentage based on the Traffic out metric.[OID: ifHighSpeed - 1.3.6.1.2.1.31.1.1.1.15,ifHCOutOctets - 1.3.6.1.2.1.31.1.1.1.10] | |
| network.interface.errors.in | Interface Errors In | packet/min | It monitors the number of inbound packets that contained errors preventing them from being deliverable to a higher-layer protocol. Raw values from the interface is captured and the expression converts it to minutes.[OID: ifInErrors - 1.3.6.1.2.1.2.2.1.14] | |
| network.interface.errors.out | Interface Errors Out | packet/min | It monitors the number of outbound packets that could not be transmitted because of errors. Raw values from the interface is captured and the expression converts it to minutes.[OID: ifOutErrors - 1.3.6.1.2.1.2.2.1.20] | |
| network.interface.discards.in | Interface Discards In | packet/min | It monitors the number of inbound packets which were chosen to be discarded even though no errors had been detected to prevent their being deliverable to a higher-layer protocol. One possible reason for discarding such a packet could be to free up buffer space.[OID: ifInDiscards - 1.3.6.1.2.1.2.2.1.13] | |
| network.interface.discards.out | Interface Discards Out | packet/min | It monitors the number of outbound packets which were chosen to be discarded even though no errors had been detected to prevent their being transmitted. One possible reason for discarding such a packet could be to free up buffer space.[OID: ifOutDiscards - 1.3.6.1.2.1.2.2.1.19] |
SNMP Interface (All UP) - 64-bit Counter-Rule Based - v3
Description
It monitors the interface status, interface errors in, errors out, discards in, discards out, traffic in, traffic out, utilization in and utilization out. This rule-based template monitors interfaces that are operationally up.
Prerequisites
Device must have support for IF-MIB
Supported Metric
| Monitor Name | Metric Name | Metric Display Name | Unit | Description |
|---|---|---|---|---|
| SNMP Interface - 64-bit Counter - Rule based - v3 | network.interface.status | Interface Status | None | This metric represents the status of the interface based on the values derived from ifAdminStatus and ifOperStatus. It generates alerts if interface operational status is not in Up or Dormant state even interface admin status is Up. Possible values are : 1 : up , 2 : down , 3 : testing , 4 : unknown , 5 : dormant , 6 : notPresent , 7 : lowerLayerDown.[OID: ifOperStatus-1.3.6.1.2.1.2.2.1.8; ifAdminStatus-1.3.6.1.2.1.2.2.1.7] |
| network.interface.traffic.in | Interface Traffic In | bps | This metric calculates the network interface Octets received on the interface. Raw value from the interface will be captured which comes in bytes and will be converted to bits using the expression.[OID: ifHCInOctets - 1.3.6.1.2.1.31.1.1.1.6] | |
| network.interface.traffic.out | Interface Traffic Out | bps | This metric calculates the network interface Octets transmitted on the interface. Raw value from the interface will be captured which comes in bytes and will be converted to bits using the expression.[OID: ifHCOutOctets - 1.3.6.1.2.1.31.1.1.1.10] | |
| network.interface.utilization.in | Interface Utilization In | % | This metric calculates the network traffic in utilization. To calculate this,Interface speed is required. Raw interface speed is captured from interface and expression calculates the incoming utilization percentage based on the Traffic in metric.[OID: ifHighSpeed - 1.3.6.1.2.1.31.1.1.1.15; ifHCInOctets - 1.3.6.1.2.1.31.1.1.1.6] | |
| network.interface.utilization.out | Interface Utilization Out | % | This metric calculates the network traffic out utilization. To calculate this,Interface speed is required. SNMP based Interface speed is considered as input for this expression calculates the outgoing utilization percentage based on the Traffic out metric.[OID: ifHighSpeed - 1.3.6.1.2.1.31.1.1.1.15,ifHCOutOctets - 1.3.6.1.2.1.31.1.1.1.10] | |
| network.interface.errors.in | Interface Errors In | packet/min | It monitors the number of inbound packets that contained errors preventing them from being deliverable to a higher-layer protocol. Raw values from the interface is captured and the expression converts it to minutes.[OID: ifInErrors - 1.3.6.1.2.1.2.2.1.14] | |
| network.interface.errors.out | Interface Errors Out | packet/min | It monitors the number of outbound packets that could not be transmitted because of errors. Raw values from the interface is captured and the expression converts it to minutes.[OID: ifOutErrors - 1.3.6.1.2.1.2.2.1.20] | |
| network.interface.discards.in | Interface Discards In | packet/min | It monitors the number of inbound packets which were chosen to be discarded even though no errors had been detected to prevent their being deliverable to a higher-layer protocol. One possible reason for discarding such a packet could be to free up buffer space.[OID: ifInDiscards - 1.3.6.1.2.1.2.2.1.13] | |
| network.interface.discards.out | Interface Discards Out | packet/min | It monitors the number of outbound packets which were chosen to be discarded even though no errors had been detected to prevent their being transmitted. One possible reason for discarding such a packet could be to free up buffer space.[OID: ifOutDiscards - 1.3.6.1.2.1.2.2.1.19] |
Solaris Performance Monitoring
Description
Solaris Basic Monitoring Template
Prerequisites
No prerequisite
Supported Metric
| Monitor Name | Metric Name | Metric Display Name | Unit | Description |
|---|---|---|---|---|
| Solaris Basic Monitoring Template | Solaris_Process_Count | Solaris Process Count | NULL | |
| Solaris_CPU_Usage | Solaris CPU Usage | % | ||
| Solaris_Pag_IN_OUT | Solaris Paging | MB | ||
| Solaris_Memory_Metric | Solaris Memory | MB | Solaris_Memory |
Solaris ZFS Storage Pool Health and Capacity
Description
Monitors Solaris ZFS Storage Pool health status and usage capacity in percentage. [NET-SNMP-EXTEND-MIB::nsExtendOutLine-1.3.6.1.4.1.8072.1.3.2.4.1.2] [Prerequisites: Need to add following Zpool command to snmpd.conf in end device: extend zpool_name /bin/bash -c “zpool list -H -o name” extend zpool_capacity /bin/bash -c “zpool list -H -o capacity” extend zpool_health /bin/bash -c “zpool list -H -o health”]
Prerequisites
No prerequisite
Supported Metric
| Monitor Name | Metric Name | Metric Display Name | Unit | Description |
|---|---|---|---|---|
| Solaris ZFS Storage Pool Health and Capacity | solaris.zfs.storage.pool.health.status | ZFS Storage Pool Health Status | It represents the Solaris ZFS Storage pool health status. A pool's health status is described by one of following states:\nDEGRADED: A pool with one or more failed devices, but the data is still available due to a redundant configuration.\nONLINE: A pool that has all devices operating normally.\nSUSPENDED: A pool that is waiting for device connectivity to be restored. A suspended pool remains in the wait state until the device issue is resolved.\nUNAVAIL: A pool with corrupted metadata, or one or more unavailable devices and insufficient replicas to continue functioning.\nUNKNOWN: A pool is not imported and its actual status has not been verified. This health status is used by zpool label command.\nCLEARED: A pool has at least one device with ZFS metadata cleared by using zpool label -C command. A cleared pool cannot be imported. [NET-SNMP-EXTEND-MIB::nsExtendOutLine-1.3.6.1.4.1.8072.1.3.2.4.1.2] | |
| solaris.zfs.storage.pool.capacity | ZFS Storage Pool Capcacity | % | It represents the amount of disk space used, expressed as a percentage of the total disk space. [NET-SNMP-EXTEND-MIB::nsExtendOutLine-1.3.6.1.4.1.8072.1.3.2.4.1.2] |
Sun Hardware Monitors
Description
Monitors the hardware sensors aggregated alarm status (such like FRU status, Agent and SP connection status, voltage, current, power supply, cooling unit, temperature, processors, memory, hard drives, IO, slots, power unit, power consumption, indicator) and power consumption information related to the Oracle server or blade.\n[using SUN-HW-MONITORING-MIB]
Prerequisites
No prerequisite
Supported Metric
| Monitor Name | Metric Name | Metric Display Name | Unit | Description |
|---|---|---|---|---|
| Sun Hardware FRU Alarm status | sun.hw.fru.alarmstatus | FRU Alarm Status | Monitors the alarm status of the Oracle server's FRU. [OID: 1.3.6.1.4.1.42.2.2.6.1.1.6.1.1.8] | |
| Sun Hardware Monitoring agent and SP Connection Status | sun.hw.agent.sp.connectionstatus | Agent and Service Processor (ILOM) Connection Status | Monitors the status of the connection between Oracle hardware monitoring agent and the Service Processor (ILOM). [OID: 1.3.6.1.4.1.42.2.2.6.1.1.5.2.0, 1.3.6.1.4.1.42.2.2.6.1.1.5.1.0] | |
| Sun Hardware Sensors Aggregate Alarm Status | sun.hw.cumulative.sensors.alarmstatus | Cumulative Status of all Sensors | This attribute defines the cumulative status of all sensors monitoring various parameters on a Oracle server. [OID: 1.3.6.1.4.1.42.2.2.6.1.1.7.1.1.0] | |
| sun.hw.cumulative.voltagesensors.alarmstatus | Voltage Sensors Cumulative Status | This attribute defines the cumulative status of all sensors monitoring voltage on a Oracle server. [OID: 1.3.6.1.4.1.42.2.2.6.1.1.7.1.2.0] | ||
| sun.hw.cumulative.currentsensors.alarmstatus | Electric Current Sensors Cumulative Status | This attribute defines the cumulative status of all sensors monitoring electric current on a Oracle server. [OID: 1.3.6.1.4.1.42.2.2.6.1.1.7.1.3.0] | ||
| sun.hw.cumulative.powersupplysensors.alarmstatus | Power Supplies Cumulative Status | This attribute defines the cumulative status of all sensors monitoring power supplies on a Oracle server. [OID: 1.3.6.1.4.1.42.2.2.6.1.1.7.1.4.0] | ||
| sun.hw.cumulative.coolingunits.alarmstatus | Cooling Units Cumulative Status | This attribute defines the cumulative status of all cooling units on a Oracle server. [OID: 1.3.6.1.4.1.42.2.2.6.1.1.7.1.5.0] | ||
| sun.hw.cumulative.temperaturesensors.alarmstatus | Temperature Sensors Cumulative Status | This attribute defines the cumulative status of all sensors monitoring temperature on a Oracle server. [OID: 1.3.6.1.4.1.42.2.2.6.1.1.7.1.6.0] | ||
| sun.hw.cumulative.processors.alarmstatus | Processors Cumilative Status | This attribute defines the cumulative status of all processors on a Oracle server [OID: 1.3.6.1.4.1.42.2.2.6.1.1.7.1.7.0] | ||
| sun.hw.cumulative.memory.alarmstatus | Memory Devices Cumulative Status | This attribute defines the cumulative status of all memory devices on a Oracle server. [OID: 1.3.6.1.4.1.42.2.2.6.1.1.7.1.8.0] | ||
| sun.hw.cumulative.harddrives.alarmstatus | Hard Drives Cumulative Status | This attribute defines the cumulative status of all hard drives on a Oracle server. [OID: 1.3.6.1.4.1.42.2.2.6.1.1.7.1.9.0] | ||
| sun.hw.cumulative.io.sensors.alarmstatus | IO Sensors Cumulative Status | This attribute defines the cumulative status of all IO sensors on a Oracle server. [OID: 1.3.6.1.4.1.42.2.2.6.1.1.7.1.10.0] | ||
| sun.hw.cumulative.slots.alarmstatus | Slots / Connections Cumulative Status | This attribute defines the cumulative status of all slots or connectors on a Oracle server. [OID: 1.3.6.1.4.1.42.2.2.6.1.1.7.1.11.0] | ||
| sun.hw.cumulative.uncategorisedsensors.alarmstatus | Uncategorised Sensors Cumulative Status | This attribute defines the cumulative status of all sensors that do not fall into any defined category in sunHwMonOtherSensorsGroup. [OID: 1.3.6.1.4.1.42.2.2.6.1.1.7.1.12.0] | ||
| sun.hw.cumulative.powerunitsensors.alarmstatus | Power Unit Sensors Cumulative Status | This attribute defines the cumulative status of Power Unit sensors on an Oracle server. [OID: 1.3.6.1.4.1.42.2.2.6.1.1.7.1.13.0] | ||
| Sun Hardware Total Power Consumption | sun.hw.total.powerconsumptionsensors.alarmstatus | Power Consumption Sensors Alarm Status | It represents the status of the total power consumption sensor. [OID: 1.3.6.1.4.1.42.2.2.6.1.1.9.1.0, 1.3.6.1.4.1.42.2.2.6.1.1.9.4.0, 1.3.6.1.4.1.42.2.2.6.1.1.9.5.0] | |
| sun.hw.total.powerconsumptionsensors.currvalue | Power Consumption Sensors Current Value | This attribute defines the current reading of the total power consumption sensor. [OIDs: 1.3.6.1.4.1.42.2.2.6.1.1.9.6.0, 1.3.6.1.4.1.42.2.2.6.1.1.9.7.0] |
Sun Storage Monitors
Description
It monitors the storage parameters like Raid controller status, controller alarm status, disk status, physical disk status and logical component Raid status [Using SUN-STORAGE-MIB].
Prerequisites
No prerequisite
Supported Metric
| Monitor Name | Metric Name | Metric Display Name | Unit | Description |
|---|---|---|---|---|
| Sun Storage Controller Status | sun.storage.controller.status | Storage Controller Status | This attribute defines the operational status of the RAID controller. [OID: 1.3.6.1.4.1.42.2.2.6.2.1.3.1.19] | |
| sun.storage.controller.alarmstatus | Storage Controller Alarm Status | The alarm status of the controller. [OID: 1.3.6.1.4.1.42.2.2.6.2.1.3.1.20] | ||
| Sun Storage Disk Status | sun.storage.disk.status | Disk Status | This attribute defines the raid group-status of disk. [OID: 1.3.6.1.4.1.42.2.2.6.2.1.4.1.16] | |
| Sun Storage Logical Component RAID Status | sun.storage.logical.comp.raidstatus | Logical Component RAID Status | The status of this disk within the RAID configuration. One of:
| |
| Sun Storage Volume RAID Status | sun.storage.volume.raidstatus | Volume RAID Status | The status of the physical disk as a RAID member. This field is a mirror of the same field in the Logical Component node. [OIDs: 1.3.6.1.4.1.42.2.2.6.2.1.5.1.2, 1.3.6.1.4.1.42.2.2.6.2.1.5.1.21] |
Synology - Storage and Space IO Statistics
Description
Template to monitor Storage and Space IO Statistics like bytes read, bytes written, reads, writes, disk load, 1min avg disk load, 5min avg disk load, 15min avg disk load. [SYNOLOGY-STORAGEIO-MIB, SYNOLOGY-SPACEIO-MIB].
Prerequisites
No prerequisite
Supported Metric
| Monitor Name | Metric Name | Metric Display Name | Unit | Description |
|---|---|---|---|---|
| Synology Space IO Statistics | synology.space.io.5min.avg.disk.load | Space IO Average Disk Load - 5min | % | It monitors the 5 minutes average load of disk (%). [SYNOLOGY-SPACEIO-MIB::spaceIOLA5 - 1.3.6.1.4.1.6574.102.1.1.10]. |
| synology.space.io.disk.load | Space IO Disk Load | % | It monitors the load of disk (%). [SYNOLOGY-SPACEIO-MIB::spaceIOLA - 1.3.6.1.4.1.6574.102.1.1.8]. | |
| synology.space.io.15min.avg.disk.load | Space IO Average Disk Load - 15min | % | It monitors the 15 minutes average load of disk (%). [SYNOLOGY-SPACEIO-MIB::spaceIOLA15 - 1.3.6.1.4.1.6574.102.1.1.11]. | |
| synology.space.io.bytes.written | Space IO Bytes Written | Bps | It monitors the number of bytes written to the device in last monitoring poll period. [SYNOLOGY-SPACEIO-MIB::spaceIONWritten - 1.3.6.1.4.1.6574.102.1.1.4]. | |
| synology.space.io.1min.avg.disk.load | Space IO Average Disk Load - 1min | % | It monitors the 1 minute average load of disk (%). [SYNOLOGY-SPACEIO-MIB::spaceIOLA1 - 1.3.6.1.4.1.6574.102.1.1.9]. | |
| synology.space.io.bytes.read | Space IO Bytes Read | Bps | It monitors the number of bytes read from the device in last monitoring poll period. [SYNOLOGY-SPACEIO-MIB::spaceIONRead - 1.3.6.1.4.1.6574.102.1.1.3]. | |
| synology.space.io.writes | Space IO Writes | counts/s | It monitors the number of write accesses to the device in last monitoring poll period. [SYNOLOGY-SPACEIO-MIB::spaceIOWrites - 1.3.6.1.4.1.6574.102.1.1.6]. | |
| synology.space.io.reads | Space IO Reads | counts/s | It monitors the number of read accesses from the device in last monitoring poll period. [SYNOLOGY-SPACEIO-MIB::spaceIOReads - 1.3.6.1.4.1.6574.102.1.1.5]. | |
| Synology Storage IO Statistics | synology.storage.io.15min.avg.disk.load | Storage IO Avg Disk Load - 15min | % | It monitors the 15 minute average load of disk (%). [SYNOLOGY-STORAGEIO-MIB::storageIOLA15 - 1.3.6.1.4.1.6574.101.1.1.11]. |
| synology.storage.io.1min.avg.disk.load | Storage IO Avg Disk Load - 1min | % | It monitors the 1 minute average load of disk (%). [SYNOLOGY-STORAGEIO-MIB::storageIOLA1 - 1.3.6.1.4.1.6574.101.1.1.9]. | |
| synology.storage.io.writes | Storage IO Writes | counts/s | It monitors the number of write accesses to the device in last monitoring poll period. [SYNOLOGY-STORAGEIO-MIB::storageIOWrites - 1.3.6.1.4.1.6574.101.1.1.6]. | |
| synology.storage.io.bytes.written | Storage IO Bytes Written | Bps | It monitors the number of bytes written to the device in last monitoring poll period.[SYNOLOGY-STORAGEIO-MIB::storageIONWritten - 1.3.6.1.4.1.6574.101.1.1.4]. | |
| synology.storage.io.reads | Storage IO Reads | counts/s | It monitors the number of read accesses from the device in last monitoring poll period. [SYNOLOGY-STORAGEIO-MIB::storageIOReads - 1.3.6.1.4.1.6574.101.1.1.5]. | |
| synology.storage.io.bytes.read | Storage IO Bytes Read | Bps | It monitors the number of bytes read from the device in last monitoring poll period.[SYNOLOGY-STORAGEIO-MIB::storageIONRead - 1.3.6.1.4.1.6574.101.1.1.3]. | |
| synology.storage.io.5min.avg.disk.load | Storage IO Avg Disk Load - 5min | % | It monitors the 5 minutes average load of disk (%). [SYNOLOGY-STORAGEIO-MIB::storageIOLA5 - 1.3.6.1.4.1.6574.101.1.1.10]. | |
| synology.storage.io.disk.load | Storage IO Disk Load | % | It monitors the load of disk (%). [SYNOLOGY-STORAGEIO-MIB::storageIOLA - 1.3.6.1.4.1.6574.101.1.1.8]. |
Synology DSM Monitors
Monitors the Synology System Status, Power Status, System Temperature, System Fan Status, CPU Fan Status, Disk Status, Disk Temperature, and Raid Status.
Description
Validated on Synology DSM 5.2-5592 version and RS3614xs+ model devices. Monitors the Synology System Status, Power Status, System Temperature, System Fan Status, CPU Fan Status, Disk Status, Disk Temperature, and Raid Status. Using SYNOLOGY-DISK-MIB, SYNOLOGY-SYSTEM-MIB, SYNOLOGY-RAID-MIB.
Prerequisites
No prerequisite.
Supported Metric
| Monitor Name | Metric Name | Metric Display Name | Unit | Description |
|---|---|---|---|---|
| Synology Disk Health | synology.disk.status | Synology Disk Status | Provides the Synology disk status. | |
| synology.disk.temperature | Synology Disk Temperature | C | Provides the Synology disk temperature. | |
| Synology Raid Status | synology.raid.status | Synology Raid Status | Provides the Synology RAID status. | |
| Synology System Health | synology.system.status | Synology System Status | Provides the Synology system status. | |
| synology.system.temperature | Synology System Temperature | C | Provides the Synology temperature. | |
| synology.power.status | Synology Power Status | Provides the Synology power status. | ||
| synology.system.fan.status | Synology System Fan Status | Provides the Synology system fan status. | ||
| synology.cpu.fan.status | Synology CPU Fan Status | Provides the Synology CPU fan status. | ||
| synology.dsm.upgrade.available | Synology DSM Upgrade Available | Provides the Synology DSM upgrade availability status. |
System Application Status - SYSAPPL-MIB
Description
It monitors the current state of the running application instance. The possible values are running(1),runnable(2) but waiting for a resource such as CPU,waiting(3) for an event,exiting(4),or other(5). This value is based on an evaluation of the running elements of this application instance (see sysApplElmRunState) and their Roles as defined by sysApplInstallElmtRole. An agent implementation may detect that an application instance is in the process of exiting if one or more of its REQUIRED elements are no longer running. Most agent implementations will wait until a second internal poll has been completed to give the system time to start REQUIRED elements before marking the application instance as exiting.[SYSAPPL-MIB::sysApplInstallPkgProductName 1.3.6.1.2.1.54.1.1.1.1.3,sysApplRunCurrentState 1.3.6.1.2.1.54.1.2.1.1.3]
Prerequisites
Device should support SYSAPPL-MIB,sysApplInstallPkgProductName,1.3.6.1.2.1.54.1.1.1.1.3,sysApplRunCurrentState,1.3.6.1.2.1.54.1.2.1.1.3
Supported Metric
| Monitor Name | Metric Name | Metric Display Name | Unit | Description |
|---|---|---|---|---|
| System Application Status - SYSAPPL-MIB | system.app.current.state | System App Current State | It monitors the current state of the running application instance. The possible values are running(1),runnable(2) but waiting for a resource such as CPU,waiting(3) for an event,exiting(4),or other(5). This value is based on an evaluation of the running elements of this application instance (see sysApplElmRunState) and their Roles as defined by sysApplInstallElmtRole. An agent implementation may detect that an application instance is in the process of exiting if one or more of its REQUIRED elements are no longer running. Most agent implementations will wait until a second internal poll has been completed to give the system time to start REQUIRED elements before marking the application instance as exiting.[SYSAPPL-MIB::sysApplInstallPkgProductName 1.3.6.1.2.1.54.1.1.1.1.3,sysApplRunCurrentState 1.3.6.1.2.1.54.1.2.1.1.3] |
System Health - Host Resource MIB
Description
This template can be applied on any SNMP enabled device that support the HOST-RESOURCES-MIB. This includes Linux,Windows and other device types. Monitors system uptime,CPU utilization,memory utilization and disk utilization.
Prerequisites
No prerequisite
Supported Metric
| Monitor Name | Metric Name | Metric Display Name | Unit | Description |
|---|---|---|---|---|
| CPU Utilization - HR-MIB | system.cpu.utilization | CPU Utilization | % | The average,over the last minute,of the percentage of time that this processor was not idle.[OIDs: 1.3.6.1.2.1.25.3.3.1.2,1.3.6.1.2.1.25.3.2.1.3] |
| Host System Uptime | system.uptime | System Uptime | s | The amount of time since this host was last initialized.[OID - 1.3.6.1.2.1.25.1.1.0] |
| Memory Utilization - HR-MIB | system.memory.util.percent | Memory Utilization | % | This monitor provides physical and virtual memory utilization using HOST-RESOURCES-MIB.[OID: 1.3.6.1.2.1.25.2.3.1.5,1.3.6.1.2.1.25.2.3.1.6,1.3.6.1.2.1.25.2.3.1.4] |
| system.memory.free | Memory Free | Bytes | Represents the free system memory.[OID: 1.3.6.1.2.1.25.2.3.1.5,1.3.6.1.2.1.25.2.3.1.6,1.3.6.1.2.1.25.2.3.1.4] | |
| system.memory.used | Memory Used | Bytes | Represents the amount of memory allocated.[OID: 1.3.6.1.2.1.25.2.3.1.6] | |
| Server Statistics - HR-MIB | system.active.connections | Active Connections | The number of user sessions for which this host is storing state information. A session is a collection of processes requiring a single act of user authentication and possibly subject to collective job control.[OID: 1.3.6.1.2.1.25.1.5.0] | |
| Storage Utilization - HR-MIB | system.disk.util.percent | Disk Utilization | % | Monitors the disk utilization.[OIDs: 1.3.6.1.2.1.25.2.3.1.4,1.3.6.1.2.1.25.2.3.1.5,1.3.6.1.2.1.25.2.3.1.6] |
| CPU Load - UCD-SNMP-MIB | unix.cpu.total Note: The metric unix.cpu.total acts as an intermediate measure used to calculate other CPU parameters such as CPU Nice Time,CPU Idle Time,and more. It doesn't generate any metric data on its own. | CPU Total Time | s | Sum of CPU Time in all modes.[OIDs: 1.3.6.1.4.1.2021.11.50.0,1.3.6.1.4.1.2021.11.51.0,1.3.6.1.4.1.2021.11.52.0,1.3.6.1.4.1.2021.11.53.0,1.3.6.1.4.1.2021.11.54.0,1.3.6.1.4.1.2021.11.55.0,1.3.6.1.4.1.2021.11.56.0]. |
System Uptime
Description
NEW engine monitor for SYSTEM UPTIME.
Prerequisites
NULL
Supported Metric
| Monitor Name | Metric Name | Metric Display Name | Unit | Description |
|---|---|---|---|---|
| System Uptime | system.uptime | System Uptime | s | The time since the SNMP agent in the system was last re-initialized.[OID : 1.3.6.1.2.1.1.3.0] |
Trend Micro TippingPoint
Description
Template to monitor Trend Micro TippingPoint paramaters like fan speed ,fan severity, resource parameters like Host processor Memory Utilization, Host Processor CPU Busy, Chassis Temperature,Resource File System Used, Resource Power Supply Status, Slot Status, temperature value, temperature severity,Voltage and voltage severity. sysobjid : 1.3.6.1.4.1.10734.1.3.52
Prerequisites
No prerequisite
Supported Metric
| Monitor Name | Metric Name | Metric Display Name | Unit | Description |
|---|---|---|---|---|
| Trend Micro TippingPoint - Fan | tpt.fan.speed | Fan Speed | rpm | It monitors the speed of this fan in RPM. |
| tpt.fan.severity | Fan Severity | It monitors whether this fan speed is normal or too slow. | ||
| Trend Micro TippingPoint - Resource | tpt.resource.chassis.temperature | Resource Chassis Temperature | Celsius | It monitors the chassis temperature in degrees C. |
| tpt.resource.host.processor.cpu.busy.percentage | Resource Host Processor CPU Busy | % | It monitors the percentage of host processor CPU busy. | |
| tpt.resource.host.processor.memory.util | Resource Host Processor Memory Utilization | % | It monitors the percentage of host processor memory in use. | |
| Trend Micro TippingPoint - Resource File System Used | tpt.resource.file.system.used | Resource File System Used | MB | It monitors the resource file system usage in MB. |
| Trend Micro TippingPoint - Resource Power Supply Status | tpt.resource.power.supply.status | Resource Power Supply Status | It monitors whether one or both power supplies is functional. | |
| Trend Micro TippingPoint - Slot Status | tpt.slot.status | Slot Status | It monitors the status of the slot. | |
| Trend Micro TippingPoint - Temperature | tpt.temperature.severity | Temperature Severity | It monitors whether this temperature is normal or too hot. | |
| tpt.temperature.value | Temperature | C | It monitors the temperature in degrees centigrade at this sensor. | |
| Trend Micro TippingPoint - Voltage | tpt.voltage.severity | Voltage Severity | It monitors whether this voltage is within the normal operating range or not. | |
| tpt.voltage.value | Voltage | mV | It monitors the voltage reading in millivolts at this sensor. |
UCD Disk IO Monitors
Description
Template for UCD Disk IO monitors. Monitors disk IO percentage in last 5 minutes and 15 minutes, total disk read and write accesses, total disk read and write bytes. Tested on Isilon OneFS isi-demo-1 v7.0.1.1 Isilon OneFS v7.0.1.1 B_7_0_1_34(RELEASE) amd64.
Prerequisites
No prerequisite
Supported Metric
| Monitor Name | Metric Name | Metric Display Name | Unit | Description |
|---|---|---|---|---|
| Disk IO Stats - UCD-DISKIO-MIB | ucd.disk.io.read.accesses | Disk IO Read Accesses | psec | Monitors the number of disk IO read accesses per second. [OIDs: 1.3.6.1.4.1.2021.13.15.1.1.2, 1.3.6.1.4.1.2021.13.15.1.1.5] |
| ucd.disk.io.write.accesses | Disk IO Write Accesses | psec | Monitors the number of disk IO write accesses per second. [OIDs: 1.3.6.1.4.1.2021.13.15.1.1.2, 1.3.6.1.4.1.2021.13.15.1.1.6] | |
| ucd.disk.io.readwrite.accesses | Disk IO Read Write Accesses | psec | Monitors the number of disk IO read and write accesses per second (read accesses + write accesses). | |
| ucd.disk.io.total.bytes | Disk IO Total Bytes | Bps | Monitors the disk IO total (read + write) number of bytes per second. | |
| ucd.disk.io.read.bytes | Disk IO Read Bytes | Bps | Monitors the number of bytes read per second from disk IO device. [OID: 1.3.6.1.4.1.2021.13.15.1.1.12] | |
| ucd.disk.io.write.bytes | Disk IO Written Bytes | Bps | Monitors the number of bytes written per second to disk IO device. [OID: 1.3.6.1.4.1.2021.13.15.1.1.13] | |
| ucd.disk.io.app.load.avg.5 | Disk IO Last 5m Average Load (%) | % | Monitors the 5 minute average load of disk (%). [OID: 1.3.6.1.4.1.2021.13.15.1.1.10] | |
| ucd.disk.io.app.load.avg.15 | Disk IO Last 15m Average Load (%) | % | Monitors the 15 minute average load of disk (%). [OID: 1.3.6.1.4.1.2021.13.15.1.1.11] |
URL Status
Description
Monitors the given URL on the device. Supported metrics Http response code, Response time(ms), URL reachable or not(1:UP, 0:Down). Note: Only one URL on the device can be monitored.
Prerequisites
No prerequisite
Supported Metric
| Monitor Name | Metric Name | Metric Display Name | Unit | Description |
|---|---|---|---|---|
| URL Status | url.http.response-code | URL HTTP response code | NULL | HTTP response code |
| url.response-time | URL response time | ms | URL response time | |
| url.status | URL Up Down status | NULL | URL Up Down status |
Vertiv Geist Watchdog Environmental Sensors
Description
It Monitor Vertiv Geist Watchdog Internal Sensors like Temperature, Humidity, DewPoint and Device availability.[VERTIV-BB-MIB :: internalLabel : 1.3.6.1.4.1.21239.5.1.2.1.3 , internalAvail : 1.3.6.1.4.1.21239.5.1.2.1.4 , internalTemp : 1.3.6.1.4.1.21239.5.1.2.1.5 , internalHumidity : 1.3.6.1.4.1.21239.5.1.2.1.6 , internalDewPoint : 1.3.6.1.4.1.21239.5.1.2.1.7 , temperatureUnits : 1.3.6.1.4.1.21239.5.1.1.7]
Prerequisites
Device should support VERTIV-BB-MIB
Supported Metric
| Monitor Name | Metric Name | Metric Display Name | Unit | Description |
|---|---|---|---|---|
| Vertiv Geist Watchdog - Internal Sensors | vertiv_geist_watchdog_InternalAvail | Vertiv Geist Watchdog Device availability | It monitor internal device availability [VERTIV-BB-MIB :: internalLabel : 1.3.6.1.4.1.21239.5.1.2.1.3 , internalAvail : 1.3.6.1.4.1.21239.5.1.2.1.4] possible values are 0 : Unavailable, 1 : Available, 2 : Partially Unavailable | |
| vertiv_geist_watchdog_InternalTemp | Vertiv Geist Watchdog Internal Temperature | Centigrade | It monitor internal temperature [VERTIV-BB-MIB :: internalLabel : 1.3.6.1.4.1.21239.5.1.2.1.3 , internalTemp : 1.3.6.1.4.1.21239.5.1.2.1.5 , temperatureUnits : 1.3.6.1.4.1.21239.5.1.1.7.0] | |
| vertiv_geist_watchdog_InternalHumidity | Vertiv Geist Watchdog Internal Humidity | % | It monitor internal humidity [VERTIV-BB-MIB :: internalLabel : 1.3.6.1.4.1.21239.5.1.2.1.3 , internalHumidity : 1.3.6.1.4.1.21239.5.1.2.1.6 ] | |
| vertiv_geist_watchdog_InternalDewPoint | Vertiv Geist Watchdog Internal Dew Point | C | It monitor internal dew point [VERTIV-BB-MIB :: internalLabel : 1.3.6.1.4.1.21239.5.1.2.1.3 , internalDewPoint : 1.3.6.1.4.1.21239.5.1.2.1.7 temperatureUnits :1 .3.6.1.4.1.21239.5.1.1.7.0] |
Vertiv Geist IMD PDU
Description
Monitors the Vertiv Geist IMD pdu statistics like the total number of devices on pdu unit, pdu status, pdu phase statistics like phase voltage, phase current, phase real power, phase apparent power, phase power factor and phase energy, pdu breaker current and pdu line current. Validated on Vertiv Geist IMD PDU ( SysObjOID : 1.3.6.1.4.1.21239.5.2 ). [ GEIST-IMD-MIB :: deviceCount : 1.3.6.1.4.1.21239.5.2.1.6.0 , pduMainAvail : 1.3.6.1.4.1.21239.5.2.3.1.1.5 , pduPhaseVoltage : 1.3.6.1.4.1.21239.5.2.3.2.1.4 , pduPhaseCurrent : 1.3.6.1.4.1.21239.5.2.3.2.1.8 , pduPhaseRealPower : 1.3.6.1.4.1.21239.5.2.3.2.1.12 , pduPhaseApparentPower : 1.3.6.1.4.1.21239.5.2.3.2.1.13 , pduPhasePowerFactor : 1.3.6.1.4.1.21239.5.2.3.2.1.14 , pduPhaseEnergy : 1.3.6.1.4.1.21239.5.2.3.2.1.15 , pduBreakerCurrent : 1.3.6.1.4.1.21239.5.2.3.3.1.4 , pduLineCurrent : 1.3.6.1.4.1.21239.5.2.3.4.1.4 ].
Prerequisites
Device must have support for GEIST-IMD-MIB.
Supported Metric
| Monitor Name | Metric Name | Metric Display Name | Unit | Description |
|---|---|---|---|---|
| Vertiv Geist - IMD PDU Device Count | vertiv_geist_imd_pdu_device_Count | Vertiv Geist IMD PDU Device Count | count | Monitors the total number of devices on pdu unit. [GEIST-IMD-MIB :: deviceCount : 1.3.6.1.4.1.21239.5.2.1.6.0]. |
| Vertiv Geist - IMD PDU Status | vertiv_geist_imd_pdu_Status | Vertiv Geist IMD PDU Status | Monitors the Vertiv Geist IMD pdu status. [GEIST-IMD-MIB :: pduMainAvail : 1.3.6.1.4.1.21239.5.2.3.1.1.5] Possible values: 0 - Unavailable, 1 - Available, 2 - Partially Unavailable. | |
| Vertiv Geist - IMD PDU Phase | vertiv_geist_imd_pdu_phase_Voltage | Vertiv Geist IMD PDU Phase Voltage | v | Monitors the Vertiv Geist IMD pdu phase voltage. [GEIST-IMD-MIB :: pduPhaseVoltage : 1.3.6.1.4.1.21239.5.2.3.2.1.4]. |
| vertiv_geist_imd_pdu_phase_Current | Vertiv Geist IMD PDU Phase Current | amps | Monitors the Vertiv Geist IMD pdu phase current reading. [GEIST-IMD-MIB :: pduPhaseCurrent : 1.3.6.1.4.1.21239.5.2.3.2.1.8]. | |
| vertiv_geist_imd_pdu_phase_real_Power | Vertiv Geist IMD PDU Phase Real Power | W | Monitors the Vertiv Geist IMD pdu phase real power. [GEIST-IMD-MIB :: pduPhaseRealPower : 1.3.6.1.4.1.21239.5.2.3.2.1.12]. | |
| vertiv_geist_imd_pdu_phase_apparent_power_VoltAmps | Vertiv Geist IMD PDU Phase Apparent Power VoltAmps | Monitors the Vertiv Geist IMD pdu phase apparent power in volt-amps. [GEIST-IMD-MIB :: pduPhaseApparentPower : 1.3.6.1.4.1.21239.5.2.3.2.1.13]. | ||
| vertiv_geist_imd_pdu_phase_PowerFactor | Vertiv Geist IMD PDU Phase PowerFactor | % | Monitors the Vertiv Geist IMD pdu phase power factor. [GEIST-IMD-MIB :: pduPhasePowerFactor : 1.3.6.1.4.1.21239.5.2.3.2.1.14]. | |
| vertiv_geist_imd_pdu_phase_energy_WattHours | Vertiv Geist IMD PDU Phase Energy WattHours | Monitors the Vertiv Geist IMD pdu phase accumulated energy in watt-hours. [GEIST-IMD-MIB :: pduPhaseEnergy : 1.3.6.1.4.1.21239.5.2.3.2.1.15]. | ||
| Vertiv Geist - IMD PDU Breaker Current | vertiv_geist_imd_pdu_breaker_Current | Vertiv Geist IMD PDU Breaker Current | amps | Monitors the Vertiv Geist IMD pdu breaker current reading. [GEIST-IMD-MIB :: pduBreakerCurrent : 1.3.6.1.4.1.21239.5.2.3.3.1.4]. |
| Vertiv Geist - IMD PDU Line Current | vertiv_geist_imd_pdu_line_Current | Vertiv Geist IMD PDU Line Current | amps | Monitors the Vertiv Geist IMD pdu line current reading. [GEIST-IMD-MIB :: pduLineCurrent : 1.3.6.1.4.1.21239.5.2.3.4.1.4]. |
VxRail Cluster Template
Description
Works for Gateway with 9.0.0 and above version
Prerequisites
No prerequisite
Supported Metric
| Monitor Name | Metric Name | Metric Display Name | Unit | Description |
|---|---|---|---|---|
| VxRail Cluster Monitor | vxrail_cluster_Operational_Status | Vxrail Cluster Operational Status | NULL | Vxrail Cluster Operational Status |
| vxrail_cluster_chassis_stats_Health | Vxrail Cluster Chassis Stats Health | NULL | Vxrail Cluster Chassis Stats Health |
VxRail Host Template
Description
Works for Gateway with 9.0.0 and above version
Prerequisites
No prerequisite
Supported Metric
| Monitor Name | Metric Name | Metric Display Name | Unit | Description |
|---|---|---|---|---|
| VxRail Hosts Monitor | vxrail_host_disk_State | VxRail Disk State | NULL | VxRail Disk State |
| vxrail_host_Operational_Status | Vxrail Host Operational Status | Vxrail Host Operational Status | ||
| vxrail_host_Power_Status | Vxrail Host Power Status | Vxrail Host Power Status | ||
| vxrail_host_disk_Write_Endurance | VxRail Disk Write Endurance | NULL | VxRail Disk Write Endurance | |
| vxrail_host_disk_Led_Status | VxRail Disk Led Status | NULL | VxRail Disk Led Status | |
| vxrail_host_Health_Status | Vxrail Host Health Status | NULL | Vxrail Host Health Status | |
| vxrail_host_powersupply_Health_Status | Vxrail Host Powersupply Health Status | NULL | Vxrail Host Powersupply Health Status | |
| vxrail_host_nics_Link_Status | VxRail Nics Link Status | NULL | VxRail Nics Link Status | |
| vxrail_host_boot_device_stats_Health | VxRail Boot Device Health | % | VxRail Boot Device Health |
WAN Interface Utilization
Description
This template is to be applied on the interfaces that connect to internet for monitoring the reserve bandwidth utilization. This template will be supported by VG v2.7.0 or above.
Prerequisites
Device must support IF-MIB.mib and VG v2.7.0 or above.
Supported Metric
| Monitor Name | Metric Name | Metric Display Name | Unit | Description |
|---|---|---|---|---|
| WAN Interface Utilization | wan.utilization.in | WAN Interface Utilization | % | WAN Interface In utilization. Speed of the interface and Inbound traffic will be considered to calculate incoming utilization.[OIDs: 1.3.6.1.2.1.2.2.1.10 or 1.3.6.1.2.1.31.1.1.1.6]. |
| wan.utilization.out | WAN Interface Utilization | % | WAN Interface Out utilization. Speed of the interface and outbound traffic will be considered to calculate outgoing utilization.[OIDs: 1.3.6.1.2.1.2.2.1.16 or 1.3.6.1.2.1.31.1.1.1.10]. | |
| wan.utilization.total | WAN Interface Utilization | % | It represents WAN interface total utilization. It will be calculated by using wan.utilization.in and wan.utilization.out metrics. Considering MAX of IN and OUT interface utilization as a Total interface utilization. |
WAN Interface Utilization - FOR INDIVIDUAL IN AND OUT SPEEDS
Description
This template is to be applied on the interfaces that connect to internet for monitoring the reserve bandwidth utilization. While assigning this template on a device,it will ask for 3 inputs from user:
- Interface name/description.
- Interface Speed - In (ISP provided DOWNLOAD speed on interface in bps).
- Interface Speed - Out (ISP provided UPLOAD speed on interface in bps).
Prerequisites
Device must support IF-MIB.mib
Supported Metric
| Monitor Name | Metric Name | Metric Display Name | Unit | Description |
|---|---|---|---|---|
| WAN Interface Utilization - FOR INDIVIDUAL IN AND OUT SPEEDS | wan.utilization.in | WAN Interface Utilization | % | WAN Interface In utilization. Speed of the interface and Inbound traffic will be considered to calculate incoming utilization.[OIDs: 1.3.6.1.2.1.2.2.1.10 or 1.3.6.1.2.1.31.1.1.1.6]. |
| wan.utilization.out | WAN Interface Utilization | % | WAN Interface Out utilization. Speed of the interface and outbound traffic will be considered to calculate outgoing utilization.[OIDs: 1.3.6.1.2.1.2.2.1.16 or 1.3.6.1.2.1.31.1.1.1.10]. |
Watchdog 100 environment monitors
Description
Monitors the internal temperature sensor reading.[OIDs: 1.3.6.1.4.1.21239.5.1.2.1.3,1.3.6.1.4.1.21239.5.1.2.1.6,1.3.6.1.4.1.21239.5.1.1.7.0].
Prerequisites
No prerequisite
Supported Metric
| Monitor Name | Metric Name | Metric Display Name | Unit | Description |
|---|---|---|---|---|
| Watchdog 100 Environment Monitors | watchdog.internal.sensor.temperature | Internal Temperature | C | Current reading of internal Temperature sensor.[OID: 1.3.6.1.4.1.21239.5.1.2.1.6,1.3.6.1.4.1.21239.5.1.1.7.0]. |
Watchguard Fireware - G2
Description
Monitors WatchGuard system statistics, including traffic, discarded packets, and active connections per policy, as well as CPU utilization and system-related counters such as inbound/outbound traffic, active connections, connection request rate, and connection request drop rate. Validated on XTM510 ( SysObjOID : 1.3.6.1.4.1.3097.1.5.9 ).[ WATCHGUARD-SYSTEM-STATISTICS-MIB :: wgSystemCpuUtil5 : 1.3.6.1.4.1.3097.6.3.78.0 , wgSystemCurrActiveConns : 1.3.6.1.4.1.3097.6.3.80.0 , wgSystemStreamReqTotal : 1.3.6.1.4.1.3097.6.3.30.0 , wgSystemStreamReqDrop : 1.3.6.1.4.1.3097.6.3.34.0, wgSystemTotalSendBytes : 1.3.6.1.4.1.3097.6.3.8.0 , wgSystemTotalRecvBytes : 1.3.6.1.4.1.3097.6.3.9.0 ]?[ WATCHGUARD-POLICY-MIB :: wgPolicyName : 1.3.6.1.4.1.3097.4.2.2.1.2 , wgPolicyL3PackageBytes : 1.3.6.1.4.1.3097.4.2.2.1.3 , wgPolicyActiveStreams : 1.3.6.1.4.1.3097.4.2.2.1.12 , wgPolicyDisc : 1.3.6.1.4.1.3097.4.2.2.1.14 ].
Prerequisites
Device must have support for WATCHGUARD-SYSTEM-STATISTICS-MIB And WATCHGUARD-POLICY-MIB.
Supported Metric
| Monitor Name | Metric Name | Metric Display Name | Unit | Description |
|---|---|---|---|---|
| WatchGuard Fireware - System Statistics | watchguard_fireware_cpu_Utilization | WatchGuard Fireware CPU Utilization | % | Monitors the CPU utilization of the system in last 5 minutes. The value is measured in 0.01%.[WATCHGUARD-SYSTEM-STATISTICS-MIB :: wgSystemCpuUtil5 :1.3.6.1.4.1.3097.6.3.78.0] |
| watchguard_fireware_active_Connections | WatchGuard Fireware Active Connections | Monitors the total number of currently active connections of the system. [WATCHGUARD-SYSTEM-STATISTICS-MIB :: wgSystemCurrActiveConns : 1.3.6.1.4.1.3097.6.3.80.0] | ||
| watchguard_fireware_connection_request_Rate | WatchGuard Fireware Connection Request Rate | Monitors the total number of the connection requests since system is up. [WATCHGUARD-SYSTEM-STATISTICS-MIB :: wgSystemStreamReqTotal : 1.3.6.1.4.1.3097.6.3.30.0] | ||
| watchguard_fireware_connection_request_drop_Rate | WatchGuard Fireware Connection Request Drop Rate | Monitors the total number of the connection requests being dropped since system is up. [WATCHGUARD-SYSTEM-STATISTICS-MIB :: wgSystemStreamReqDrop : 1.3.6.1.4.1.3097.6.3.34.0] | ||
| watchguard_fireware_traffic_In | WatchGuard Fireware Traffic In | MBps | Monitors the rate of total number of bytes received since system is up. This number includes both cut through traffic and host traffic. [WATCHGUARD-SYSTEM-STATISTICS-MIB :: wgSystemTotalRecvBytes : 1.3.6.1.4.1.3097.6.3.9.0] | |
| watchguard_fireware_traffic_Out | WatchGuard Fireware Traffic Out | MBps | Monitors the rate of total number of bytes sent since system is up. This number includes both cut through traffic and host traffic. [WATCHGUARD-SYSTEM-STATISTICS-MIB :: wgSystemTotalSendBytes :1.3.6.1.4.1.3097.6.3.8.0] | WatchGuard Fireware - Policy Statistics | watchguard_fireware_policy_Traffic | WatchGuard Fireware Policy Traffic | Bps | Monitors total traffic in bytes since setting up this policy. [WATCHGUARD-POLICY-MIB :: wgPolicyName : 1.3.6.1.4.1.3097.4.2.2.1.2 , wgPolicyL3PackageBytes : 1.3.6.1.4.1.3097.4.2.2.1.3] |
| watchguard_fireware_policy_discarded_Packets | WatchGuard Fireware Policy Discarded Packets | packet/min | Monitors total number of packets discarded since setting up this policy. [WATCHGUARD-POLICY-MIB :: wgPolicyName : 1.3.6.1.4.1.3097.4.2.2.1.2 , wgPolicyDisc : 1.3.6.1.4.1.3097.4.2.2.1.14] | |
| watchguard_fireware_policy_active_Connections | WatchGuard Fireware Policy ActiveConnections | Per Second | Monitors Total number of the active connections since setting up this policy.[WATCHGUARD-POLICY-MIB :: wgPolicyName : 1.3.6.1.4.1.3097.4.2.2.1.2 , wgPolicyActiveStreams : 1.3.6.1.4.1.3097.4.2.2.1.12] |
Watchguard XTM Fireware - G2
Description
Applicable on XTM fireware devices. Monitors the watch-guard system and policy statistics like CPU utilization,traffic rate,connection rate,connection drop rate and discarded packet rate.
Prerequisites
No prerequisite
Supported Metric
| Monitor Name | Metric Name | Metric Display Name | Unit | Description |
|---|---|---|---|---|
| Watchguard Policy Statistics | watchguard.policy.traffic | Total Policy Traffic | Bps | Total traffic in bytes since setting up this policy.[OIDs: 1.3.6.1.4.1.3097.4.2.2.1.2,1.3.6.1.4.1.3097.4.2.2.1.3]. |
| watchguard.policy.discarded.pkts | Policy Discarded Packets. | packet/min | Total number of packets discarded since setting up this policy.[OIDs: 1.3.6.1.4.1.3097.4.2.2.1.2,1.3.6.1.4.1.3097.4.2.2.1.14]. | |
| watchguard.policy.active.conn | Policy Active connections | psec | Total number of the active connections since setting up this policy.[OIDs: 1.3.6.1.4.1.3097.4.2.2.1.12,1.3.6.1.4.1.3097.4.2.2.1.2]. | |
| Watchguard System Statistics | watchguard.cpu.utilization | CPU Utilization | % | CPU utilization of the system in last 5 minutes. The value is measured in 0.01%.[OID: 1.3.6.1.4.1.3097.6.3.78.0] |
| watchguard.number.of.active.connections | Watchguard Number of Active Connections | Total number of currently active connections of the system.[OID: 1.3.6.1.4.1.3097.6.3.80.0] | ||
| watchguard.connection.request.rate | Watchguard Connection Request Rate | The total number of the connection requests since system is up.[OID: 1.3.6.1.4.1.3097.6.3.30.0] | ||
| watchguard.connection.request.drop.rate | Watchguard Connection Request Drop Rate | The total number of the connection requests being dropped since system is up.[OID: 1.3.6.1.4.1.3097.6.3.34.0] | ||
| watchguard.traffic.in | Watchguard Traffic In | MBps | The rate of total number of bytes received since system is up. This number includes both cut through traffic and host traffic.[OID: 1.3.6.1.4.1.3097.6.3.9.0] | |
| watchguard.traffic.out | Watchguard Traffic Out | MBps | The rate of total number of bytes sent since system is up. This number includes both cut through traffic and host traffic.[OID: 1.3.6.1.4.1.3097.6.3.8.0] |
WebLogic - G2
Description
Applicable on Oracle WebLogic servers. Please enable the SNMP agent on each of the managed servers in the WebLogic domain.
Prerequisites
No prerequisite
Supported Metric
| Monitor Name | Metric Name | Metric Display Name | Unit | Description |
|---|---|---|---|---|
| Weblogic Cluster Statistics | weblogic.cluster.alive.servers | Cluster Runtime Alive Servers | The current total number of alive servers in this cluster.[OID: 1.3.6.1.4.1.140.625.110.1.25] | |
| weblogic.cluster.runtime.fragment.sent | Cluster Runtime Fragment Sent | psec | The total number of multicast fragments sent from this server into the cluster.[OID: 1.3.6.1.4.1.140.625.110.1.35] | |
| weblogic.cluster.runtime.fragment.received | Cluster Runtime Fragment Received | psec | The total number of multicast messages received on this server from the cluster.[OID: 1.3.6.1.4.1.140.625.110.1.40] | |
| weblogic.cluster.runtime.lost.messages | Cluster Runtime Multicast Lost Messages | psec | The total number of in-coming multicast messages that were lost according to this server.[OID: 1.3.6.1.4.1.140.625.110.1.45] | |
| weblogic.cluster.runtime.resend.requests | Cluster Runtime Resend Requests | psec | The number of state-delta messages that had to be resent because a receiving server in the cluster missed a message.[OID: 1.3.6.1.4.1.140.625.110.1.30] | |
| Weblogic JDBC Connection Pool Statistics | weblogic.jdbc.connection.delay.avg | JDBC Average Connection Delay | Averaged time necessary to get a connection from the database.[OID: 1.3.6.1.4.1.140.625.190.1.62] | |
| weblogic.jdbc.active.connections | JDBC Active Connections | The current total active connections.[OID: 1.3.6.1.4.1.140.625.190.1.25] | ||
| weblogic.jdbc.waiting.threads | JDBC Waiting Threads for Connection | The current total waiting for a connection.[OID: 1.3.6.1.4.1.140.625.190.1.30] | ||
| weblogic.jdbc.connections.avail | JDBC Available Connections | Returns the number of available connections in this pool.[OID: 1.3.6.1.4.1.140.625.190.1.69] | ||
| Weblogic JDBC DataSource Statistics | weblogic.jdbc.ds.state | JDBC Data Source State | Data source Runtime state - current state of the data source (Running,Suspended,Shutdown,Unhealthy,Unknown).[OID: 1.3.6.1.4.1.140.625.191.1.35] | |
| weblogic.jdbc.ds.active.conn | JDBC Data Source Active Connections | The number of connections currently in use by applications.[OID: 1.3.6.1.4.1.140.625.191.1.80] | ||
| weblogic.jdbc.ds.waiting.conn | JDBC Data Source Waiting Connections | The number of connection requests waiting for a database connection [OID: 1.3.6.1.4.1.140.625.191.1.85] | ||
| weblogic.jdbc.ds.avail.conn | JDBC Data Source DB Available Connections | The number of database connections currently available (not in use) in this data source.[OID: 1.3.6.1.4.1.140.625.191.1.155] | ||
| weblogic.jdbc.ds.conn.delay | JDBC Data Source DB Connection Delay | ms | The average time in milliseconds that it takes to create a physical connection to the database.[OID: 1.3.6.1.4.1.140.625.191.1.45] | |
| Weblogic JMS Consumer Runtime Statistics | weblogic.jms.consumer.pending.messages | JMS Consumer Pending Messages | The number of messages pending (uncommitted and unacknowledged) by this consumer.[OID: 1.3.6.1.4.1.140.625.210.1.25] | |
| weblogic.jms.consumer.received.messages | JMS Consumer Received Messages | The number of messages received by this consumer since the last reset.[OID: 1.3.6.1.4.1.140.625.210.1.30] | ||
| weblogic.jms.consumer.pending.bytes | JMS Consumer Pending Bytes | Bytes | The number of bytes pending (uncommitted and unacknowledged) by this consumer.[OID: 1.3.6.1.4.1.140.625.210.1.35] | |
| weblogic.jms.consumer.received.bytes | JMS Consumer Received Bytes | Bytes | The number of bytes received by this consumer since the last reset.[OID: 1.3.6.1.4.1.140.625.210.1.40] | |
| Weblogic JMS Producer Runtime Statistics | weblogic.jms.producer.pending.messages | JMS Producer Pending Messages | The number of messages pending (uncommitted and unacknowledged) by this producer.[OID: 1.3.6.1.4.1.140.625.230.1.25] | |
| weblogic.jms.producer.sent.messages | JMS Producer Sent Messages | The number of messages sent by this producer since the last reset.[OID: 1.3.6.1.4.1.140.625.230.1.30] | ||
| weblogic.jms.producer.pending.bytes | JMS Producer Pending Bytes | Bytes | The number of bytes pending (uncommitted and unacknowledged) by this producer.[OID: 1.3.6.1.4.1.140.625.230.1.35] | |
| weblogic.jms.producer.sent.bytes | JMS Producer Sent Bytes | Bytes | The number of bytes sent by this producer since the last reset.[OID: 1.3.6.1.4.1.140.625.230.1.40] | |
| Weblogic JMS Server Statistics | weblogic.jms.server.pending.messages | JMS Server Pending Messages | The current number of messages pending (unacknowledged or uncommitted) stored on this JMS server. Pending messages are over and above the current number of messages.[1.3.6.1.4.1.140.625.250.1.70] | |
| weblogic.jms.server.current.destinations | JMS Server Current Destinations | The current number of destinations for this JMS server.[OID: 1.3.6.1.4.1.140.625.250.1.50] | ||
| weblogic.jms.server.current.messages | JMS Server Current Stored Messages | The current number of messages stored on this JMS server. This does not include the pending messages.[OID: 1.3.6.1.4.1.140.625.250.1.65] | ||
| weblogic.jms.server.current.bytes | JMS Server Current Stored Bytes | Bytes | The current number of bytes stored in this JMS Server. This does not include the pending bytes.[OID: 1.3.6.1.4.1.140.625.250.1.90] | |
| weblogic.jms.server.pending.bytes | JMS Server Pending Bytes | Bytes | The number of pending bytes stored in this JMS Server. Pending bytes are over and above the current number of bytes.[OID: 1.3.6.1.4.1.140.625.250.1.95] | |
| Weblogic JMS Service Statistics | weblogic.jms.server.current.connections | JMS Server Current Connections | The current number of connection to this JMS server.[OID: 1.3.6.1.4.1.140.625.240.1.30] | |
| weblogic.jms.servers.current.count | JMS Servers Connected to JMS Services | The current number of JMSServers connected to this JMS Services.[OID: 1.3.6.1.4.1.140.625.240.1.50] | ||
| Weblogic Jolt Performance | weblogic.jolt.avg.processor.load | Jolt Average Processor Load | Represents a snapshot of the average load of all processors.[OID: 1.3.6.1.4.1.140.625.302.1.21] | |
| weblogic.jolt.jvm.processor.load | Jolt JVM Processor Load | Double that indicates the average load that the VM is placing on all processors.[OID: 1.3.6.1.4.1.140.625.302.1.26] | ||
| weblogic.jvm.heap.free | weblogic.jvm.heap.free | % | Represents the Java heap free memory in percentage.[1.3.6.1.4.1.140.625.302.1.22,1.3.6.1.4.1.140.625.302.1.34] | |
| weblogic.jolt.heap.utilization | Jolt Heap Utilization | % | Percentage of the heap memory utilization.[OID: 1.3.6.1.4.1.140.625.302.1.50] | |
| weblogic.jolt.physical.memory.util | Jolt Physical Memory Utilization | % | Represents the physical memory utilization on the host computer.[1.3.6.1.4.1.140.625.302.1.23,1.3.6.1.4.1.140.625.302.1.37,1.3.6.1.4.1.140.625.302.1.40] | |
| weblogic.jolt.jvm.gc | Number of GCs Perfomed | The number of GCs perfomed so far.[OID: 1.3.6.1.4.1.140.625.302.1.32] | ||
| weblogic.jolt.jvm.gc.time | Time spent in GC | ms | Indicates the number of milliseconds that the Virtual Machine has spent on all garbage collection runs since the VM was started.[OID: 1.3.6.1.4.1.140.625.302.1.33] | |
| Weblogic Query Cache Statistics | weblogic.query.cache.statistics | Query cache statistics | The count of the number of cache hits of the query cache for this EJB.[OID: 1.3.6.1.4.1.140.625.135.1.5,1.3.6.1.4.1.140.625.135.1.15,1.3.6.1.4.1.140.625.135.1.35] | |
| Weblogic Runtime Queue Statistics | weblogic.runtime.execute.threads | Runtime Execute Threads | The total number of execute threads assigned to the queue.[OID: 1.3.6.1.4.1.140.625.180.1.46] | |
| weblogic.runtime.serviced.requests | Runtime Serviced Requests | The number of requests which have been processed by this queue.[OID: 1.3.6.1.4.1.140.625.180.1.40] | ||
| weblogic.runtime.idle.threads | weblogic.runtime.idle.threads | The number of idle threads assigned to the queue.[OID: 1.3.6.1.4.1.140.625.180.1.25] | ||
| weblogic.runtime.pending.requests | Runtime Pending Requests | The number of waiting requests in the queue.[OID: 1.3.6.1.4.1.140.625.180.1.35] | ||
| Weblogic Runtime Thread Statistics | weblogic.runtime.total.threads | Total Threads | Represents the total number of threads in the pool.[OID: 1.3.6.1.4.1.140.625.367.1.25] | |
| weblogic.runtime.idle.threads | Idle Threads | Represents the number of idle threads in the pool.[OID: 1.3.6.1.4.1.140.625.367.1.30] | ||
| weblogic.runtime.pending.threads | Pending Threads | Returns the number of pending requests in the priority queue. This is the total of internal system requests and user requests.[OID: 1.3.6.1.4.1.140.625.367.1.35] | ||
| weblogic.runtime.throughput | Requests Completed | psec | Represents the mean number of requests completed per second.[OID: 1.3.6.1.4.1.140.625.367.1.65] | |
| weblogic.runtime.request.manager.status | Request Manager Status | Returns the Indicates if the RequestManager is suspended. A suspended manager will not dequeue work and dispatch threads till it is resumed.[OID: 1.3.6.1.4.1.140.625.367.1.80] | ||
| Weblogic Server State | weblogic.server.state | Server state | The current state of the server. Legal values are Initializing,Suspended,Running,Shutting Down. Represented as 1 -Running,0 -Initializing,Suspended and Shutting Down [OID: 1.3.6.1.4.1.140.625.360.1.5,1.3.6.1.4.1.140.625.360.1.15,1.3.6.1.4.1.140.625.360.1.60] |
Wireless Interface
Description
Monitors the IEEE 802.11 interface MAC layer statistics,connected client statistics,number of currently associated active devices and association statistics of the clients on each of the IEEE 802.11 radio interfaces.
Prerequisites
No prerequisite
Supported Metric
| Monitor Name | Metric Name | Metric Display Name | Unit | Description |
|---|---|---|---|---|
| IEEE 802.11 Client Stats | dot11.client.bytes.received | WLAN Client Bytes Received | Bps | Monitors the number of bytes received from WLAN client.[OID: 1.3.6.1.4.1.9.9.273.1.3.1.1.7]. |
| dot11.client.bytes.sent | WLAN Client Bytes Sent | Bps | Monitors the number of bytes sent to WLAN client.[OID: 1.3.6.1.4.1.9.9.273.1.3.1.1.9]. | |
| dot11.client.signal.quality | WLAN Client Signal Quality | % | Monitors the device-dependent measure of the signal quality of the most recently received packet from this client.[OID: 1.3.6.1.4.1.9.9.273.1.3.1.1.4]. | |
| dot11.client.connect.time | WLAN Client Connect Time | s | Monitors the time in seconds that this client has been associated with this device.[OID: 1.3.6.1.4.1.9.9.273.1.3.1.1.2]. | |
| IEEE 802.11 Interface Stats | dot11.stations.authenticated | Authenticated Stations | Monitors the number of stations authenticated with this device on this interface since device re-started.[OID: 1.3.6.1.4.1.9.9.273.1.1.3.1.2]. | |
| dot11.active.bridges | Associated Active Bridges | Monitors the number of bridges currently associating with this device on this interface.[OID: 1.3.6.1.4.1.9.9.273.1.1.2.1.2]. | ||
| dot11.active.repeaters | Associated Active Repeaters | Monitors the number of repeaters currently associating with this device on this interface.[OID: 1.3.6.1.4.1.9.9.273.1.1.2.1.3]. | ||
| dot11.active.wireless.clients | Associated Active Wireless Clients | Monitors the number of wireless clients currently associating with this device on this interface.[OID: 1.3.6.1.4.1.9.9.273.1.1.2.1.1]. | ||
| dot11.deauthenticated.stations | Deauthenticated Stations | Monitors the number of stations deauthenticated with this device on this interface since device re-started.[OID: 1.3.6.1.4.1.9.9.273.1.1.3.1.5]. | ||
| dot11.disassociated.stations | Disassociated Stations | Monitors the number of stations disassociated with this device on this interface since device re-started.[OID: 1.3.6.1.4.1.9.9.273.1.1.3.1.6]. | ||
| dot11.roamedaway.stations | Roamed Away Stations | Monitors the number of stations roamed away from this device on this interface since device re-started.[OID: 1.3.6.1.4.1.9.9.273.1.1.3.1.4]. | ||
| dot11.roamedin.stations | Roamed In Stations | Monitors the number of stations roamed from another device to this device on this interface since device re-started.[OID: 1.3.6.1.4.1.9.9.273.1.1.3.1.3]. | ||
| dot11.stations.associated | Associated Stations | Provides the number of stations associated with this device on this interface since device re-started.[OID: 1.3.6.1.4.1.9.9.273.1.1.3.1.1]. | ||
| dot11.ssid.mismatch.errors | SSID Mismatch Errors | Monitors the number of received beacon or probe response frames for which ssid mismatch errors occured.[OID: 1.3.6.1.4.1.9.9.272.1.2.1.1.1.3]. | ||
| dot11.energy.errors | Energy Detection Errors | Monitors the number of frames for which transmission is deferred due to energy detection.[OID: 1.3.6.1.4.1.9.9.272.1.2.1.1.1.1]. | ||
| dot11.mac.crc.errors | MAC CRC Errors | Monitors the number of received frames which are having MAC CRC error.[OID: 1.3.6.1.4.1.9.9.272.1.2.1.1.1.2]. |
XenServer Datastore Performance
Description
XenServer Datastore Performance
Prerequisites
No prerequisite
Supported Metric
| Monitor Name | Metric Name | Metric Display Name | Description | Unit |
|---|---|---|---|---|
| XenServer Datastore Performance | xenserver.datastore.capacity.freespace | XenServer Datastore Capacity FreeSpace | XenServer Datastore Capacity FreeSpace | GB |
| xenserver.datastore.capacity.usage | XenServer Datastore Capacity Usage | XenServer Datastore Capacity Usage | % | |
| xenserver.datastore.freespace.average | XenServer Datastore FreeSpace Average | XenServer Datastore FreeSpace Average | % |
XenServer Dom0 Basic Monitor
Description
XenServer Dom0 Basic Monitor
Prerequisites
No prerequisite
Supported Metric
| Monitor Name | Metric Name | Metric Display Name | Unit | Description |
|---|---|---|---|---|
| XenServer Dom0 Basic Monitor | xenserver.xendom0.deadbeef.state | XenServer Xen Dom0 Deadbeef State | NULL | XenServer Xen Dom0 Deadbeef State |
| xenserver.xendom0.cpu.usage | XenServer XenDom0 CPU Usage | % | Monitors the CPU Utilization of the Xen Domain0 Host. | |
| xenserver.xendom0.memory.usage | XenServer XenDom0 Memory Usage | % | XenServer XenDom0 Memory Usage | |
| xenserver.xendom0.nfs.mount.state | XenServer XenDmo0 NFS Mount State | NULL | XenServer XenDmo0 NFS Mount State | |
| xenserver.xendom0.disk.usage | XenServer XenDom0 Disk Usage | % | XenServer XenDom0 Disk Usage |
XenServer Host Performance - Advanced
Description
XenServer Host Performance - Advanced
Prerequisites
No prerequisite
Supported Metric
| Monitor Name | Metric Name | Metric Display Name | Unit | Description |
|---|---|---|---|---|
| XenServer Host Performance - Advanced | xenserver.pif.lo.tx | XenServer Pif LO transfer | Bps | XenServer Pif LO transfer. |
| xenserver.pif.lo.tx.errors | XenServer Pif LO transfer Errors | Errors per Sec | XenServer Pif LO transfer Errors. | |
| xenserver.pif.lo.rx | Xenserver Pif Lo receive | Bps | Xenserver Pif Lo receive. | |
| xenserver.pif.lo.rx.errors | XenServer Pif LO receive Errors | Errors per Sec | XenServer Pif LO receive Errors. | |
| xenserver.pif.tx.errors | XenServer Pif Transfer Errors | Errors per Sec | XenServer Pif Transfer Errors. | |
| xenserver.pif.rx.errors | XenServer Pif Receive Errors | Errors per Sec | XenServer Pif Receive Errors. | |
| xenserver.latency | XenServer Latency | ms | XenServer Latency. | |
| xenserver.memory.reclaimed | XenServer Memory reclaimed | Bytes | XenServer Memory reclaimed. | |
| xenserver.memory.max.reclaimed | XenServer Memory Max reclaimed | Bytes | XenServer Memory Max reclaimed. | |
| xenserver.network.latency | XenServer Network Latency | s | XenServer Network Latency. | |
| xenserver.statefile.latency | XenServer State file Latency | s | XenServer State file Latency. |
XenServer Host Performance - Basic
Description
XenServer Host Performance - Basic
Prerequisites
No prerequisite
Supported Metric
| Monitor Name | Metric Name | Metric Display Name | Unit | Description |
|---|---|---|---|---|
| XenServer Host Performance - Basic | xenserver.io.queuesize.average | XenServer IO Queuesize Average | NULL | XenServer IO Queuesize Average. |
| xenserver.cpu.time.cstate | XenServer CPU time cstate | % | XenServer CPU time cstate. | |
| xenserver.cpu.usage | XenServer CPU Usage | % | XenServer CPU Usage. | |
| xenserver.cpu.usage.average | XenServer CPU Usage Average | % | XenServer CPU Usage Average. | |
| xenserver.loadavg | XenServer Load Average | % | XenServer Load Average. | |
| xenserver.memory.freespace | XenServer Memory Free Space | GB | XenServer Memory Free Space. | |
| xenserver.memory.total | XenServer Memory Total | GB | XenServer Memory Total. | |
| xenserver.pif.rx | XenServer Pif Receive | Bps | XenServer Pif Receive. | |
| xenserver.pif.tx | XenServer Pif Transfer | Bps | XenServer Pif Transfer. | |
| xenserver.pif.aggr.rx | XenServer Pif aggregate Receive | Bps | XenServer Pif aggregate Receive. | |
| xenserver.pif.aggr.tx | XenServer Pif aggregate Transfer | Bps | XenServer Pif aggregate Transfer. | |
| xenserver.sr.cache.hits | XenServer Sr Cache Hits | hps | XenServer Sr Cache Hits. | |
| xenserver.sr.cache.misses | XenServer Sr Cache Misses | mps | XenServer Sr Cache Misses. | |
| xenserver.sr.cache.size | XenServer Sr Cache Size | Bytes | XenServer Sr Cache Size. | |
| xenserver.xapi.memory.allocation | XenServer xapi Memory Allocation | KB | XenServer xapi Memory Allocation. | |
| xenserver.xapi.memory.freespace | XenServer xapi Memory Freespace | KB | XenServer xapi Memory Freespace. | |
| xenserver.xapi.healthcheck.latencyhealth | XenServer xapi Health Check Latency Health | s | XenServer xapi Health Check Latency Health. | |
| xenserver.xapi.live.memory | XenServer xapi live Memory | KB | XenServer xapi live Memory. | |
| xenserver.xapi.memory.usage | XenServer xapi Memory Usage | KB | XenServer xapi Memory Usage. | |
| xenserver.vm.poweroff.count | XenServer VirtualMachines Poweroff Count | NULL | XenServer VirtualMachines Poweroff Count. | |
| xenserver.vm.poweron.count | XenServer VirtualMachines Poweron Count | NULL | XenServer VirtualMachines Poweron Count. | |
| xenserver.vm.suspended.count | XenServer VirtualMachines Suspended Count | NULL | XenServer VirtualMachines Suspended Count. | |
| xenserver.memory.usage.average | XenServer Memory Usage Average | % | XenServer Memory Usage Average. | |
| xenserver.xapi.memory.usage.average | XenServer xapi Memory Usage Average | % | XenServer xapi Memory Usage Average. | |
| xenserver.host.license.expiry | XenServer Host License Expiry | Days | XenServer Host License Expiry. | |
| xenserver.memory.freespace.average | XenServer Memory Freespace Average | % | XenServer Memory Freespace Average | |
| xenserver.host.status.avaliablity | xenserver.host.status.avaliablity | NULL | xenserver.host.status.avaliablity. |
Yamaha Routers Monitors - G2
Description
Template for Yamaha Routers. Monitors include memory utilization,CPU utilization,system alarm etc.,
Prerequisites
No prerequisite
Supported Metric
| Monitor Name | Metric Name | Metric Display Name | Unit | Description |
|---|---|---|---|---|
| Yamaha Router Power Module Status | yamaha.router.power.module.status | Yamaha Router Power Module Status | Monitors the status of a power module. Possible values are 1- up,2- down,3- notInstalled.[OIDs: 1.3.6.1.4.1.1182.2.1.13.1.1,1.3.6.1.4.1.1182.13.1.2]. | |
| Yamaha Router Performance | yamaha.router.memory.utilization | Yamaha Router Memory Utilization | % | Monitors the percentage utilization of the main memory.[OID: 1.3.6.1.4.1.1182.2.1.4.0]. |
| yamaha.router.cpu.utilization.5minutes | Yamaha Router CPU Utilization 5Minutes | % | Monitors the average utilization of CPU in 5 minutes.[OID: 1.3.6.1.4.1.1182.2.1.7.0]. | |
| yamaha.router.cpu.type | Yamaha Router CPU Type | Provides the cpu type.[OID: 1.3.6.1.4.1.1182.2.1.1.0] | ||
| yamaha.router.system.alarm | Yamaha Router System Alarm | Monitors the condition when the alarm LED is on or off.[OID: 1.3.6.1.4.1.1182.2.1.16.0] | ||
| yamaha.router.inbox.temperature | Yamaha Router Inbox Temperature | Monitors the temperature in the box.[OID: 1.3.6.1.4.1.1182.2.1.15.0]. | ||
| Yamaha Router Fan Module Status | yamaha.router.fan.module.status | Yamaha Router Fan Module Status | Monitors the status of a fan module. Possible values are 1-good,2- noGood.[OIDs: 1.3.6.1.4.1.1182.2.1.14.1.1,1.3.6.1.4.1.1182.14.1.2]. |
Yarn NodeManager Jvm Template
Note
This template will be deprecated soon.Description
Testing
Prerequisites
No prerequisite
Supported Metric
| Monitor Name | Metric Name | Metric Display Name | Unit | Description |
|---|---|---|---|---|
| Yarn NodeManager Jvm Monitor | yarn.nodemanager.jvm.daemon.thread.count | Yarn Nodemanager JVM Daemon Thread Count | count | NULL |
| yarn.nodemanager.jvm.gc.collection.count | Yarn Nodemanager JVM GC Collection Count | count | NULL | |
| yarn.nodemanager.jvm.heap_memory_committed | Yarn Nodemanager JVM Heap Memory Committed | Bytes | NULL | |
| yarn.nodemanager.jvm.heap_memory_init | Yarn Nodemanager JVM Heap Memory Init | Bytes | NULL | |
| yarn.nodemanager.jvm.heap_memory_max | Yarn Nodemanager JVM Heap Memory Max | Bytes | NULL | |
| yarn.nodemanager.jvm.heap_memory_used | Yarn Nodemanager JVM Heap Memory Used | Bytes | NULL | |
| yarn.nodemanager.jvm.memorypool.codecache.peak_usage_used | Yarn Nodemanager JVM Memorypool Codecache Peak Usage Used | Bytes | NULL | |
| yarn.nodemanager.jvm.memorypool.codecache.peak_usage_committed | Yarn Nodemanager JVM Memorypool Codecache Peak Usage Committed | KB | NULL | |
| yarn.nodemanager.jvm.memorypool.codecache.peak_usage_init | Yarn Nodemanager JVM Memorypool Codecache Peak Usage Init | KB | NULL | |
| yarn.nodemanager.jvm.memorypool.codecache.peak_usage_max | Yarn Nodemanager JVM Memorypool Codecache Peak Usage Max | KB | NULL | |
| yarn.nodemanager.jvm.memorypool.edenspace.peak_usage_used | Yarn Nodemanager JVM Memorypool Edenspace Peak Usage Used | KB | NULL | |
| yarn.nodemanager.jvm.memorypool.edenspace.peak_usage_committed | Yarn Nodemanager JVM Memorypool.edenspace Peak Usage Committed | KB | NULL | |
| yarn.nodemanager.jvm.memorypool.edenspace.peak_usage_init | Yarn Nodemanager JVM Memorypool Edenspace Peak Usage Init | KB | NULL | |
| yarn.nodemanager.jvm.memorypool.edenspace.peak_usage_max | Yarn Nodemanager JVM Memorypool Edenspace Peak Usage Max | KB | NULL | |
| yarn.nodemanager.jvm.memorypool.metaspace.peak_usage_used | Yarn Nodemanager JVM Memorypool Metaspace Peak Usage Used | KB | NULL | |
| yarn.nodemanager.jvm.memorypool.metaspace.peak_usage_committed | Yarn Nodemanager JVM Memorypool.metaspace Peak Usage Committed | KB | NULL | |
| yarn.nodemanager.jvm.memorypool.metaspace.peak_usage_init | Yarn Nodemanager JVM Memorypool Metaspace Peak Usage Init | KB | NULL | |
| yarn.nodemanager.jvm.memorypool.metaspace.peak_usage_max | Yarn Nodemanager JVM Memorypool Metaspace Peak Usage Max | KB | NULL | |
| yarn.nodemanager.jvm.memorypool.survivorspace.peak_usage_used | Yarn Nodemanager JVM Memorypool Survivorspace Peak Usage | KB | NULL | |
| yarn.nodemanager.jvm.memorypool.survivorspace.peak_usage_committed | Yarn Nodemanager JVM Memorypool Survivorspace Peak Usage Committed | KB | NULL | |
| yarn.nodemanager.jvm.memorypool.survivorspace.peak_usage_init | Yarn Nodemanager JVM Memorypool Survivorspace Peak Usage Init | KB | NULL | |
| yarn.nodemanager.jvm.memorypool.survivorspace.peak_usage_max | Yarn Nodemanager JVM Memorypool Survivorspace Peak Usage Max | KB | NULL | |
| yarn.nodemanager.jvm.memorypool.tenuredgen.peak_usage_used | Yarn Nodemanager JVM Memorypool Tenuredgen Peak Usage Used | KB | NULL | |
| yarn.nodemanager.jvm.memorypool.tenuredgen.peak_usage.init | Yarn Nodemanager JVM Memorypool Tenuredgen Peak Usage Init | KB | NULL | |
| yarn.nodemanager.jvm.memorypool.tenuredgen.peak_usage.max | Yarn Nodemanager JVM Memorypool Tenuredgen Peak Usage Max | KB | NULL | |
| yarn.nodemanager.jvm.memorypool.tenuredgen.peak_usage_committed | Yarn Nodemanager JVM Memorypool Tenuredgen Peak Usage Committed | KB | NULL | |
| yarn.nodemanager.jvm.non_heap_memory_committed | Yarn Nodemanager JVM Non Heap Memory Committed | Bytes | NULL | |
| yarn.nodemanager.jvm.non_heap_memory_init | Yarn Nodemanager JVM Non Heap Memory Init | Bytes | NULL | |
| yarn.nodemanager.jvm.non_heap_memory_max | Yarn Nodemanager JVM Non Heap Memory Max | Bytes | NULL | |
| yarn.nodemanager.jvm.non_heap_memory_used | Yarn Nodemanager JVM Non Heap Memory Used | Bytes | NULL | |
| yarn.nodemanager.jvm.thread.count | Yarn Nodemanager JVM Thread Count | count | NULL | |
| yarn.nodemanager.jvm.thread.current_cpu_time | Yarn Nodemanager JVM Thread Current Cpu Time | ms | NULL | |
| yarn.nodemanager.jvm.thread.current_user_time | Yarn Nodemanager JVM Thread Current User Time | ms | NULL | |
| yarn.nodemanager.jvm.thread.peakcount | Yarn Nodemanager JVM Thread PeakCount | count | NULL |
Yarn ResourceManager JVM Template
Note
This template will be deprecated soon.Description
This Template contains JVM monitors related to Yarn Resource Manager
Prerequisites
No prerequisite
Supported Metric
| Monitor Name | Metric Name | Metric Display Name | Unit | Description |
|---|---|---|---|---|
| Yarn ResourceManager JVM Monitor | yarn.resourcemanager.jvm.daemon.thread.count | Yarn Resourcemanager JVM Daemon Thread Count | count | NULL |
| yarn.resourcemanager.jvm.gc.collection.count | Yarn Resourcemanager JVM GC Collection Count | count | NULL | |
| yarn.resourcemanager.jvm.heap_memory_committed | Yarn Resourcemanager JVM Heap Memory Committed | Bytes | NULL | |
| yarn.resourcemanager.jvm.heap_memory_init | Yarn Resourcemanager JVM Heap Memory Init | Bytes | NULL | |
| yarn.resourcemanager.jvm.heap_memory_max | Yarn Resourcemanager JVM Heap Memory Max | Bytes | NULL | |
| yarn.resourcemanager.jvm.heap_memory_used | Yarn Resourcemanager JVM Heap Memory Used | Bytes | NULL | |
| yarn.resourcemanager.jvm.memorypool.codecache.peak_usage_used | Yarn Resourcemanager JVM Memorypool Codecache Peak Usage Used | Bytes | NULL | |
| yarn.resourcemanager.jvm.memorypool.codecache.peak_usage_committed | Yarn Resourcemanager JVM Memorypool Codecache Peak Usage Committed | KB | NULL | |
| yarn.resourcemanager.jvm.memorypool.codecache.peak_usage_init | Yarn Resourcemanager JVM Memorypool Codecache Peak Usage Init | KB | NULL | |
| yarn.resourcemanager.jvm.memorypool.codecache.peak_usage_max | Yarn Resourcemanager JVM Memorypool Codecache Peak Usage Max | KB | NULL | |
| yarn.resourcemanager.jvm.memorypool.edenspace.peak_usage_used | Yarn Resourcemanager JVM Memorypool Edenspace Peak Usage Used | KB | NULL | |
| yarn.resourcemanager.jvm.memorypool.edenspace.peak_usage_committed | Yarn Resourcemanager JVM Memorypool.edenspace Peak Usage Committed | KB | NULL | |
| yarn.resourcemanager.jvm.memorypool.edenspace.peak_usage_init | Yarn Resourcemanager JVM Memorypool Edenspace Peak Usage Init | KB | NULL | |
| yarn.resourcemanager.jvm.memorypool.edenspace.peak_usage_max | Yarn Resourcemanager JVM Memorypool Edenspace Peak Usage Max | KB | NULL | |
| yarn.resourcemanager.jvm.memorypool.metaspace.peak_usage_used | Yarn Resourcemanager JVM Memorypool Metaspace Peak Usage Used | KB | NULL | |
| yarn.resourcemanager.jvm.memorypool.metaspace.peak_usage_committed | Yarn Resourcemanager JVM Memorypool.metaspace Peak Usage Committed | KB | NULL | |
| yarn.resourcemanager.jvm.memorypool.metaspace.peak_usage_init | Yarn Resourcemanager JVM Memorypool Metaspace Peak Usage Init | KB | NULL | |
| yarn.resourcemanager.jvm.memorypool.metaspace.peak_usage_max | Yarn Resourcemanager JVM Memorypool Metaspace Peak Usage Max | KB | NULL | |
| yarn.resourcemanager.jvm.memorypool.survivorspace.peak_usage_used | Yarn Resourcemanager JVM Memorypool Survivorspace Peak Usage | KB | NULL | |
| yarn.resourcemanager.jvm.memorypool.survivorspace.peak_usage_committed | Yarn Resourcemanager JVM Memorypool Survivorspace Peak Usage Committed | KB | NULL | |
| yarn.resourcemanager.jvm.memorypool.survivorspace.peak_usage_init | Yarn Resourcemanager JVM Memorypool Survivorspace Peak Usage Init | KB | NULL | |
| yarn.resourcemanager.jvm.memorypool.survivorspace.peak_usage_max | Yarn Resourcemanager JVM Memorypool Survivorspace Peak Usage Max | KB | NULL | |
| yarn.resourcemanager.jvm.memorypool.tenuredgen.peak_usage_used | Yarn Resourcemanager JVM Memorypool Tenuredgen Peak Usage Used | KB | NULL | |
| yarn.resourcemanager.jvm.memorypool.tenuredgen.peak_usage.init | Yarn Resourcemanager JVM Memorypool Tenuredgen Peak Usage Init | KB | NULL | |
| yarn.resourcemanager.jvm.memorypool.tenuredgen.peak_usage.max | Yarn Resourcemanager JVM Memorypool Tenuredgen Peak Usage Max | KB | NULL | |
| yarn.resourcemanager.jvm.memorypool.tenuredgen.peak_usage_committed | Yarn Resourcemanager JVM Memorypool Tenuredgen Peak Usage Committed | KB | NULL | |
| yarn.resourcemanager.jvm.non_heap_memory_committed | Yarn Resourcemanager JVM Non Heap Memory Committed | Bytes | NULL | |
| yarn.resourcemanager.jvm.non_heap_memory_init | Yarn Resourcemanager JVM Non Heap Memory Init | Bytes | NULL | |
| yarn.resourcemanager.jvm.non_heap_memory_max | Yarn Resourcemanager JVM Non Heap Memory Max | Bytes | NULL | |
| yarn.resourcemanager.jvm.non_heap_memory_used | Yarn Resourcemanager JVM Non Heap Memory Used | Bytes | NULL | |
| yarn.resourcemanager.jvm.thread.count | Yarn Resourcemanager JVM Thread Count | count | NULL | |
| yarn.resourcemanager.jvm.thread.current_cpu_time | Yarn Resourcemanager JVM Thread Current Cpu Time | ms | NULL | |
| yarn.resourcemanager.jvm.thread.current_user_time | Yarn Resourcemanager JVM Thread Current User Time | ms | NULL | |
| yarn.resourcemanager.jvm.thread.peakcount | Yarn Resourcemanager JVM Thread PeakCount | count | NULL |
Yarn ResourceManager Template
Note
This template will be deprecated soon.Description
This template contains monitors related to ResourceManager
Prerequisites
No prerequisite
Supported Metric
| Monitor Name | Metric Name | Metric Display Name | Unit | Description |
|---|---|---|---|---|
| Yarn ResourceManager Monitor | yarn.resourcemanager.apps.submitted | Yarn Resourcemanager Submitted Apps | count | The number of submitted applications. |
| yarn.resourcemanager.apps.completed | Yarn Resourcemanager Completed Apps | count | The number of completed applications. | |
| yarn.resourcemanager.apps.pending | Yarn Resourcemanager Pending Apps | count | The number of pending applications. | |
| yarn.resourcemanager.apps.running | Yarn Resourcemanager Running Apps | count | The number of running applications. | |
| yarn.resourcemanager.apps.failed | Yarn Resourcemanager Failed Apps | count | The number of failed applications | |
| yarn.resourcemanager.apps.killed | Yarn Resourcemanager Killed Apps | count | The number of killed applications. | |
| yarn.resourcemanager.reserved.mb | Yarn Resourcemanager Reserved MB | MB | The size of reserved memory. | |
| yarn.resourcemanager.available.mb | Yarn Resourcemanager Available MB | MB | The amount of available memory. | |
| yarn.resourcemanager.allocated.mb | Yarn Resourcemanager Allocated MB | MB | The amount of allocated memory. | |
| yarn.resourcemanager.reserved.virtual.cores | Yarn Resourcemanager Reserved Virtual Cores | count | The number of reserved virtual cores. | |
| yarn.resourcemanager.available.virtual.cores | Yarn Resourcemanager Available Virtual Cores | count | The number of available virtual cores. | |
| yarn.resourcemanager.allocated.virtual.cores | Yarn Resourcemanager Allocated Virtual Cores | count | The number of allocated virtual cores. | |
| yarn.resourcemanager.containers.allocated | Yarn Resourcemanager Containers Allocated | count | The number of containers allocated | |
| yarn.resourcemanager.containers.reserved | Yarn Resourcemanager Containers Reserved | count | The number of containers reserved. | |
| yarn.resourcemanager.containers.pending | Yarn Resourcemanager Containers Pending | count | The number of containers pending. | |
| yarn.resourcemanager.usedAMResourcememory | Yarn Resourcemanager AM Used Resource Memory | MB | The memory resources used for Application Masters (in MB). | |
| yarn.resourcemanager.usedAMResource.vCores | Yarn Resourcemanager AM Used Resource VCores | count | The vCpus used for Application Masters. | |
| yarn.resourcemanager.AMResourceLimit.memory | Yarn Resourcemanager AM Resource Limit Memory | MB | The maximum memory resources this queue can use for Application Masters (in MB). | |
| yarn.resourcemanager.queue.AMResourceLimit.vCores | Yarn Resourcemanager Queue AM Resource Limit VCores | count | The maximum vCpus this queue can use for Application Masters. | |
| yarn.resourcemanager.active.nodes | Yarn Resourcemanager Active Nodes | count | The number of active nodes. | |
| yarn.resourcemanager.decommissioned.nodes | Yarn Resourcemanager Decomissioned Nodes | count | The number of decommissioned nodes. | |
| yarn.resourcemanager.lost.nodes | Yarn Resourcemanager Lost Nodes | count | The number of lost nodes. | |
| yarn.resourcemanager.rebooted.nodes | Yarn Resourcemanager Rebooted Nodes | count | The number of rebooted nodes. | |
| yarn.resourcemanager.unhealthy.nodes | Yarn Resourcemanager Unhealthy Nodes | count | The number of unhealthy nodes. |
YarnNodeManager Template
Description
Testing
Prerequisites
No prerequisite
Supported Metric
| Monitor Name | Metric Name | Metric Display Name | Unit | Description |
|---|---|---|---|---|
| YarnNodeManager Monitor | yarn.nodemanager.containers_launched | Yarn Nodemanager Containers Launched | count | Number of containers launched. |
| yarn.nodemanager.containers_completed | Yarn Nodemanager Containers Completed | count | Number of containers completed. | |
| yarn.nodemanager.containers_failed | Yarn Nodemanager Containers Failed | count | Number of containers failed. | |
| yarn.nodemanager.containers_killed | Yarn Nodemanager Containers Killed | count | Number of containers killed. | |
| yarn.nodemanager.containers_initing | Yarn Nodemanager Containers Initing | count | Number of containers ininting. | |
| yarn.nodemanager.containers_running | Yarn Nodemanager Containers Running | count | Number of containers running. | |
| yarn.nodemanager.allocated_containers | Yarn Nodemanager Allocated Containers | count | Current number of allocated containers. | |
| yarn.nodemanager.allocated_vcores | Yarn Nodemanager Allocated Vcores | count | Current allocated Virtual Cores. | |
| yarn.nodemanager.available_vcores | Yarn Nodemanager Available Vcores | count | Available Virtual Cores. | |
| yarn.nodemanager.container_launch_duration_num_ops | Yarn Nodemanager Container Launch Duration Num Ops | count | Number of ops for container launch duration. | |
| yarn.nodemanager.container_launch_duration_avg_time | Yarn Nodemanager Container Launch Duration Avg Time | count | Average time for container launch duration. | |
| Average time for container launch duration | Yarn Nodemanager Num Active Sources | count | Number of active metrics sources. | |
| yarn.nodemanager.num_all_sources | Yarn Nodemanager Num All Sources | count | Number of all registered metrics sources. | |
| yarn.nodemanager.num_active_sinks | Yarn Nodemanager Num Active Sinks | count | Number of active metrics sinks. | |
| yarn.nodemanager.num_all_sinks | Yarn Nodemanager Num All Sinks | count | Number of all registered metrics sinks. | |
| yarn.nodemanager.snapshot_num_ops | Yarn Nodemanager Snapshot Num Ops | count | Number of ops for snapshot stats. | |
| yarn.nodemanager.snapshot_avg_time | Yarn Nodemanager Snapshot Avg Time | ms | Average time for snapshot stats. | |
| yarn.nodemanager.publish_num_ops | Yarn Nodemanager Publish Num Ops | count | Number of ops for publishing stats. | |
| yarn.nodemanager.publish_avg_time | Yarn Nodemanager Publish Avg Time | ms | Average time for publishing stats. |
Zookeeper Replicated JVM Template
Description
This template contains JVM monitors related to Zookeeper Replicated.
Prerequisites
No prerequisite
Supported Metric
| Monitor Name | Metric Name | Metric Display Name | Unit | Description |
|---|---|---|---|---|
| Zookeeper Replicated JVM Monitor | zookeper.replicated.jvm.daemon.thread.count | Zookeper Replicated JVM Daemon Thread Count | count | NULL |
| zookeper.replicated.jvm.gc.collection.count | Zookeper Replicated JVM GC Collection Count | count | NULL | |
| zookeper.replicated.jvm.heap_memory_committed | Zookeper Replicated JVM Heap Memory Committed | Bytes | NULL | |
| zookeper.replicated.jvm.heap_memory_init | Zookeper Replicated JVM Heap Memory Init | Bytes | NULL | |
| zookeper.replicated.jvm.heap_memory_max | Zookeper Replicated JVM Heap Memory Max | Bytes | NULL | |
| zookeper.replicated.jvm.heap_memory_used | Zookeper Replicated JVM Heap Memory Used | Bytes | NULL | |
| zookeper.replicated.jvm.memorypool.codecache.peak_usage_used | Zookeper Replicated JVM Memorypool Codecache Peak Usage Used | Bytes | NULL | |
| zookeper.replicated.jvm.memorypool.codecache.peak_usage_committed | Zookeper Replicated JVM Memorypool Codecache Peak Usage Committed | KB | NULL | |
| zookeper.replicated.jvm.memorypool.codecache.peak_usage_init | Zookeper Replicated JVM Memorypool Codecache Peak Usage Init | KB | NULL | |
| zookeper.replicated.jvm.memorypool.codecache.peak_usage_max | Zookeper Replicated JVM Memorypool Codecache Peak Usage Max | KB | NULL | |
| zookeper.replicated.jvm.memorypool.edenspace.peak_usage_used | Zookeper Replicated JVM Memorypool Edenspace Peak Usage Used | KB | NULL | |
| zookeper.replicated.jvm.memorypool.edenspace.peak_usage_committed | Zookeper Replicated JVM Memorypool.edenspace Peak Usage Committed | KB | NULL | |
| zookeper.replicated.jvm.memorypool.edenspace.peak_usage_init | Zookeper Replicated JVM Memorypool Edenspace Peak Usage Init | KB | NULL | |
| zookeper.replicated.jvm.memorypool.edenspace.peak_usage_max | Zookeper Replicated JVM Memorypool Edenspace Peak Usage Max | KB | NULL | |
| zookeper.replicated.jvm.memorypool.metaspace.peak_usage_used | Zookeper Replicated JVM Memorypool Metaspace Peak Usage Used | KB | NULL | |
| zookeper.replicated.jvm.memorypool.metaspace.peak_usage_committed | Zookeper Replicated JVM Memorypool.metaspace Peak Usage Committed | KB | NULL | |
| zookeper.replicated.jvm.memorypool.metaspace.peak_usage_init | Zookeper Replicated JVM Memorypool Metaspace Peak Usage Init | KB | NULL | |
| zookeper.replicated.jvm.memorypool.metaspace.peak_usage_max | Zookeper Replicated JVM Memorypool Metaspace Peak Usage Max | KB | NULL | |
| zookeper.replicated.jvm.memorypool.survivorspace.peak_usage_used | Zookeper Replicated JVM Memorypool Survivorspace Peak Usage | KB | NULL | |
| zookeper.replicated.jvm.memorypool.survivorspace.peak_usage_committed | Zookeper Replicated JVM Memorypool Survivorspace Peak Usage Committed | KB | NULL | |
| zookeper.replicated.jvm.memorypool.survivorspace.peak_usage_init | Zookeper Replicated JVM Memorypool Survivorspace Peak Usage Init | KB | NULL | |
| zookeper.replicated.jvm.memorypool.survivorspace.peak_usage_max | Zookeper Replicated JVM Memorypool Survivorspace Peak Usage Max | KB | NULL | |
| zookeper.replicated.jvm.memorypool.tenuredgen.peak_usage_used | Zookeper Replicated JVM Memorypool Tenuredgen Peak Usage Used | KB | NULL | |
| zookeper.replicated.jvm.memorypool.tenuredgen.peak_usage.init | Zookeper Replicated JVM Memorypool Tenuredgen Peak Usage Init | KB | NULL | |
| zookeper.replicated.jvm.memorypool.tenuredgen.peak_usage.max | Zookeper Replicated JVM Memorypool Tenuredgen Peak Usage Max | KB | NULL | |
| zookeper.replicated.jvm.memorypool.tenuredgen.peak_usage_committed | Zookeper Replicated JVM Memorypool Tenuredgen Peak Usage Committed | KB | NULL | |
| zookeper.replicated.jvm.non_heap_memory_committed | Zookeper Replicated JVM Non Heap Memory Committed | Bytes | NULL | |
| zookeper.replicated.jvm.non_heap_memory_init | Zookeper Replicated JVM Non Heap Memory Init | Bytes | NULL | |
| zookeper.replicated.jvm.non_heap_memory_max | Zookeper Replicated JVM Non Heap Memory Max | Bytes | NULL | |
| zookeper.replicated.jvm.non_heap_memory_used | Zookeper Replicated JVM Non Heap Memory Used | Bytes | NULL | |
| zookeper.replicated.jvm.thread.count | Zookeper Replicated JVM Thread Count | count | NULL | |
| zookeper.replicated.jvm.thread.current_cpu_time | Zookeper Replicated JVM Thread Current Cpu Time | ms | NULL | |
| zookeper.replicated.jvm.thread.current_user_time | Zookeper Replicated JVM Thread Current User Time | ms | NULL | |
| zookeper.replicated.jvm.thread.peakcount | Zookeper Replicated JVM Thread PeakCount | count | NULL |
Zookeeper Replicated Template
Description
This template contains monitor related to replicated zookeeper
Prerequisites
No prerequisite
Supported Metric
| Monitor Name | Metric Name | Metric Display Name | Unit | Description |
|---|---|---|---|---|
| Zookeeper Replicated Monitor | zookeeper.replicated.min.session.timeout | Zookeeper Replicated Min Session Timeout | microsec | Minimum session timeout. |
| zookeeper.replicated.max.session.timeout | Zookeeper Replicated Max Session Timeout | microsec | Maximum session timeout. | |
| zookeeper.replicated.client.connections_per_host.max | Zookeeper Replicated Max Client Connections Per Host | count | Maximum client connections per host. | |
| zookeeper.replicated.outstanding.requests | Zookeeper Replicated Outstanding RequestsZookeeper Replicated Outstanding Requests | count | The number of queued requests when the server is under load and is receiving more sustained requests than it can process. | |
| zookeeper.replicated.connections.alive | Zookeeper Replicated Alive Connections | count | The ZooKeeper connection count. | |
| zookeeper.replicated.request.latency.average | Zookeeper Replicated Average Request Latency | microsec | The average request latency | |
| zookeeper.replicated.request.latency.max | Zookeeper Replicated Max Request Latency | microsec | The max request latency. | |
| zookeeper.replicated.request.latency.min | Zookeeper Replicated Min Request Latency | microsec | The min request latency. | |
| zookeeper.replicated.packets.sent | Zookeeper Replicated Packets Sent | psec | The number of packets sent. | |
| zookeeper.replicated.packets.received | Zookeeper Replicated Packets Received | psec | The number of packets received. | |
| zookeeper.replicated.inmemory.datatree.watch.count | zookeeper.replicated.inmemory.datatree.watch.count | count | The number of watchers on the ZooKeeper nodes. | |
| zookeeper.replicated.inmemory.datatree.node.count | Zookeeper Replicated Inmemory Datatree Node Count | count | The ZooKeeper node count. |
Zookeper Standalone Jvm Template
Description
Testing
Prerequisites
No prerequisite
Supported Metric
| Monitor Name | Metric Name | Metric Display Name | Unit | Description |
|---|---|---|---|---|
| Zookeper Standalone Jvm Monitor | zookeper.standalone.jvm.daemon.thread.count | Zookeper Standalone JVM Daemon Thread Count | count | NULL |
| zookeper.standalone.jvm.gc.collection.count | Zookeper Standalone JVM GC Collection Count | count | NULL | |
| zookeper.standalone.jvm.heap_memory_committed | Zookeper Standalone JVM Heap Memory Committed | Bytes | NULL | |
| zookeper.standalone.jvm.heap_memory_init | Zookeper Standalone JVM Heap Memory Init | Bytes | NULL | |
| zookeper.standalone.jvm.heap_memory_max | Zookeper Standalone JVM Heap Memory Max | Bytes | NULL | |
| zookeper.standalone.jvm.heap_memory_used | Zookeper Standalone JVM Heap Memory Used | Bytes | NULL | |
| zookeper.standalone.jvm.memorypool.codecache.peak_usage_used | Zookeper Standalone JVM Memorypool Codecache Peak Usage Used | Bytes | NULL | |
| zookeper.standalone.jvm.memorypool.codecache.peak_usage_committed | Zookeper Standalone JVM Memorypool Codecache Peak Usage Committed | KB | NULL | |
| zookeper.standalone.jvm.memorypool.codecache.peak_usage_init | Zookeper Standalone JVM Memorypool Codecache Peak Usage Init | KB | NULL | |
| zookeper.standalone.jvm.memorypool.codecache.peak_usage_max | Zookeper Standalone JVM Memorypool Codecache Peak Usage Max | KB | NULL | |
| zookeper.standalone.jvm.memorypool.edenspace.peak_usage_used | Zookeper Standalone JVM Memorypool Edenspace Peak Usage Used | KB | NULL | |
| zookeper.standalone.jvm.memorypool.edenspace.peak_usage_committed | Zookeper Standalone JVM Memorypool.edenspace Peak Usage Committed | KB | NULL | |
| zookeper.standalone.jvm.memorypool.edenspace.peak_usage_init | Zookeper Standalone JVM Memorypool Edenspace Peak Usage Init | KB | NULL | |
| zookeper.standalone.jvm.memorypool.edenspace.peak_usage_max | Zookeper Standalone JVM Memorypool Edenspace Peak Usage Max | KB | NULL | |
| zookeper.standalone.jvm.memorypool.metaspace.peak_usage_used | Zookeper Standalone JVM Memorypool Metaspace Peak Usage Used | KB | NULL | |
| zookeper.standalone.jvm.memorypool.metaspace.peak_usage_committed | Zookeper Standalone JVM Memorypool.metaspace Peak Usage Committed | KB | NULL | |
| zookeper.standalone.jvm.memorypool.metaspace.peak_usage_init | Zookeper Standalone JVM Memorypool Metaspace Peak Usage Init | KB | NULL | |
| zookeper.standalone.jvm.memorypool.metaspace.peak_usage_max | Zookeper Standalone JVM Memorypool Metaspace Peak Usage Max | KB | NULL | |
| zookeper.standalone.jvm.memorypool.survivorspace.peak_usage_used | Zookeper Standalone JVM Memorypool Survivorspace Peak Usage | KB | NULL | |
| zookeper.standalone.jvm.memorypool.survivorspace.peak_usage_committed | Zookeper Standalone JVM Memorypool Survivorspace Peak Usage Committed | KB | NULL | |
| zookeper.standalone.jvm.memorypool.survivorspace.peak_usage_init | Zookeper Standalone JVM Memorypool Survivorspace Peak Usage Init | KB | NULL | |
| zookeper.standalone.jvm.memorypool.survivorspace.peak_usage_max | Zookeper Standalone JVM Memorypool Survivorspace Peak Usage Max | KB | NULL | |
| zookeper.standalone.jvm.memorypool.tenuredgen.peak_usage_used | Zookeper Standalone JVM Memorypool Tenuredgen Peak Usage Used | KB | NULL | |
| zookeper.standalone.jvm.memorypool.tenuredgen.peak_usage.init | Zookeper Standalone JVM Memorypool Tenuredgen Peak Usage Init | KB | NULL | |
| zookeper.standalone.jvm.memorypool.tenuredgen.peak_usage.max | Zookeper Standalone JVM Memorypool Tenuredgen Peak Usage Max | KB | NULL | |
| zookeper.standalone.jvm.memorypool.tenuredgen.peak_usage_committed | Zookeper Standalone JVM Memorypool Tenuredgen Peak Usage Committed | KB | NULL | |
| zookeper.standalone.jvm.non_heap_memory_committed | Zookeper Standalone JVM Non Heap Memory Committed | Bytes | NULL | |
| zookeper.standalone.jvm.non_heap_memory_init | Zookeper Standalone JVM Non Heap Memory Init | Bytes | NULL | |
| zookeper.standalone.jvm.non_heap_memory_max | Zookeper Standalone JVM Non Heap Memory Max | Bytes | NULL | |
| zookeper.standalone.jvm.non_heap_memory_used | Zookeper Standalone JVM Non Heap Memory Used | Bytes | NULL | |
| zookeper.standalone.jvm.thread.count | Zookeper Standalone JVM Thread Count | count | NULL | |
| zookeper.standalone.jvm.thread.current_cpu_time | Zookeper Standalone JVM Thread Current Cpu Time | ms | NULL | |
| zookeper.standalone.jvm.thread.current_user_time | Zookeper Standalone JVM Thread Current User Time | ms | NULL | |
| zookeper.standalone.jvm.thread.peakcount | Zookeper Standalone JVM Thread PeakCount | count | NULL |
Zookeper Standalone Template
Description
Testing
Prerequisites
No prerequisite
Supported Metric
| Monitor Name | Metric Name | Metric Display Name | Unit | Description |
|---|---|---|---|---|
| Zookeper Standalone Monitor | zookeper.standalone.alive.connections | Zookeper Standalone Alive Connections | count | The ZooKeeper connection count. |
| zookeper.standalone.request.latency.max | Zookeper Standalone Request Latency Max | ms | The max request latency. | |
| zookeper.standalone.request.latency.average | Zookeper Standalone Request Latency Average | ms | The average request latency. | |
| zookeper.standalone.request.latency.min | Zookeper Standalone Request Latency Min | ms | The min request latency. | |
| zookeper.standalone.packets.sent | Zookeper Standalone Packets Sent | psec | The number of packets sent. | |
| zookeper.standalone.packets.received | Zookeper Standalone Packets Received | psec | The number of packets received. | |
| zookeper.standalone.outstanding.requests | Zookeper Standalone Outstanding Requests | count | The number of queued requests when the server is under load and is receiving more sustained requests than it can process. | |
| zookeper.standalone.client.connections_per_host.max | Zookeper Standalone Client Connections Per Host Max | count | Maximum client connections per host. | |
| zookeper.standalone.connections.latency.min | Zookeper Standalone Connections Latency Min | ms | The min connections latency. | |
| zookeper.standalone.connections.latency.max | Zookeper Standalone Connections Latency Max | ms | The max connections latency. | |
| zookeper.standalone.connections.latency.average | Zookeper Standalone Connections Latency Average | ms | The average connections latency. | |
| zookeper.standalone.connections.packets.sent | Zookeper Standalone Connections Packets Sent | psec | The number of packets sent. | |
| zookeper.standalone.connections.packets.received | Zookeper Standalone Connections Packets Received | psec | The number of packets received. | |
| zookeper.standalone.connections.outstanding requests | Zookeper Standalone Connections Outstanding Requests | psec | The number of outstanding requests.. | |
| zookeper.standalone.inmemory.datatree.watch.count | Zookeper Standalone Inmemory Datatree Watch Count | count | The number of watchers on the ZooKeeper nodes. | |
| zookeper.standalone.inmemory.datatree.node.count | Zookeper Standalone Inmemory Datatree Node Count | count | The ZooKeeper node count. |
Zyxel 2024PWR Switch - Hardware Monitoring
Description
Template to monitor the zyxel 2024PWR switch parameters like temperature,voltage and fan speed.
Prerequisites
No prerequisite
Supported Metric
| Monitor Name | Metric Name | Metric Display Name | Unit | Description |
|---|---|---|---|---|
| Zyxel 2024PWR Fan Speed | zyxel_2024pwr_FanRpmCurValue | Zyxel 2024PWR Fan Speed | rpm | Monitors the zyxel 2024PWR switch fan speed.[ZYXEL-ES2024PWR-MIB::fanRpmCurValue:1.3.6.1.4.1.890.1.5.8.27.23.1.1.2]. |
| Zyxel 2024PWR Voltage | zyxel_2024pwr_VoltageCurValue | Zyxel 2024PWR Voltage Value | v | Monitors the zyxel 2024PWR switch voltage.[ZYXEL-ES2024PWR-MIB::voltageCurValue:1.3.6.1.4.1.890.1.5.8.27.23.3.1.2]. |
| Zyxel 2024PWR Temperature | zyxel_2024pwr_TempCurValue | Zyxel 2024PWR Temperature Value | Celsius | Monitors the zyxel 2024PWR temperature.[ZYXEL-ES2024PWR-MIB::tempCurValue:1.3.6.1.4.1.890.1.5.8.27.23.2.1.2]. |
Zyxel 2024PWR Switch - Performance Monitoring
Description
Template to monitor the 2024PWR switch CPU Utilization.
Prerequisites
No prerequisite
Supported Metric
| Monitor Name | Metric Name | Metric Display Name | Unit | Description |
|---|---|---|---|---|
| Zyxel 2024PWR CPU Utilization | zyxel_2024pwr_SysMgmtCPUUsage | Zyxel 2024PWR CPU Usage | % | Provides the zyxel 2024PWR switch CPU utilization.[ZYXEL-ES2024PWR-MIB::sysMgmtCPUUsage:1.3.6.1.4.1.890.1.5.8.27.9.7.0]. |
Zyxel ES2024A - System Performance
Description
Template to monitor the zyxel ES2024A system performance parameters like CPU Utilization,Memory Pool Utilization.
Prerequisites
No prerequisite
Supported Metric
| Monitor Name | Metric Name | Metric Display Name | Unit | Description |
|---|---|---|---|---|
| ZYXEL ES2024A - System CPU Utilization | zyxel_es2024a_SysMgmtCPUUsage | Zyxel ES2024A CPU Usage | % | Monitors the CPU load in %.[ZYXEL-ES2024A-MIB :: sysMgmtCPUUsage : 1.3.6.1.4.1.890.1.5.8.16.9.7.0] |
| ZYXEL ES2024A - System Memory Pool Utilization | zyxel_es2024a_SysMemoryPoolUtil | Zyxel ES2024A Memory Pool Utilization | % | Provides the utilization of memory pool.[ZYXEL-ES2024A-MIB :: sysMemoryPoolTotal : 1.3.6.1.4.1.890.1.5.8.16.124.1.1.3,sysMemoryPoolUsed : 1.3.6.1.4.1.890.1.5.8.16.124.1.1.4] |
| zyxel_es2024a_SysMemoryPoolTotal | Zyxel ES2024A Memory Pool Total | Bytes | Provides the total size of memory pool in bytes.[ZYXEL-ES2024A-MIB :: sysMemoryPoolTotal : 1.3.6.1.4.1.890.1.5.8.16.124.1.1.3] | |
| zyxel_es2024a_SysMemoryPoolUsed | Zyxel ES2024A Memory Pool Used | Bytes | Provides the used size of memory pool in bytes.[ZYXEL-ES2024A-MIB :: sysMemoryPoolUsed : 1.3.6.1.4.1.890.1.5.8.16.124.1.1.4] |
Zyxel GS2200-24 Switch - Performance Monitoring
Description
Template to monitor the zyxel GS2200-24 performance parameters like CPU Utilization,Memory Utilization.
Prerequisites
No prerequisite
Supported Metric
| Monitor Name | Metric Name | Metric Display Name | Unit | Description |
|---|---|---|---|---|
| Zyxel GS2200-24 CPU Utilization | zyxel_gs2200-24_sysMgmtCPUUsage | Zyxel GS2200-24 CPU Utilization | % | Monitors the zyxel GS2200-24 CPU utilization.[ZYXEL-GS2200-24-MIB::sysMgmtCPUUsage:1.3.6.1.4.1.890.1.5.8.55.12.7.0] |
| Zyxel GS2200-24 Memory Utilization | zyxel_gs2200-24_sysMemoryPoolUsed | Zyxel GS2200-24 Memory Pool Used | Bytes | Provides the used size of memory pool in bytes.[ZYXEL-GS2200-24-MIB::sysMemoryPoolUsed:1.3.6.1.4.1.890.1.5.8.55.124.1.1.4] |
| zyxel_gs2200-24_sysMemoryPoolTotal | Zyxel GS2200-24 Memory Pool Total | Bytes/Sec | Provides the total size of memory pool in bytes.[ZYXEL-GS2200-24-MIB::sysMemoryPoolTotal:1.3.6.1.4.1.890.1.5.8.55.124.1.1.3]. | |
| zyxel_gs2200-24_SysMemoryPoolUtil | Zyxel GS2200-24 Memory Utilization | % | Provides the utilization of memory pool.[ZYXEL-GS2200-24-MIB::sysMemoryPoolTotal:1.3.6.1.4.1.890.1.5.8.55.124.1.1.3,sysMemoryPoolUsed:1.3.6.1.4.1.890.1.5.8.55.124.1.1.4]. |
Zyxel GS2200-24 Switch - Hardware Monitoring
Description
Template to monitor the zyxel GS2200-24 switch parameters like temperature,voltage.
Prerequisites
No prerequisite
Supported Metric
| Monitor Name | Metric Name | Metric Display Name | Unit | Description |
|---|---|---|---|---|
| Zyxel GS2200-24 Temperature | zyxel_gs2200-24_tempCurValue | Zyxel GS2200-24 Temperature Value | Celsius | Monitors the zyxel GS2200-24 temperature.[ZYXEL-GS2200-24-MIB::tempCurValue:1.3.6.1.4.1.890.1.5.8.55.9.2.1.2]. |
| Zyxel GS2200-24 Voltage | zyxel_gs2200-24_voltageCurValue | Zyxel GS2200-24 Voltage Value | v | Monitors the zyxel GS2200-24 switch voltage.[ZYXEL-GS2200-24-MIB::voltageCurValue:1.3.6.1.4.1.890.1.5.8.55.9.3.1.2]. |
Zyxel GS4012F Switch - Hardware Monitoring
Description
Template to monitor the zyxel GS4012F switch parameters like temperature,voltage and fan speed.
Prerequisites
No prerequisite
Supported Metric
| Monitor Name | Metric Name | Metric Display Name | Unit | Description |
|---|---|---|---|---|
| Zyxel GS4012F Fan Speed | zyxel_gs4012f_fanRpmCurValue | Zyxel GS4012F Fan Speed | rpm | Monitors the zyxel GS4012F fan speed[.ZYXEL-GS4012F-MIB::fanRpmCurValue:1.3.6.1.4.1.890.1.5.8.20.9.1.1.2]. |
| Zyxel GS4012F Temperature | zyxel_gs4012f_tempCurValue | Zyxel GS4012F Temperature | Celsius | Monitors the zyxel GS4012F switch temperature.[ZYXEL-GS4012F-MIB::tempCurValue:1.3.6.1.4.1.890.1.5.8.20.9.2.1.2]. |
| Zyxel GS4012F Voltage | zyxel_gs4012f_voltageCurValue | Zyxel GS4012F Voltage | v | Monitors the zyxel GS4012F voltage.[ZYXEL-GS4012F-MIB::voltageCurValue:1.3.6.1.4.1.890.1.5.8.20.9.3.1.2]. |
Zyxel GS4012F Switch - Performance Monitoring
Description
Template to monitor the zyxel GS4012F switch CPU Utilization.
Prerequisites
No prerequisite
Supported Metric
| Monitor Name | Metric Name | Metric Display Name | Unit | Description |
|---|---|---|---|---|
| Zyxel GS4012F CPU Utilization | zyxel_gs4012f_sysMgmtCPUUsage | Zyxel GS4012F CPU Utilization | % | Monitors the zyxel GS4012F switch cpu utilization.[ZYXEL-GS4012F-MIB::sysMgmtCPUUsage:1.3.6.1.4.1.890.1.5.8.20.12.7]. |
Zyxel IE5000 Switch - Hardware Monitoring
Description
Template to monitor the zyxel IE5000 switch parameters like temperature,voltage and fan speed.
Prerequisites
No prerequisite
Supported Metric
| Monitor Name | Metric Name | Metric Display Name | Unit | Description |
|---|---|---|---|---|
| Zyxel IE5000 Fan Speed | zyxel_ie5000_FanRpmCurValue | Zyxel IE5000 Fan Speed | rpm | Monitors the zyxel IE5000 switch fan speed.[ZYXEL-IES5000-MIB::fanRpmCurValue:1.3.6.1.4.1.890.1.5.13.5.11.3.1.1.2]. |
| Zyxel IE5000 Temperature | zyxel_ie5000_TemperatureCurValue | Zyxel IE5000 Temperature Value | Celsius | Monitors the zyxel IE5000 switch temperature.[ZYXEL-IES5000-MIB::temperatureCurValue:1.3.6.1.4.1.890.1.5.13.5.11.3.3.1.2]. |
| Zyxel IE5000 Voltage | zyxel_ie5000_VoltageCurValue | Zyxel IE5000 Voltage Value | v | Monitors the zyxel IE5000 switch voltage.[ZYXEL-IES5000-MIB::voltageCurValue:1.3.6.1.4.1.890.1.5.13.5.11.3.2.1.2]. |
Zyxel IE5000 Switch - Performance Monitoring
Description
Template to monitor the zyxel IE5000 performance parameters like CPU Utilization,Memory Utilization.
Prerequisites
No prerequisite
Supported Metric
| Monitor Name | Metric Name | Metric Display Name | Unit | Description |
|---|---|---|---|---|
| Zyxel IE5000 CPU Utilization | zyxel_ie5000_CpuCurValue | Zyxel IE5000 CPU Utilization | % | Monitors the CPU load in %.[ZYXEL-IES5000-MIB::cpuCurValue:1.3.6.1.4.1.890.1.5.13.5.11.3.4.1.2]. |
| Zyxel IE5000 Memory Utilization | zyxel_ie5000_MemoryCurValue | Zyxel IE5000 Memory Utilization | % | Monitors the zyxel IE5000 switch memory utilization.[ZYXEL-IES5000-MIB::memoryCurValue:1.3.6.1.4.1.890.1.5.13.5.11.3.6.1.2]. |
Zyxel MGS3712 Switch - Hardware Monitoring
Description
Template to monitor the zyxel MGS3712 switch parameters like temperature,voltage and fan speed.
Prerequisites
No prerequisite
Supported Metric
| Monitor Name | Metric Name | Metric Display Name | Unit | Description |
|---|---|---|---|---|
| Zyxel MGS3712 Fan Speed | zyxel_mgs3712_FanRpmCurValue | Zyxel MGS3712 Fan Speed | rpm | Monitors the zyxel MGS3712 fan speed.[ZYXEL-MGS3712-MIB::fanRpmIndex:1.3.6.1.4.1.890.1.5.8.47.8.1.1.1,fanRpmCurValue:1.3.6.1.4.1.890.1.5.8.47.8.1.1.2]. |
| Zyxel MGS3712 Temperature | zyxel_mgs3712_TemperatureCurValue | Zyxel MGS3712 Temperature Value | Celsius | Monitors the zyxel MGS3712 switch temperature.[ZYXEL-MGS3712-MIB::tempCurValue:1.3.6.1.4.1.890.1.5.8.47.8.2.1.2]. |
| Zyxel MGS3712 Voltage | zyxel_mgs3712_VoltageCurValue | Zyxel MGS3712 Voltage Value | v | Monitors the zyxel MGS3712 voltage.[ZYXEL-MGS3712-MIB::voltageIndex:1.3.6.1.4.1.890.1.5.8.47.8.3.1.1,voltageCurValue:1.3.6.1.4.1.890.1.5.8.47.8.3.1.2]. |
Zyxel MGS3712 Switch - Performance Monitoring
Description
Template to monitor the zyxel GS3712 performance parameters like CPU Utilization.
Prerequisites
No prerequisite
Supported Metric
| Monitor Name | Metric Name | Metric Display Name | Unit | Description |
|---|---|---|---|---|
| ZYXEL MGS3712 CPU Utilization | zyxel_mgs3712_SysMgmtCPUUsage | Zyxel MGS3712 CPU Utilization | % | Monitors zyxel MGS3712 switch CPUutilization.[ZYXEL-MGS3712-MIB::sysMgmtCPUUsage:1.3.6.1.4.1.890.1.5.8.47.11.7.0]. |
Zyxel Performance
Description
Template to monitor zyxel performance parameters like CPU Utilization & Memory Utilization.[ZYXEL-ES-COMMON :: sysMgmtCPU5MinUsage : 1.3.6.1.4.1.890.1.15.3.2.9.0,sysMgmtMemUsage : 1.3.6.1.4.1.890.1.15.3.2.5.0].Validated on Zyxel GS 1900(1900-24E) series switch.
Prerequisites
No prerequisite
Supported Metric
| Monitor Name | Metric Name | Metric Display Name | Unit | Description |
|---|---|---|---|---|
| Zyxel Performance Monitor | zyxel_mem_SysMgmtMemUsage | Zyxel Memory Utilization | % | Monitors the device memory usage (%).[ZYXEL-ES-COMMON :: sysMgmtMemUsage : 1.3.6.1.4.1.890.1.15.3.2.5.0]. |
| zyxel_cpu_SysMgmtCPU5MinUsage | Zyxel CPU Utilization | % | Monitors the Average CPU usage in 5 minutes. (%).[ZYXEL-ES-COMMON :: sysMgmtCPU5MinUsage : 1.3.6.1.4.1.890.1.15.3.2.9.0]. |
Zyxel VES-1608FE-57 Switch - Hardware Monitoring
Description
Template to monitor the zyxel VES-1608FE-57 switch parameters like temperature,voltage and fan speed.
Prerequisites
No prerequisite
Supported Metric
| Monitor Name | Metric Name | Metric Display Name | Unit | Description |
|---|---|---|---|---|
| Zyxel VES-1608FE-57 Fan Speed | zyxel_ves1608fe-57_FanRpmCurValue | Zyxel VES-1608FE-57 Fan Speed | rpm | Monitors the zyxel VES-1608FE-57 switch fan speed.[ZYXEL-ves1608FE57-MIB::fanRpmCurValue:1.3.6.1.4.1.890.1.5.12.43.9.1.1.2]. |
| Zyxel VES-1608FE-57 Temperature | zyxel_ves1608fe-57_TempCurValue | Zyxel VES-1608FE-57 Temperature Value | Celsius | Monitors the zyxel VES-1608FE-57 switch temperature.[ZYXEL-ves1608FE57-MIB::tempCurValue:1.3.6.1.4.1.890.1.5.12.43.9.2.1.2]. |
| Zyxel VES-1608FE-57 Voltage | zyxel_ves1608fe-57_VoltageCurValue | Zyxel VES-1608FE-57 Voltage Value | v | Monitors the zyxel VES-1608FE-57 switch voltage.[ZYXEL-ves1608FE57-MIB::voltageIndex:1.3.6.1.4.1.890.1.5.12.43.9.3.1.1,voltageCurValue:1.3.6.1.4.1.890.1.5.12.43.9.3.1.2]. |
Zyxel VES-1608FE-57 Switch - Performance Monitoring
Description
Template to monitor the zyxel VES-1608FE-57 performance parameters like CPU Utilization,Memory Utilization.
Prerequisites
No prerequisite
Supported Metric
| Monitor Name | Metric Name | Metric Display Name | Unit | Description |
|---|---|---|---|---|
| Zyxel VES-1608FE-57 Performance Monitoring | zyxel_ves1608fe-57_SysMgmtCPUUsage | Zyxel VES-1608FE-57 CPU Utilization | % | Provides the zyxel VES-1608FE-57 switch CPU utilization.[ZYXEL-ves1608FE57-MIB::sysMgmtCPUUsage:1.3.6.1.4.1.890.1.5.12.43.12.7.0]. |
| zyxel_ves1608fe-57_SysMgmtMemoryUsage | Zyxel VES-1608FE-57 Memory Utilization | % | Provides the zyxel VES-1608FE-57 switch memory utilization[ZYXEL-ves1608FE57-MIB::sysMgmtMemoryUsage:1.3.6.1.4.1.890.1.5.12.43.12.13.0]. |
Zyxel VES1724-56 - Hardware Monitoring
Description
Template to monitor the zyxel VES1724-56 parameters like temperature,voltage and fan speed.
Prerequisites
No prerequisite
Supported Metric
| Monitor Name | Metric Name | Metric Display Name | Unit | Description |
|---|---|---|---|---|
| Zyxel VES1724-56 Fan Speed | zyxel_ves1724_FanRpmCurValue | Zyxel VES1724 Fan Speed | rpm | Monitors the zyxel VES1724 switch fan speed.[ZYXEL-ves1724-56-MIB::fanRpmCurValue:1.3.6.1.4.1.890.1.5.12.46.9.1.1.2]. |
| Zyxel VES1724-56 Temperature | zyxel_ves1724_TempCurValue | Zyxel VES1724 Temperature Value | Celsius | Monitors the zyxel VES1724 switch temperature.[ZYXEL-ves1724-56-MIB::tempCurValue:1.3.6.1.4.1.890.1.5.12.46.9.2.1.2] |
| Zyxel VES1724-56 Voltage | zyxel_ves1724_VoltageCurValue | Zyxel VES1724 Voltage Value | v | Monitors the zyxel VES1724 switch voltage.[ZYXEL-ves1724-56-MIB::voltageCurValue:1.3.6.1.4.1.890.1.5.12.46.9.3.1.2]. |
Zyxel VES1724-56 - Performance Monitoring
Description
Template to monitor the zyxel VES1724-56 performance parameters like CPU Utilization,Memory Utilization.
Prerequisites
No prerequisite
Supported Metric
| Monitor Name | Metric Name | Metric Display Name | Unit | Description |
|---|---|---|---|---|
| Zyxel VES1724-56 Performance Monitoring | zyxel_ves1724_SysMgmtCPUUsage | Zyxel VES1724 CPU Utilization | % | Provides the Zyxel VES1724 switch CPU utilization.[ZYXEL-ves1724-56-MIB::sysMgmtCPUUsage:1.3.6.1.4.1.890.1.5.12.46.12.7.0]. |
| zyxel_ves1724_SysMgmtMemoryUsage | Zyxel VES1724 Memory Utilization | % | Provides the zyxel VES1724 switch memory utilization.[ZYXEL-ves1724-56-MIB::sysMgmtMemoryUsage:1.3.6.1.4.1.890.1.5.12.46.12.13.0]. |
Zyxel XGS4526 Switch - Hardware Monitoring
Description
Template to monitor the zyxel XGS4526 switch parameters like temperature,voltage and fan speed.
Prerequisites
No prerequisite
Supported Metric
| Monitor Name | Metric Name | Metric Display Name | Unit | Description |
|---|---|---|---|---|
| Zyxel XGS4526 Fan Speed | zyxel_xgs4526_FanRpmCurValue | Zyxel XGS4526 Fan Speed | rpm | Monitors the zyxel XGS4526 switch fan speed.[ZYXEL-XGS4526-MIB::fanRpmCurValue:1.3.6.1.4.1.890.1.5.8.52.9.1.1.2]. |
| Zyxel XGS4526 Temperature | zyxel_xgs4526_TempCurValue | Zyxel XGS4526 Temperature Value | Celsius | Monitors the Zyxel XGS4526 switch temperature.[ZYXEL-XGS4526-MIB::tempCurValue:1.3.6.1.4.1.890.1.5.8.52.9.2.1.2]. |
| Zyxel XGS4526 Voltage | zyxel_xgs4526_VoltageCurValue | Zyxel XGS4526 Voltage Value | v | Monitors the zyxel XGS4526 switch voltage.[ZYXEL-XGS4526-MIB::voltageCurValue:1.3.6.1.4.1.890.1.5.8.52.9.3.1.2]. |
Zyxel XGS4526 Switch - Performance Monitoring
Description
Template to monitor the zyxel XGS4526 Switch performance parameters like CPU Utilization,Memory Utilization.
Prerequisites
No prerequisite
Supported Metric
| Monitor Name | Metric Name | Metric Display Name | Unit | Description |
|---|---|---|---|---|
| Zyxel XGS4526 Switch - Performance Monitoring | zyxel_xgs4526_SysMemoryPoolUsed | Zyxel XGS4526 Memory Pool Used | Bytes | Provides the used size of memory pool in bytes.[ZYXEL-XGS4526-MIB::sysMemoryPoolUsed:1.3.6.1.4.1.890.1.5.8.52.124.1.1.4.0] |
| zyxel_xgs4526_SysMemoryPoolUtil | Zyxel XGS4526 Memory Utilization | % | Provides the utilization of memory pool.[ZYXEL-XGS4526-MIB::sysMemoryPoolTotal:1.3.6.1.4.1.890.1.5.8.52.124.1.1.3.0,sysMemoryPoolUsed:1.3.6.1.4.1.890.1.5.8.52.124.1.1.4.0] | |
| zyxel_xgs4526_SysMgmtCPUUsage | Zyxel XGS4526 CPU Utilization | % | Monitors the zyxel XGS4526 switch cpu utilization.[ZYXEL-XGS4526-MIB::sysMgmtCPUUsage:1.3.6.1.4.1.890.1.5.8.52.12.7.0]. | |
| zyxel_xgs4526_SysMemoryPoolTotal | Zyxel XGS4526 Memory Pool Total | Bytes | Provides the total size of memory pool in bytes.[ZYXEL-XGS4526-MIB::sysMemoryPoolTotal:1.3.6.1.4.1.890.1.5.8.52.124.1.1.3.0]. |
Zyxel ZyWALL - Performance Monitoring
Description
This template is applicable on Zyxel Zywall Firewalls. Monitors the prameters like CPU utilization,memory utilization.
Prerequisites
No prerequisite
Supported Metric
| Monitor Name | Metric Name | Metric Display Name | Unit | Description |
|---|---|---|---|---|
| Zyxel ZyWALL Performance Monitoring | zyxel_zywall_SysCPUUsage | Zyxel Zywall CPU Utilization | % | Provides the zyxel zywall firwall cpu utilization.[ZYXEL-ZYWALL-MIB::sysCPUUsage:1.3.6.1.4.1.890.1.6.1.1.1.0]. |
| zyxel_zywall_SysRAMUsage | Zyxel Zywall Memory Utilization | % | Provides the Zyxel zywall firewall memory utilization.[ZYXEL-ZYWALL-MIB::sysRAMUsage:1.3.6.1.4.1.890.1.6.1.1.3.0]. |
IMCI Open-i Station Environmental Statistics
Description
Monitors the IMCI Open-i Station Environmental Statistics like temperature state, temperature value, moisture sensor state, interface operational status, humdity sensor metrics like humidity state, humidity value. analog input humdity sensor metrics like humidity state and humidity value[ I-Station-MIB :: sensorCurrentValue : 1.3.6.1.4.1.1824.3.5.1.6, sensorState : 1.3.6.1.4.1.1824.3.5.1.16, alarmLogicalState : 1.3.6.1.4.1.1824.3.3.1.7, intOperStatus : 1.3.6.1.4.1.1824.3.9.1.26, aiUnitValue : 1.3.6.1.4.1.1824.3.18.1.19 , aiLogicalState : 1.3.6.1.4.1.1824.3.18.1.29 ].
Prerequisites
Device must have support for I-Station-MIB.
Supported Metric
| Monitor Name | Metric Name | Metric Display Name | Unit | Description |
|---|---|---|---|---|
| IMCI Istation Analog Input Humdity Sensor | istation_analoginput_HumidityState | Istation Analog Input Humidity State | Monitors the istation analog input statistics like humidity state.[ I-Station- MIB :: aiLogicalState : 1.3.6.1.4.1.1824.3.18.1.29 ] Possible Values are 1: Normal State; 2: Warning Low State; 3: WarningHighState; 4: DangerLowState; 5:Danger High State; 6: Range Low State; 7: Range High State; 8: Input Low State; 9: Input High State;10: Error State. | |
| istation_analoginput_HumidityValue | Istation Analoginput Humidity Value | % | Monitors the istation analog input statistics like humidity value.[ I-Station- MIB :: aiUnitValue : 1.3.6.1.4.1.1824.3.18.1.19 ] | |
| IMCI Istation Humidity Sensor | istation_sensor_HumidityValue | Istation Sensor Humidity Value | % | Monitors the i-station humdity sensor metric humidity value.[ I-Station- MIB :: sensorCurrentValue : 1.3.6.1.4.1.1824.3.5.1.6] |
| istation_sensor_HumidityState | Istation Sensor Humidity State | Monitors the i-station humdity sensor metric humidity State.[ I-Station-MIB :: sensorState : 1.3.6.1.4.1.1824.3.5.1.16].Possible Values are 1: Normal; 2: Danger High; 4: Warning High; 5: Warning Low; 6: dangerLow; 7: notRead. | ||
| IMCI Istation Temperature Sensor | istation_sensor_TemperatureValue | Istation Sensor Temperature Value | C | Monitors the i-station temperature sensor metric temperature value.[ I-Station- MIB :: sensorCurrentValue : 1.3.6.1.4.1.1824.3.5.1.6] |
| istation_sensor_TemperatureState | Istation Sensor Temperature State | Monitors the i-station temperature sensor metric temperature state.[ I-Station- MIB :: sensorState : 1.3.6.1.4.1.1824.3.5.1.16].Possible Values are 1: Normal; 2: Danger High; 4: Warning High; 5: Warning Low; 6: dangerLow; 7: notRead. | ||
| IMCI Istation Moisture Sensor | istation_moisture_SensorState | Istation Moisture Sensor State | Monitors the i-station moisture sensor state.[ I-Station- MIB :: alarmLogicalState : 1.3.6.1.4.1.1824.3.3.1.7 ].Possible Values are 1: No Alarm; 2:Active Alarm; 3:Not Applicable. | |
| IMCI Istation Link Status Monitor | istation_interface_OperationalStatus | Istation Interface Operational Status | Monitors the i-station interface operational status.[ I-Station- MIB :: intOperStatus : 1.3.6.1.4.1.1824.3.9.1.26].Possible Values are 1: unknown; 2: Offline; 3: Online; 4: NotApplicable. |