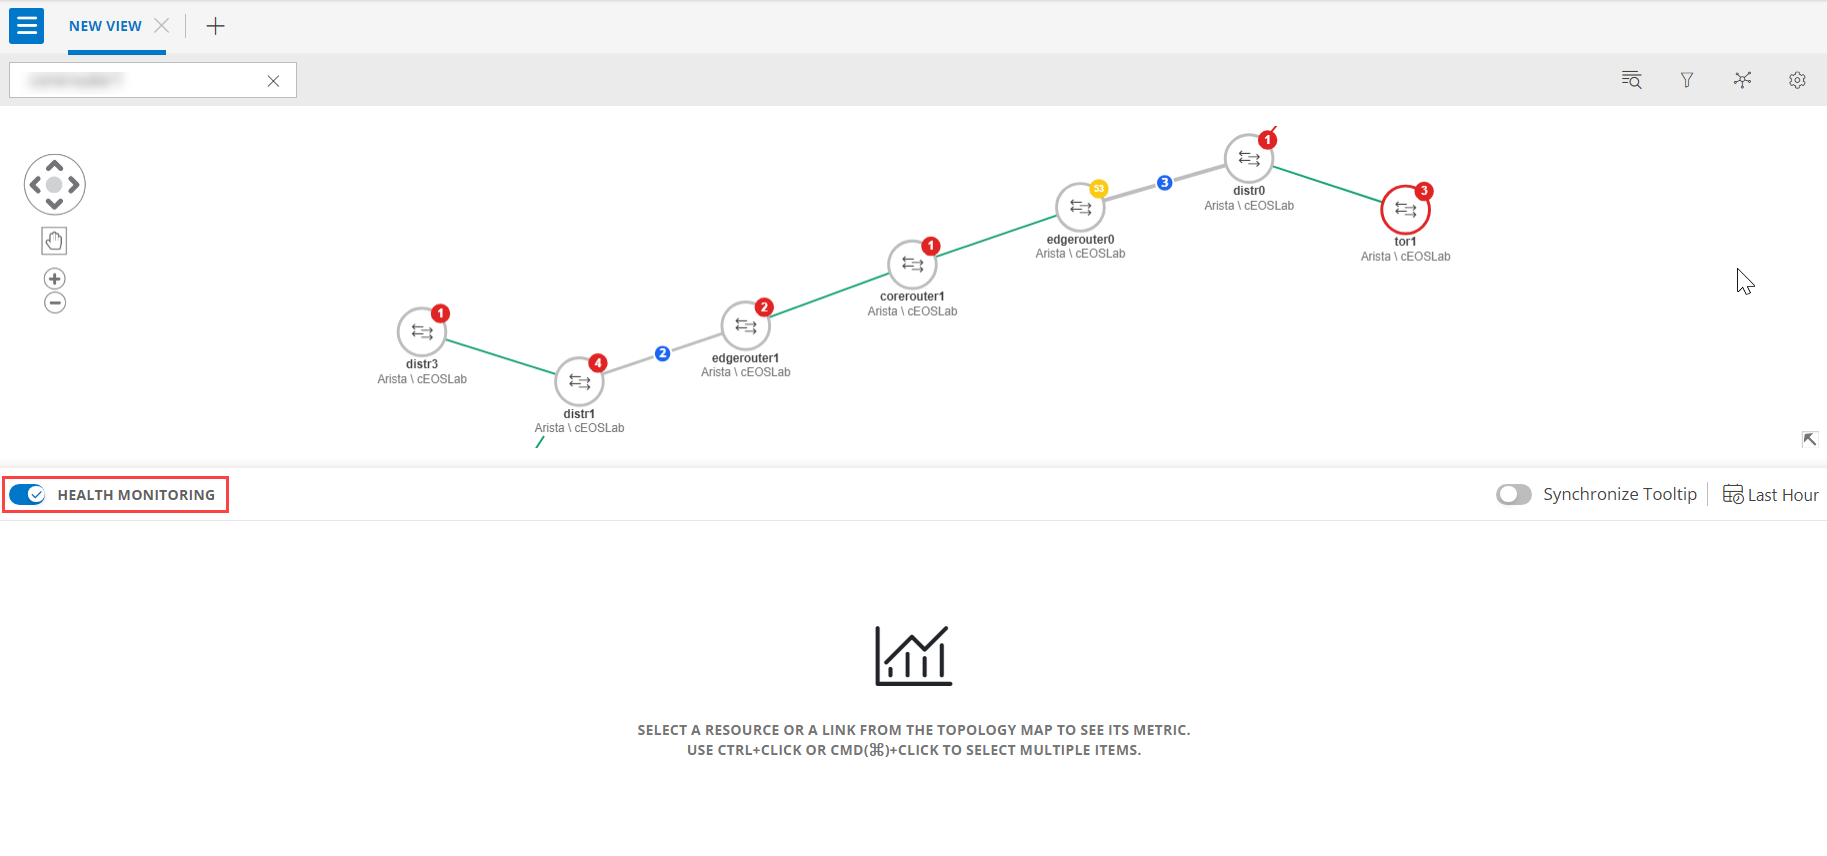
OpsRamp introduced a Network Health Monitoring feature that tracks the performance and health of devices in the enhanced UI of the Network Topology feature. This revamped UI is now available in beta and comes with a sleeker design that incorporates significant improvements in the backend engine. You will find additional advanced features on the new UI.
One notable enhancement is the dynamic information that appears as you hover over any link or edge in the topology. This feature provides instant insights into network components relationships and connections.
Additionally, we have introduced a comprehensive health monitoring feature. By leveraging the templates assigned to each node, this functionality delivers real-time statistics about the health and performance of edges and nodes. This enables you to identify and address potential issues before they impact your network.
A particularly valuable aspect of this update is the glimpse it offers into node alert statistics. Each node now provides a snapshot of its alert status, allowing you to quickly assess any critical alerts that might require your attention.
Use the HEALTH MONITORING toggle button to view the metrics of node or a link.
Availability - Node and Link
You can monitor the Nodes and link’s health on the Topology dashboard. A unique color distinguishes each severity level. Using color-coded indicators, the dashboard indicates when a critical or warning alert is generated.
In all views, the system applies color codes to alert you to areas requiring attention.
If you hover your cursor over any time point on the node, the availability and information such as CPU and Memory percentage will be displayed in the tooltip.
If you hover your cursor over any time point on the link, the availability and error details information will be displayed in the tooltip.
The topology map includes representations of non-monitored interfaces, which are depicted as dashed lines when one or more interfaces are not being monitored.
Alert count - Node and Link
The topology also displays nodes and link alert counts on the topology dashboard. When a critical or warning alert is generated, the number of alerts per severity level is displayed at that instant.
When you click on the alert count, you will be redirected to the alerts page. You can click on each alert and take necessary action such as suppress, acknowledge, or create an incident.
View Metrics
You can view the metrics of nodes or links under the Health Monitoring section. You can either select a single node/link or select multiple nodes/links and view the metrics accordingly.
Use CTRL+CLICK or CMD(⌘)+CLICK to select multiple items.
You can use Synchronize Tooltip to view the parameters across multiple charts of the selected metrics. Use the Synchronize Tooltip toggle button to enable or disable the tooltip.