Record your transactions on the website using Selenium IDE and later create scripts of the recording.
Prerequisites
- Use Chrome browser version 69 or above.
- Install the latest Selenium IDE in the Chrome browser.
Install Selenium IDE extension in the browser for the first time
Use the Selenium IDE extension from Google Chrome to record the transactions. To add the Selenium IDE extension, click Install Selenium IDE.
- Add Selenium IDE as an extension to the browser.
- The Selenium IDE extension in Google Chrome versions above 69 is supported.
Record a transaction using Selenium IDE
After installing the Selenium IDE, start recording each action performed on a website. After completing the recording of the transaction, Selenium IDE reviews each recorded action and saves the recording to the location.
Start recording
Start recording the transaction using the Selenium IDE extension installed in the Chrome browser.
- Click the Selenium IDE extension icon displayed in the Chrome browser.
Welcome to Selenium IDE! window is displayed.
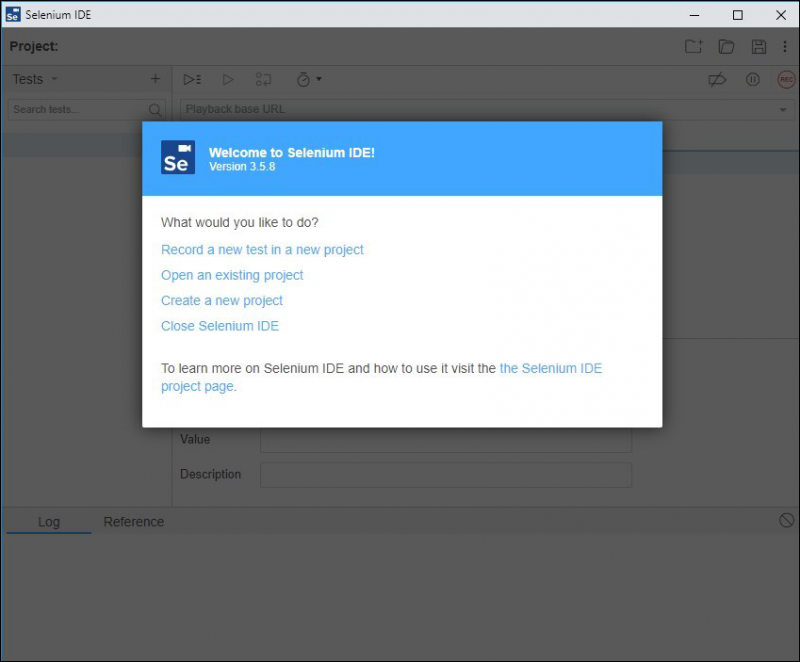
- Click Record a new test in a new project. For an existing project, click Open an existing page and select the project from its saved location.
- From the Name your new project window, provide a name for the project in the Project Name field. For example, enter PROJECT 1 in the Project Name field.
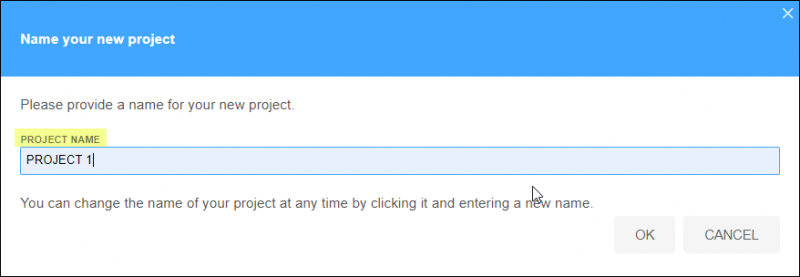
- Click OK to proceed.
- From the Set your project base URL window, enter the URL in Base URL.
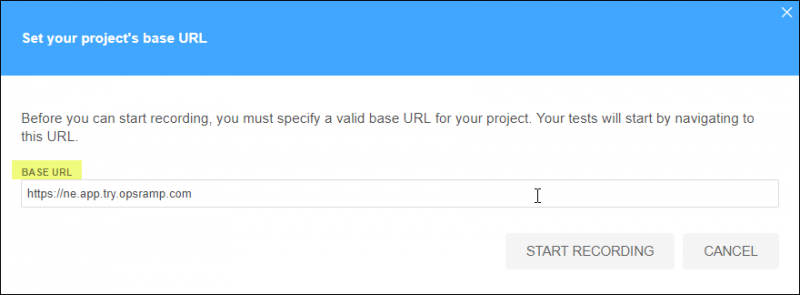
- Click START RECORDING.
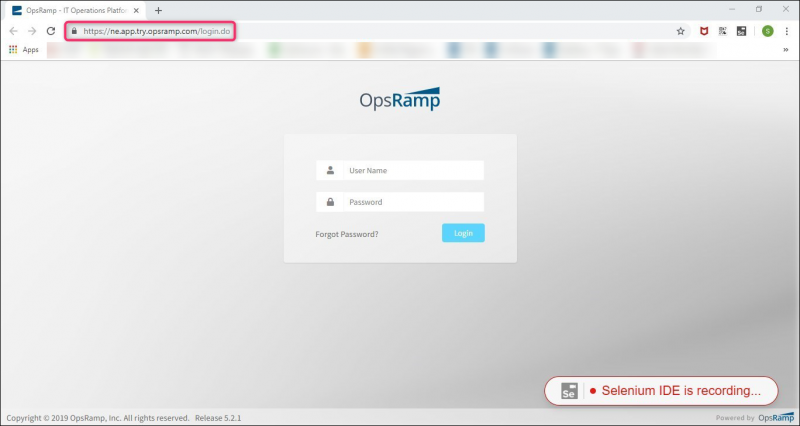
- Navigates automatically to the URL entered in the Base URL field. For example: Navigates automatically to the login page of URL: https://ne.app.try.opsramp.com.
- Do all transactions on the website. The Selenium-IDE captures all actions performed on the website while recording.
- The browser window displays Selenium IDE is recording… throughout the recording process.
- Selenium IDE does not record a few commands and must be manually entered by the user.
Stop recording
After capturing the actions on the website, stop recording the transaction in the Selenium IDE.
- Click Stop Recording icon in the Selenium IDE window.
- From Name your new test screen. enter the name of the test in TEST NAME. For example, enter TEST 1 in the TEST NAME field.
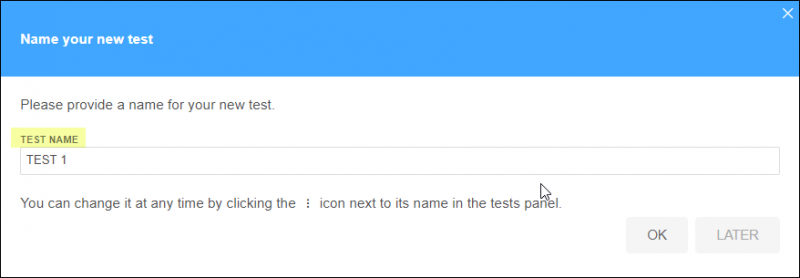
- Click OK to proceed further. Navigates to the Selenium IDE window.
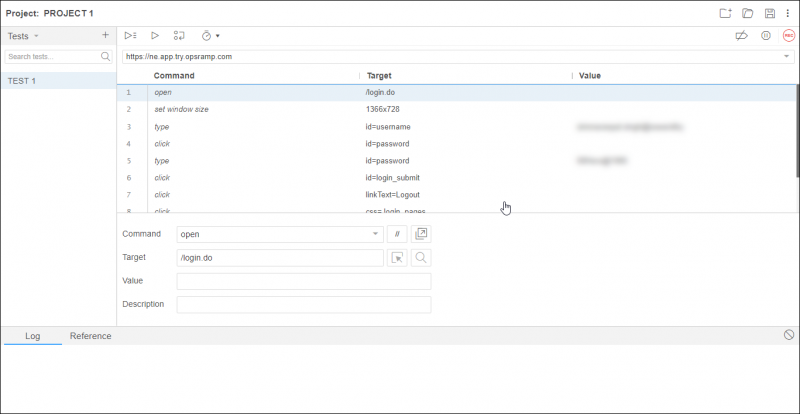
- The Command, Target, and Value columns display the actions, paths, and values entered on the webpage while recording the transaction.
Review recording
After the recording stops, use Run current test icon to inspect the issues in the saved recording. for any issue, use Start Recording and Stop Recording to repeat instructions.
The Log section in Selenium IDE displays the following:
- Details for each reviewed step.
- A completed successfully message after finishing the review process.
Save recording
After the successful completion and review of the recording, save the recorded script to a local machine as a .side file.
Click Save in the Selenium IDE window. Save the file to a location in the local machine.
- Ensure to save the file as the .side file type.
- Selenium IDE saves the .side file using the project name configured during the creation of the new project.
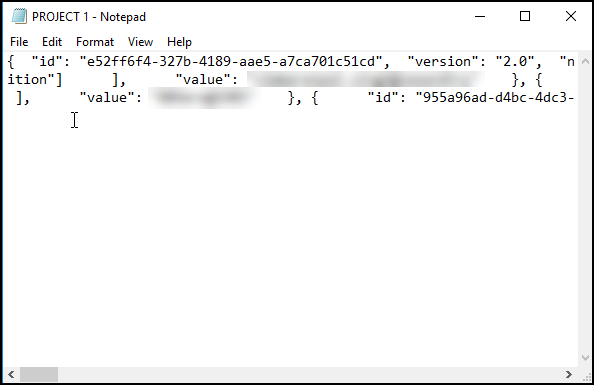
Open the .side file from the saved location in the local machine to view the file contents.
Add a synthetic monitor for the script
After saving the .side file, create a synthetic monitor to use the recording.
Go to Infrastructure > Resources.
Select Synthetics.
Select ADD.
In the Type list, select SCRIPT – HTTP Synthetic Transaction.
Enter the Name of the synthetic monitor.
For the Script Type, select the Selenium JSON Script tab.
Paste the JSON content from the .side file in the Selenium JSON Script tab.
- Use the Selenium Python Script tab to paste the Python script. See Python Synthetic Transaction Examples.
- Use only one tab to paste the script.
- If the Selenium IDE cannot do the recording for a certain event (Example: Drag and Drop), leverage the Selenium Python Script option. For any questions, contact Support.
- Python scripts only run from private locations.
Select Locations from where you want to monitor.
Click Save.
Click OK on the confirmation message.
The Synthetics page displays the configured synthetic monitor.
To manage a configured synthetic monitor from the Synthetics page, click the name of the monitor and select one of the following from the Settings menu:
- Edit to change the existing details of the configured synthetic monitors.
- Delete to remove the configured synthetic monitor.
- Scheduled Maintenance to move any configured synthetic monitor to scheduled maintenance.
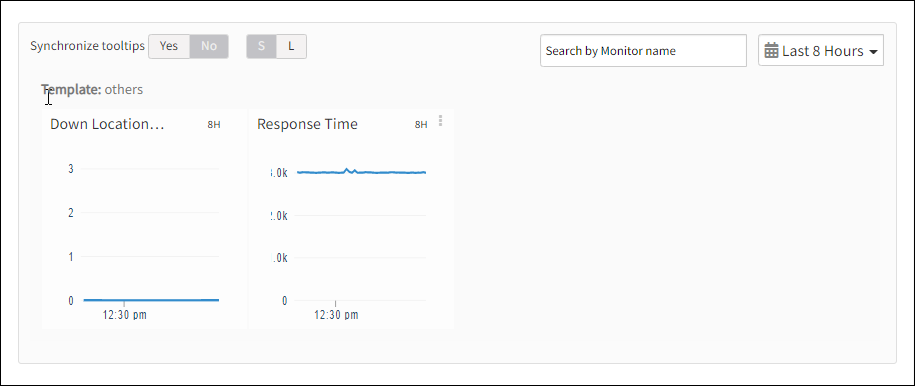
After configuring, view metrics, and graphical representations for more information.
Graphical metrics representation
Credential set for SCRIPT monitor
Using the Credential Set, you can assign credentials to override the username/passwords that you use while recording a transaction.
To add the credential set into the transaction includes:
- Creating and assigning credentials to the Script monitor.
- Overriding the original credentials from the transaction in the Selenium IDE.
Create and assign credentials
From the Credentials tab, create and assign credentials to the script monitor.
To create a credential set:
Select a client from the All Clients list.
Go to Infrastructure > Resources > Synthetics.
Click the SCRIPT monitor.
Click Credentials.
Click + Add.
On the Create New Credential screen, enter the details for the following parameters and click Save:
Parameter Description Name Name of the credential set. Description Reason for creating the credential set. Type Select HTTP from the drop-down list for the collector type. Username Username of the credential set. Password Password that you set for the credential set. Confirm Password Same password that you provide in the Password field. Port Port used to connect to the application. Is Secure Select the checkbox to enable. Connection Time-out (ms) Time in milliseconds that occurs as a result of a script exceeding the maximum time-out value. The Credentials tab displays the created credential set. The credentials sets get assigned automatically after a credential set is created from the Credentials tab. Use Assign to add credentials from the existing list of credential sets.
To assign a credential set:
- From the Credentials section, click + Assign.
- From Assign Credentials screen, select the credential set and click + Assign. Credentials screen displays the list of assigned credentials.
You can click Unassign to remove the assigned credentials.
Override the original credentials from the transaction in the Selenium IDE
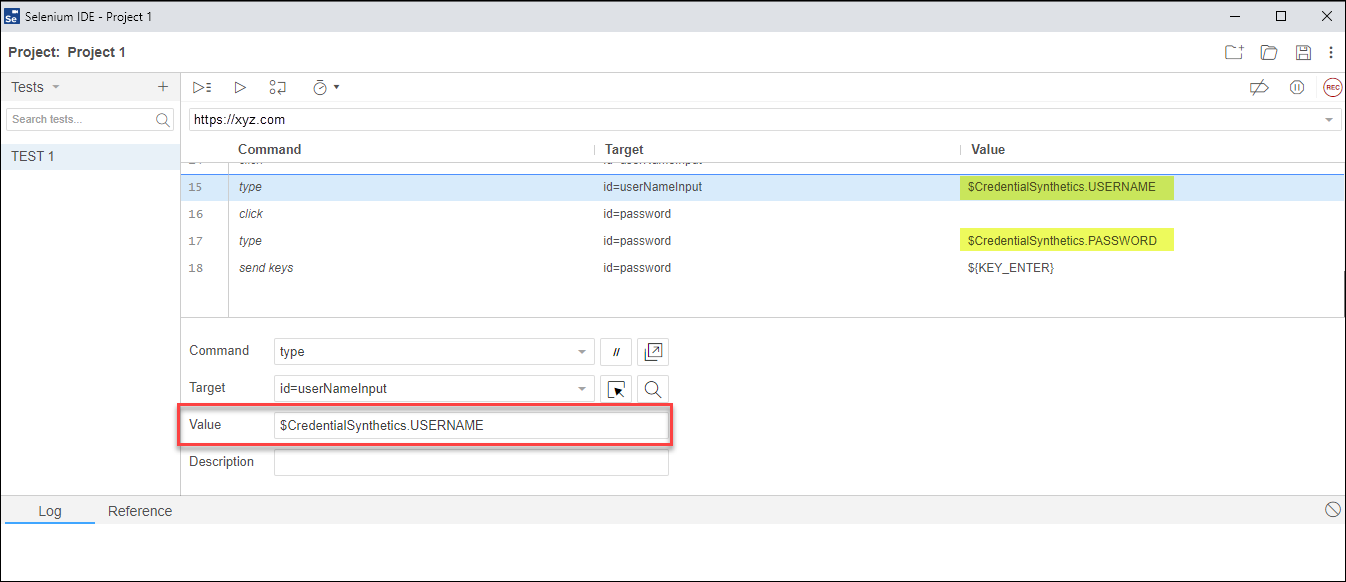
The main purpose of using a credential set is to ensure the security of the credentials that you provide while recording a transaction from the Selenium IDE. For example, if the transaction involves logging into a website, you can override the original credentials with the assigned credential set in the Value field using a key from the Selenium IDE. The following syntax is supported when adding the credential set in the Value field:
- Username: $CREDENTIAL SET NAME.USERNAME
- Password: $CREDENTIAL SET NAME.PASSWORD
Advanced settings
Use Advanced Settings > Configure to edit each action while running the script.
- On the Add Synthetic page, click Advanced Settings > Configure.
- On the HTTP Synthetic Transaction – Actions page, click the edit icon to change the transaction name.
- Provide a message in the Action Error Message section. The root cause analysis section in Location Availability displays the customized message when a transaction error occurs.
- Click Done.
Next steps
- Assign appropriate templates for SCRIPT – HTTPS Synthetic Transaction monitor using Device Management Policy, Assign Templates, or on the resource itself.
- Check response time for each metric and configured location in the graph from the Overview section. The graph displays only up to 20 metric points. To view other metric points, select the event names from the Select Instances drop-down.
Supported metrics
| Metric Name | Units |
|---|---|
| availability.down.location.count Location Count. Number of locations where the configured host is down | - |
| synthetic.response.time Response time. TTime taken to complete a task in a website | milliseconds |