OpsRamp supports web application endpoint monitoring using the HTTP Endpoint Probe application. This permits monitoring of both HTTP and HTTPS URLs.
This document describes how to install the HTTP Endpoint Probe application on the clustered gateway.
Prerequisites
Get installation package and deployment instructions
- Base gateway OVA package (download):
https://opsramp-gateway.s3.us-east-2.amazonaws.com/Gateway+Cluster/Gateway-cluster-20210405.ova - Gateway deployment instructions:
https://docs.opsramp.com/platform-features/gateways/gateway-cluster/
The gateway cluster should be running and registration should be complete.
Gateway Core - Update Instructions:
Performed the following steps on each cluster node.
Log in to the gateway command-line interface.
Perform clean-up of the existing image:
microk8s ctr i rm $(microk8s ctr i ls -q | grep message-sorter)Run the following commands on any node in the cluster. That node distributes the image to all other nodes in the cluster.
    helm chart pull us-docker.pkg.dev/gateway-images/gateway-cluster-charts/message-sorter:0.9.11
    helm chart export us-docker.pkg.dev/gateway-images/gateway-cluster-charts/message-sorter:0.9.11
    helm upgrade message-sorter message-sorter -f message-sorter/cluster.yaml --set imageChannel=stable
HTTP Endpoint Probe setup
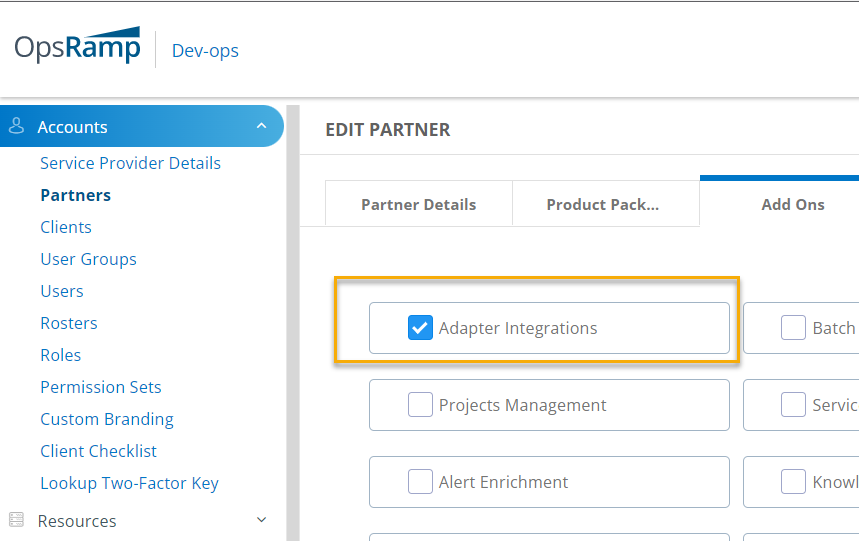
Ensure that Adapter Integrations is enabled in the respective partner and client setup. This can be done from partner and client settings when you set up your account, as described in the following steps:
Select Adapter Integrations:
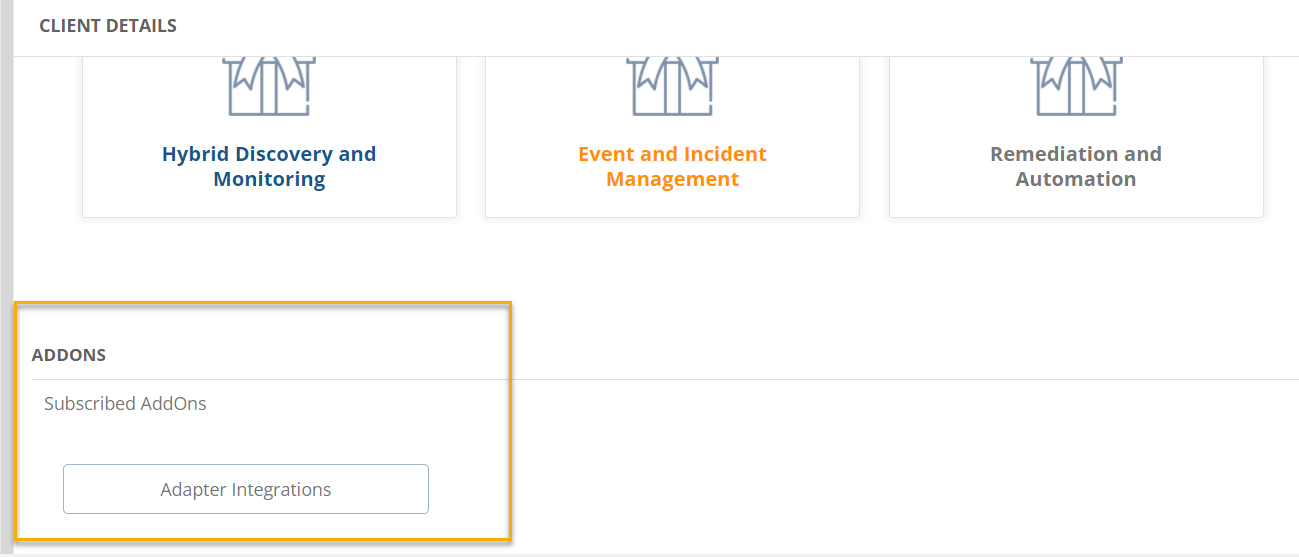
Choose ADDONS:
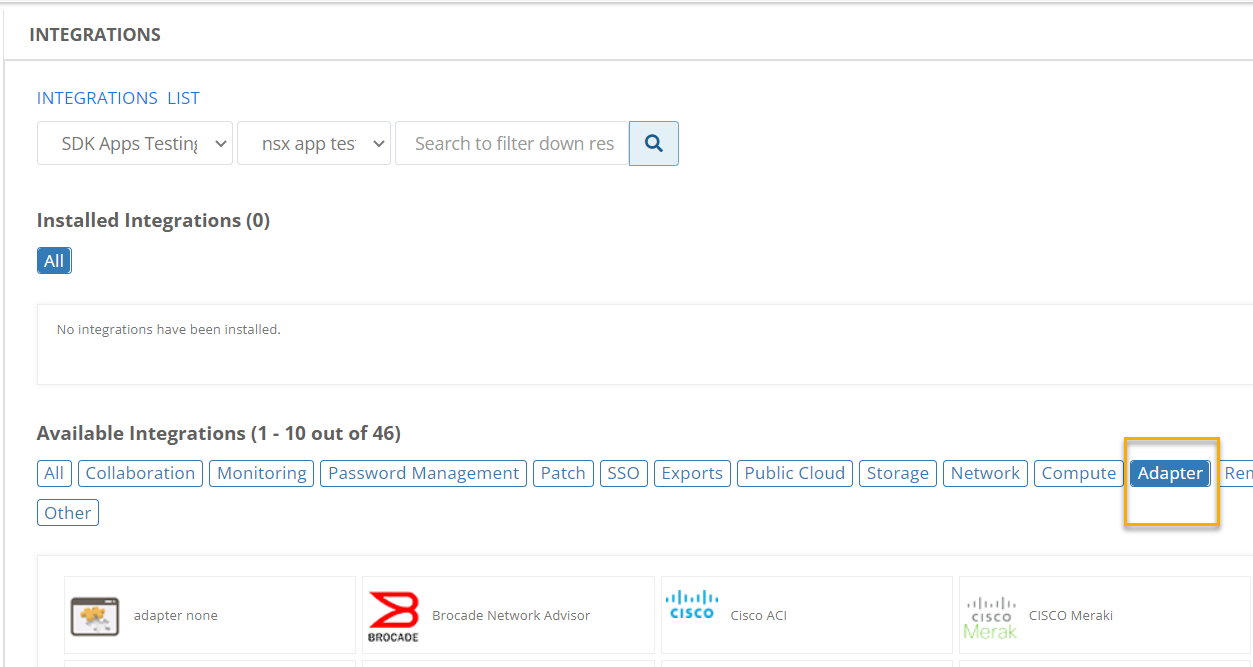
After adapter integration is enabled, you can view the available integrations in Setup > Integrations > Integrations and click the Adapter tab:


Step 1: Install the integration
From All Clients, select a client.
Go to Setup > Integrations > Integrations.
In Available Integrations, select Adapter > HTTP Endpoint Probe.
In Install Integration, enter:
Parameter Description Name Name of the integration. Upload Logo (optional) Logo for the integration. Gateway Profile Choose a gateway management profile to associate with the client. Click Install. The Integration page displays the installed integration in the CONFIGURATION section.
Step 2: Configure the integration
In the CONFIGURATION section, click + Add.
Enter the following configuration parameters:
Parameter Description Name Configuration name. Base URL Endpoint URL to be monitored. Timeout Time interval to wait for a response from the configured URL, in milliseconds. Additional configuration A JSON data structure with additional configuration parameters: Uripath= (optional) Additional path elements appended to the base URL.ResContentShouldContain= (optional) String/pattern to match on in the response from the configured URL.ResContentShouldNotContain= (optional) String/pattern that should not be present in the response from configured URL.Method=GETHTTP method orPOSTHTTP method.HttpHeaders= (optional) Additional headers that might be required for the URL.HttpParams= (optional) Applicable for all request types.PostData= (optional) Applicable for HTTP method typesPOSTorPATCH.
Sample payload:
- URL to be monitored: https://reqres.in/api/users
- Base URL : https://reqres.in/
    Additional Configuration:
    {
        "Method":"POST",
        "ResContentShouldContain":"",
        "ResContentShouldNotContain":"",
        "HttpHeaders":{"content-type":"application/json"},
        "HttpParams":{},
        "PostData":"{ \"name\": \"morpheus\", \"job\": \"zion resident\"}",
        "UrlPath":"api/users"}
    }
In the Resource Types & Metrics section, select the metrics and configure them for availability and alert conditions.
In the Discovery Schedule section, select Recurrence Pattern and add one of the following patterns:
- Hourly
- Daily
- Weekly
- Monthly
In the Monitoring Schedule section, select the target device monitoring frequency. The default frequency is five minutes
Click Save.
Supported metrics
| Metric Name | Metric Display Name | Units |
|---|---|---|
| endpoint_url_ResponseTime Endpoint url response time. | Response Time | milliseconds |
| endpoint_url_ResponseLookUpTime Duration from start until the DNS name is resolved. | Lookup Time | milliseconds |
| endpoint_url_ResponsePreTransferTime Duration from start until the file, requested page, transfer is about to start. | Pre Transfer Time | milliseconds |
| endpoint_url_ResponseStartTransferTime Duration from start until the first byte is received. | Start Transfer Time | milliseconds |
| endpoint_url_ResponseConnectTime Duration from start until the web server is connected. | Connect Time | milliseconds |
| endpoint_url_ResponseRedirectTime Total duration of all redirect steps before the final transfer. | Redirect Time | milliseconds |
Risks, Limitations & Assumptions
- The availability is shown unknown for few resources even if it is enabled on the respective resource metrics. This is because of the presence of multiple native type resources under the same resource type.