UDP synthetic monitor makes a connection to the target IP address on a given port and monitors the time taken for the connection.
Create UDP synthetic monitor
Enter the follwoing details to configure the UDP synthetic monitor:
| Section | Field Name | Description | Values/Example | Field Type |
|---|---|---|---|---|
| Basic Details | Name | Enter a name for the synthetic monitor. | Text | |
| Type | Select the type of synthetic monitor. | UDP | Dropdown | |
| UDP Configuration | Host | Enter the IP address/host name of the synthetics. It should be accessible from Gateway. |
| Text |
| Connection Timeout | Maximum time-out to connect to the UDP server. |
| String | |
| Response Should Contain | Response body should contain specific content. Check the presence of any text in the response of the URL. |
| String | |
| Response Should Not Contain | Response body should not contain specific content. Check the absence of any text string in the response of the URL. |
| String | |
| Message To send | The command or message that is sent to the server. |
| String | |
| Port | Enter the port number of the TCP server to communicate with OpsRamp's endpoints. It should be accessible from Gateway. |
| String | |
| Locations | Public Locations | Select the public locations where the monitor will run. | INT Public1 | Checkbox |
| Private Locations | Select the private locations where the monitor will run. | INT Private1 | Checkbox |
After configuring, view metrics, and graphical representations for more information.
Graphical metrics representation
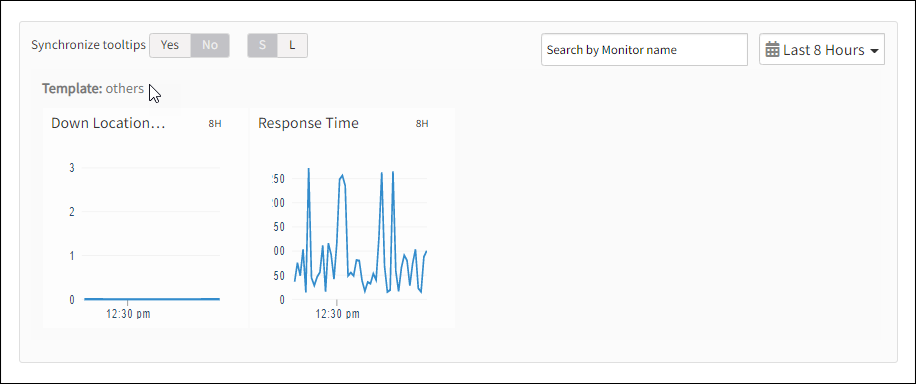
Supported metrics
| Metric Name | Units |
|---|---|
| availability.down.location.count Location Count: The number of locations where the configured host is down | - |
| synthetic.response.time Response time. Time taken to connect to the port of the target UDP server | milliseconds |