Process statistics helps monitor various metric values of a process. Multiple processes can be monitored in a single monitor. For example, CPU utilization can be monitored for a specific process.
Thresholds can be configured based on the following parameters: instances, CPU, and memory. The agent monitors how processes do against thresholds. An alert is raised when the metric value of a process exceeds the threshold. Separate alerts are raised, for instance, CPU, and memory.
The Chrome browser is the recommended browser.
To track the performance of various processes (Using parameters such as CPU and memory), add a process statistics monitor using Setup > Monitoring > Templates > Other Monitors.
Create process statistics monitors
Select a client from the All Clients list.
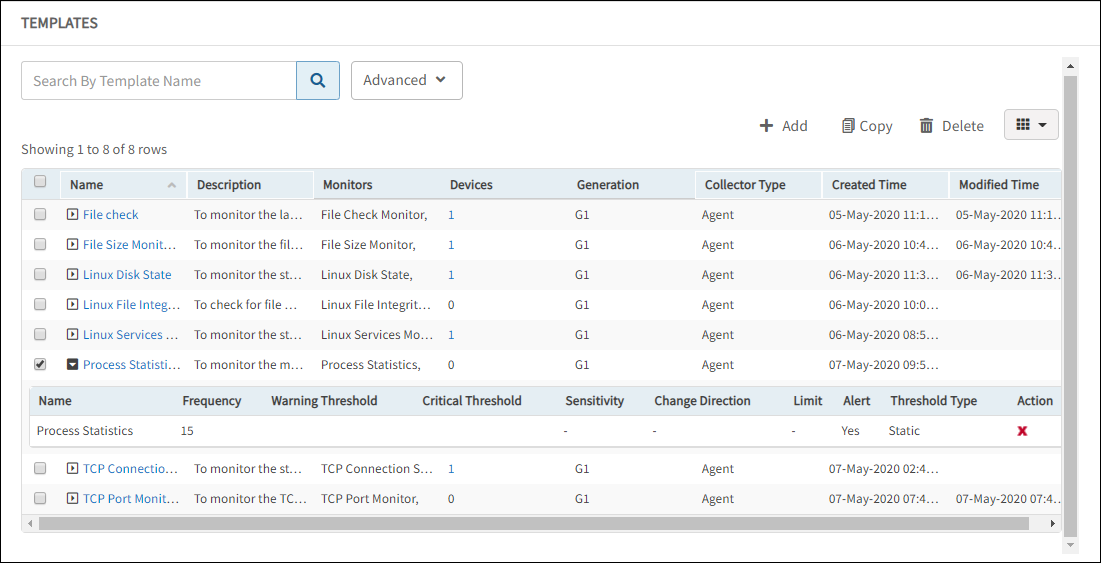
Go to Setup > Monitoring > Templates.
From the TEMPLATES, click +Add.
From MONITOR TEMPLATE, enter:
Select Template Scope: The partner template or client-specific template. For the client-specific template, select the client.
Collector Type: The application type used to gather information. Select the agent.
Applicable for: The type of the application.
Template Name: The name of the template.
Description: The summary of the template.
Generation: TThe generation that the template belongs to.
Note: Select Monitor Type as “G1 Monitors”.Tags: The user-defined tags used for enhanced filtering.
Prerequisites: The essential prerequisites to consider while monitoring using a template. For a Windows template, as an example, check the SQL services while monitoring SQL parameters.
Status: The active or end-of-life templates.
Notes: Additional information to add to the template.
Template Family Name: The category that applies to the application. For example, Windows server, storage server, and network server.
Deployment Type: Select one of the following methods to apply the template to resources:
- Custom
- Optional
- Standard
Click Save.
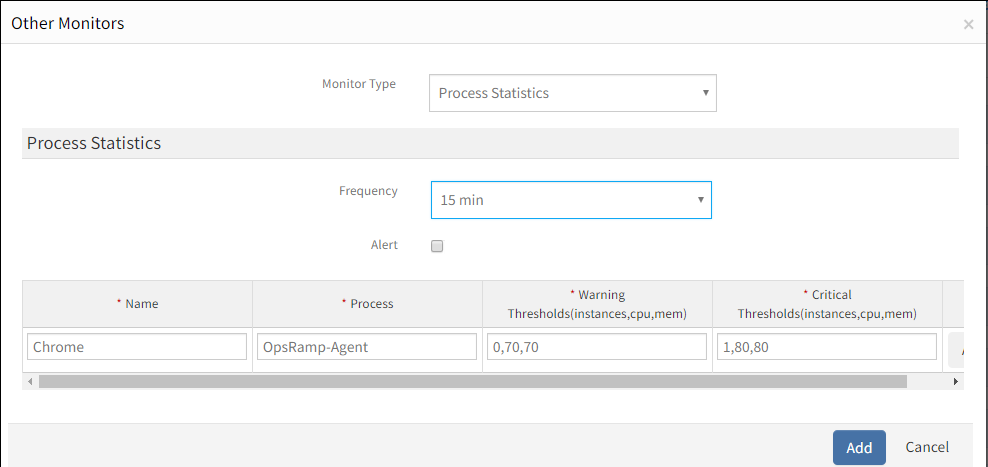
After configuring the template, go to Other Monitors and click +Add.
From the options displayed in Monitor Type drop-down, select process statistics.
From Process Statistics, click Add to enter more detailed parameters. Click Add and Remove to increase or decrease the following settings:
- Frequency: The intervals used to monitor the processes. The recommendation is 15 minutes.
- Alert: Select Alert to get alerts for any issue.
- Apply Availability Monitor: Select the checkbox to show the availability of the monitors.
- Name: The name of the process.
- Process: The process to monitor.
- Warning: The comma-separated warning threshold value.
- Critical: The comma-separated critical threshold value.
After adding a template with a process statistics monitor, assign the template to a device to start monitoring.
Manage process statistics monitors
Process statistics details can be viewed and modified when added to a template. To manage the process statistics monitor:
- Edit: Click the template name displayed in the TEMPLATES screen to change the process statistics monitor details.
- View: Click the arrow beside the Template Name on the TEMPLATES screen to view the process statistics monitor added to the current template.
Collect data
The collected metrics can be viewed with the name: Process Statistics in Infrastructure > Resources > Device Details > Monitors > Monitors.
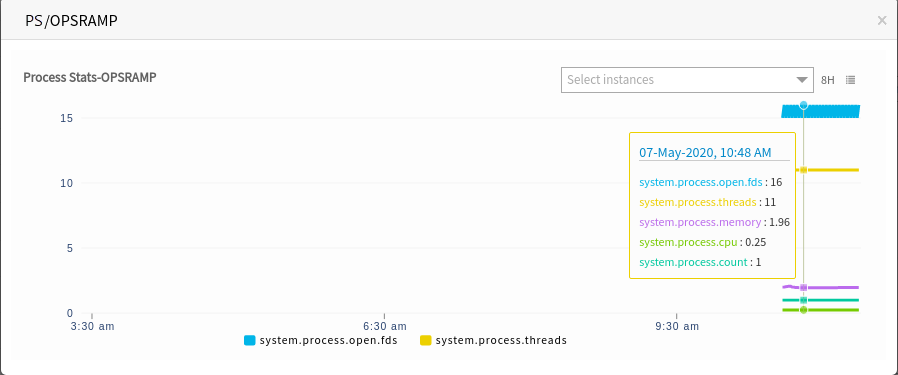
Validate templates
The graphical data is displayed for each name configured in the process statistics monitor. Monitor graphs can be viewed under Infrastructure > Resources > Device Details > Metrics. Only one graph is displayed for all configured names in an individual monitor.
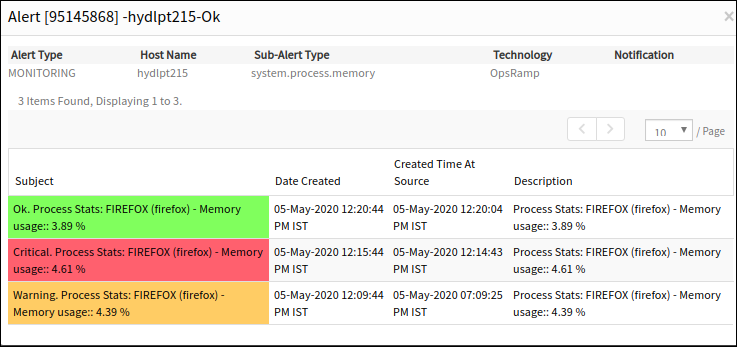
Process statistics alerts
Only critical alerts are sent while monitoring processes and can be viewed in the Alert browser. Examine the alert subject to verify process alert details.