Developed by Etsy, StatsD is a simple network daemon that “listens” for statistics data (ex: counters) to aggregate custom metrics. The agent listens to the StatsD port and collects data. Using StatsD for monitoring helps to get all application-specific statistics broadcasted over UDP. After configuration, StatsD monitored data is transmitted to the system.
To monitor using StatsD, assign StatsD monitor to the monitoring template. To add a StatsD monitor to a template, select StatsD from Other Monitor while creating a template. To monitor using StatsD, a StatsD monitor can be added using Setup > Monitoring > Templates > Other Monitors.
After applying the template to a device, the template can be validated if it is assigned to a resource. For more information view Validate Template.
Prerequisite
- Enter the port number for the StatsD monitor in configuration the property
statsd_portin the file/opt/opsramp/agent/conf/configuration.properties. - If
statsd_portis not specified, 8125 is assumed to be the default port.
CreateStatsD templates
Select a client from the All Clients list.
Go to Setup > Monitoring > Templates.
From TEMPLATES, click +Add.
From MONITOR TEMPLATE, enter:
Select Template Scope: The partner template or client-specific template. For the client-specific template, select the client.
Collector Type: The application type used to gather information. Select the agent.
Applicable for: The type of the application.
Template Name: The name of the template.
Description: The summary of the template.
Generation: The generation that the template belongs to. For example, Generation 2.
Tags: The user-defined tags used for enhanced filtering.
Prerequisites: The essential prerequisites to consider while monitoring using a template. For a Windows template, as an example, check the SQL services while monitoring SQL parameters.
Status: The active or end-of-life templates.
Notes: Additional information to add to the template.
Template Family Name: The category that applies to the application. For Example, Windows server, storage server, and network server.
Deployment Type: Select one of the following methods to apply the template to resources:
- Custom
- Optional
- Standard
Click Save.
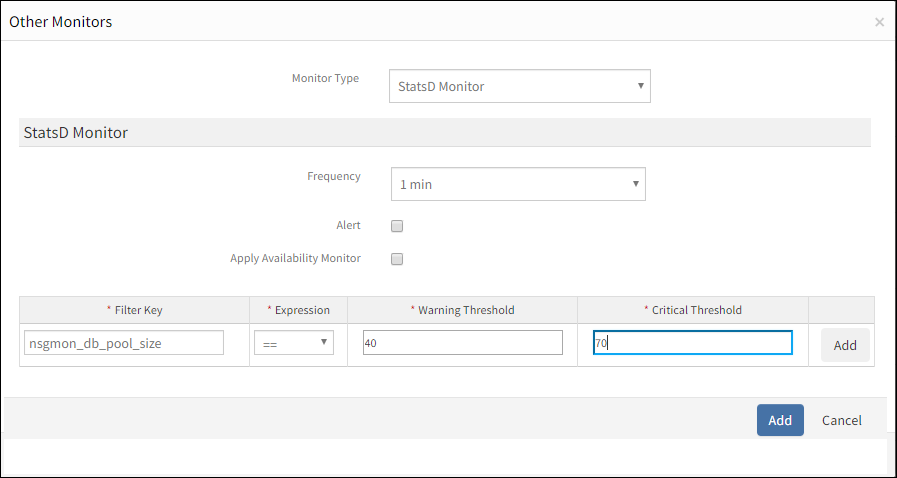
After configuring the template, go to Other Monitors and click +Add.
From the options displayed in the Monitor Type drop-down, select StatsD Monitor.
Enter the details for the following parameters:
Frequency: The rate that the StatsD monitor must transmit metric data to the system.
Alert: The alert generated when a metric crosses a certain threshold value. Critical and warning alerts can only be received when this option is enabled.
Apply Availability Monitor: The availability of the resource. After enabling this option, the StatsD monitor is added to the availability matrix.
Filter Key: The metric name whose data should be collected by the monitor (ex:
nsgmon_db_poolsize).Expression: Expression to check the metric value against the threshold:
- == indicates Equals
- != indicates Not Equals
- >= indicates Greater than or Equal to
- <= indicates Less than or Equal to
- > indicates Greater than
- < indicates Less than
Warning Threshold: The threshold value that indicates the warning limit. A warning alert is generated when a metric reaches a specific threshold.
Critical Threshold: The threshold value that indicates the critical limit. A critical alert is generated when a metric reaches a specific threshold.
After adding a template with the StatsD monitor, assign the template to a device to start monitoring.
Manage StatsD monitors
StatsD monitor details can be viewed and modified when added to a template. Do the following actions to manage the StatsD monitor:
- Edit: Click the template name displayed on the templates screen to change the monitor details.
- View: View the StatsD monitor details in the templates screen. Click the arrow next to the template name to view the monitor added to the current template.
Collect data
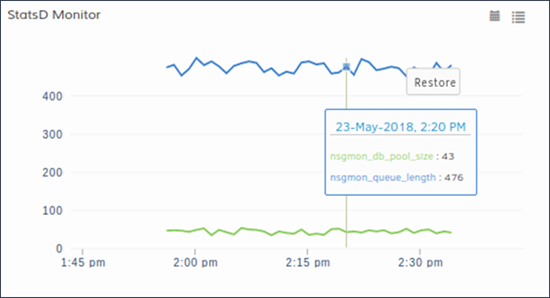
You can see the collected metrics with the name: StatsD Monitor in Infrastructure > Resources > Device Details > Monitors > Monitors.
Validate templates
The graphical data is displayed for each name configured in the StatsD monitor. Monitor graphs can be viewed under Infrastructure > Resources > Device Details > Metrics. Only one graph is displayed for all configured names in an individual StatsD monitor. The graph displays the monitor details using the filter key.