Introduction
Monitoring log files is essential for administrators during emergencies. The log file monitor keeps track of errors in logs from applications on both Windows and Linux servers.
Here are the key benefits:
- Monitor log data for any event or pattern
- Identify errors for any failure
- Improved security
A log file maintains a record and timestamp of events that occur in an application. The agent examines log files with a known search string (or pattern) based on the configured check type. If the agent detects a match, an alert is triggered in the alert browser. The system monitors log files including audit logs, transaction logs, and event logs. Different log file extensions can be used but .log is recommended for monitored logs.
Log management can be a complex task maintaining log file size, applying a file checksum, and making it easy for administrators to search through old log data files to find errors. Log rotation compresses old data (and large data) into a new log file. This process simplifies log management while allowing more space for new logs.
Constraints
Log file monitor graphs have the following limitations:
- Log files with
.exeand.rarfile extensions are not supported. - Regular expressions are not supported in folder names.
- Up to 20 sections can be added.
Environment Variable (Applicable to G1 & G2 Monitoring)
You can specify the absolute file path for the log file monitor by using environment variables.
For example: $filepath/agent.log.
After making any changes to environment variables, the agent must be restarted on both Windows and Linux systems for the updates to take effect.
- On Linux, the agent reads variables from the
/etc/environmentfile. - On Windows, the agent accesses all system-level environment variables.
G1 Log File Monitoring
By using log file monitors, administrators can rule out the chance of missing an error in logs.
G1 Log file monitors can be added using Setup > Monitoring > Templates > Other Monitors.
See the Logging section for information on how to create and maintain Linux and Windows log file monitors.
Log Monitor Alerts
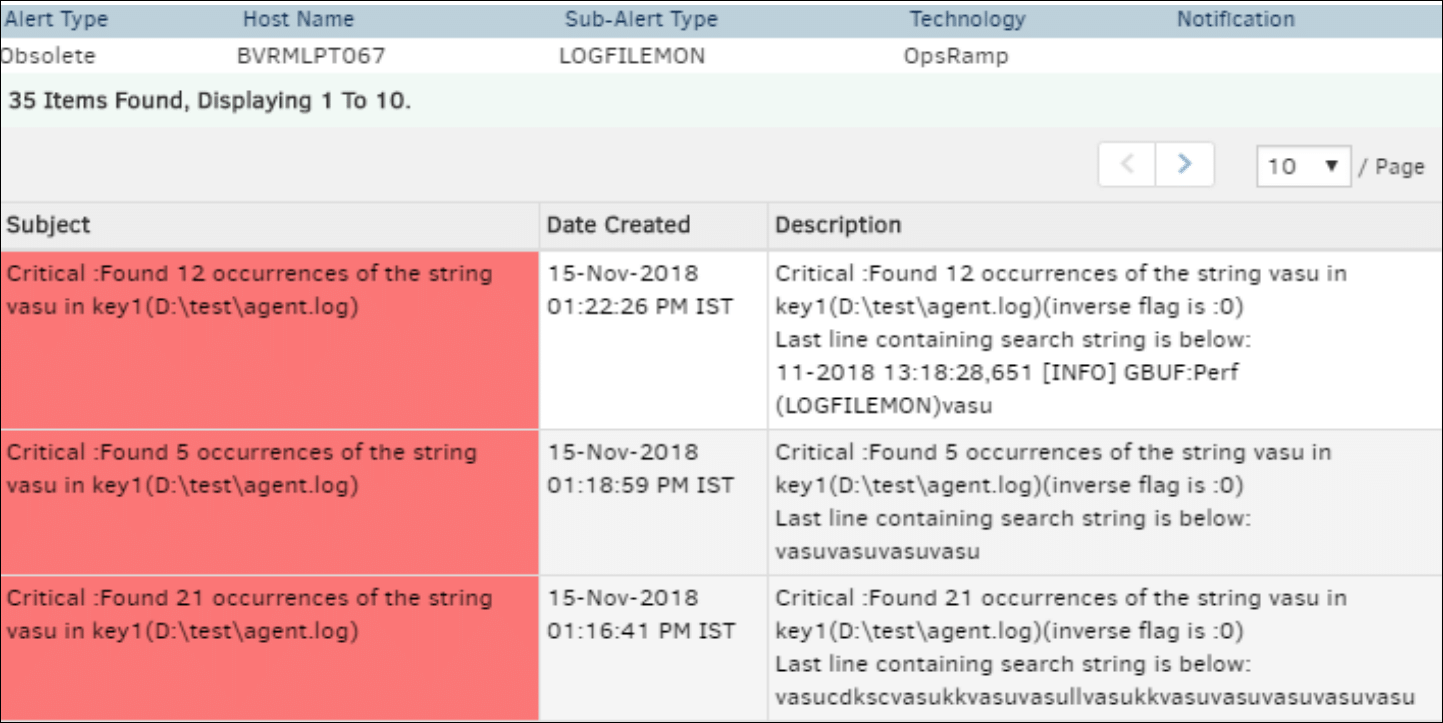
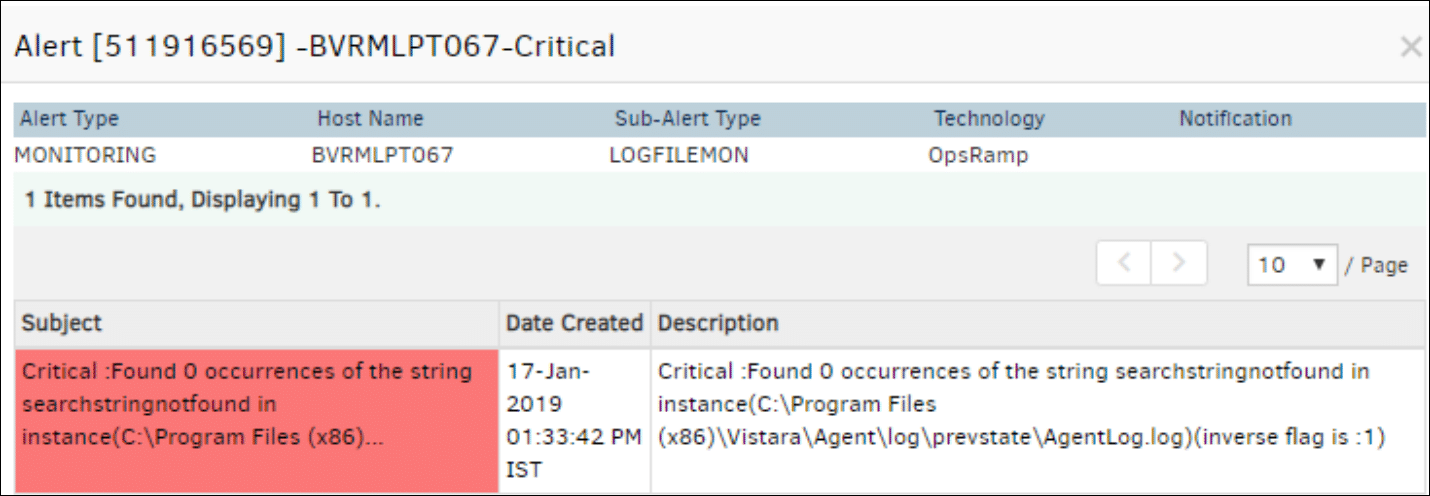
Critical alerts are sent while monitoring log files. View the alerts in the Alert browser. Examine the inverse flag in the alert description to verify the check type.
The inverse flag displays 0 if the check type exists. The alert description displays 50 characters from the last occurrence of the search string in one iteration.
The inverse flag displays 1 if the check type does not exist.
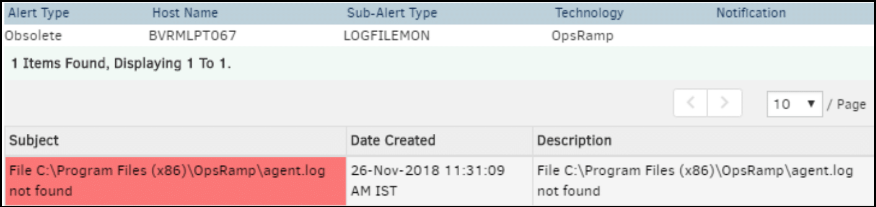
A critical alert is sent for missing log files and sends an OK alert after the retrieval of the same file.
Log Monitor Graphs
The graphical data is displayed for each name configured in the log file monitor.
Navigate to Infrastructure > Resources > Device Details > Metrics to view the monitor graphs. Only one graph is displayed for all configured names in an individual log file monitor.
The log file monitor graph is different for Windows and Linux devices.
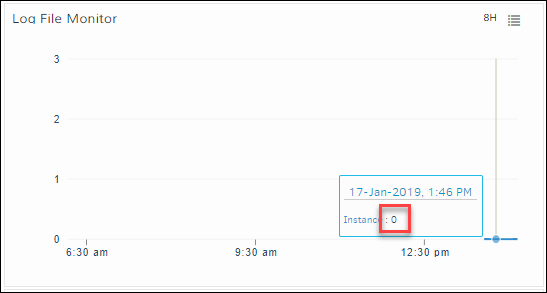
For Windows
In Windows devices, the graph is plotted as follows:
1: The input string exists0The input string does not exist
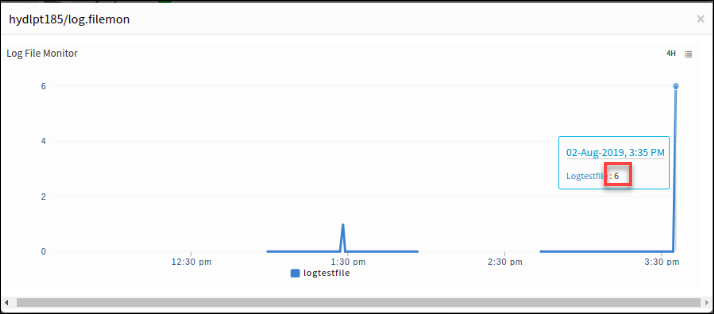
For Linux
For Linux devices, graphs plot according to the search string count.
For example, if the search string appears 6 times in the log file, the log monitor graph displays 6 instances of it.
G2 Log File Monitoring
The G2 logfile monitoring functionality is similar to the G1 logfile monitor with including advanced option for users to customize the subject and description according to their needs.
Note
- Starting with the 17.0.0 agent version, we are allowing the monitoring of the first alteration of log files with sizes of up to 5GB. In the previous version of agent, we only allowed log files with sizes of up to 1GB.
- OpsRamp Agent use Python scripts for Linux and PowerShell scripts for Windows to detect regex strings in logfile monitors. By default, Agent use the standard Go language package (regex), which supports only RE2-based regex syntax.
For other RE2-based syntaxes, Python/PowerShell script is used as a fallback. By defaults, the Agent uses Python script, and if Python is not found, it switches to Python3. - You can add a maximum of 20 rules when applying a template. If you need to add more than 20 rules, consider creating additional templates by copying the Agent G2 Logfile Monitor. For detailed steps, refer to Copy a Monitor document.
You can add the log file monitors by following these steps:
- Go to Resources and select the resource where you want to apply the template. Then, click on it.
- Go to Monitor > Template.
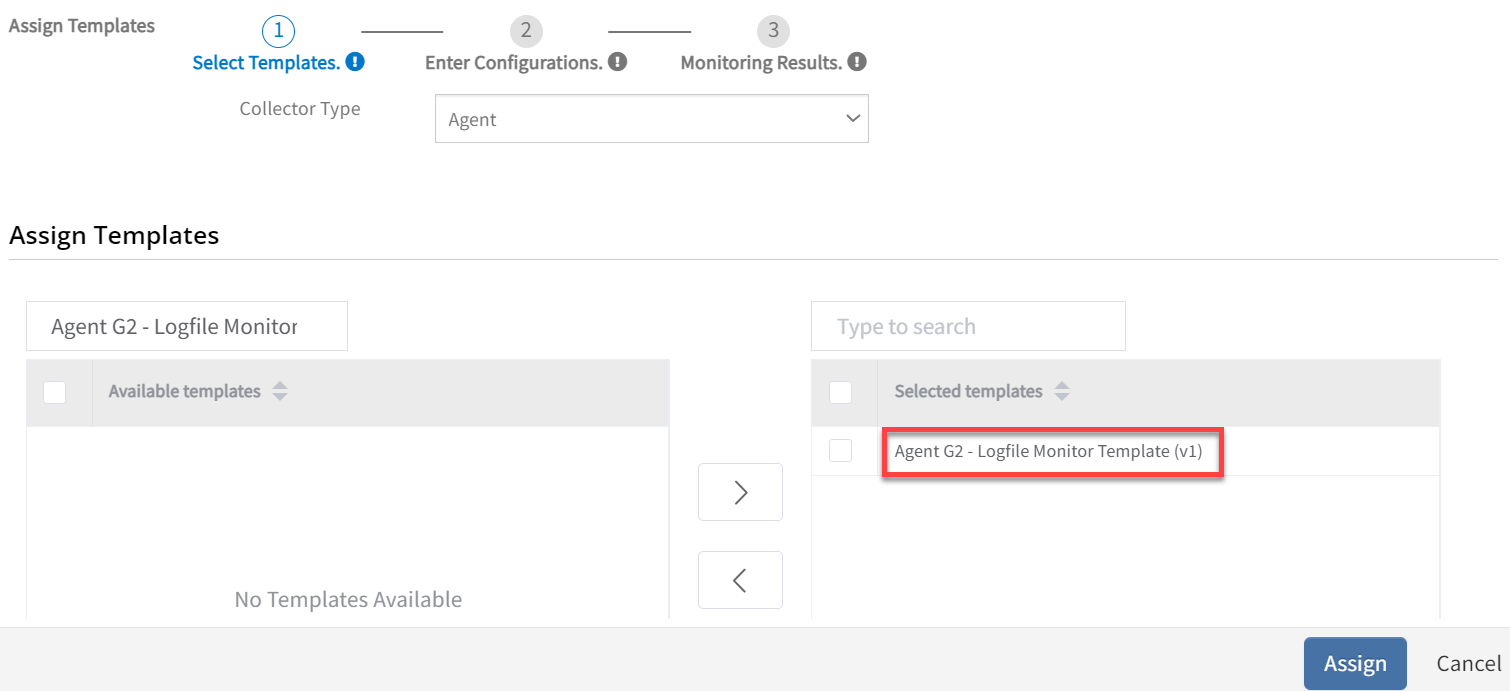
- Click on +Assign Templates option.
- Search for the template (Agent G2 - Logfile Monitor Template).
- Select the template and click Assign.
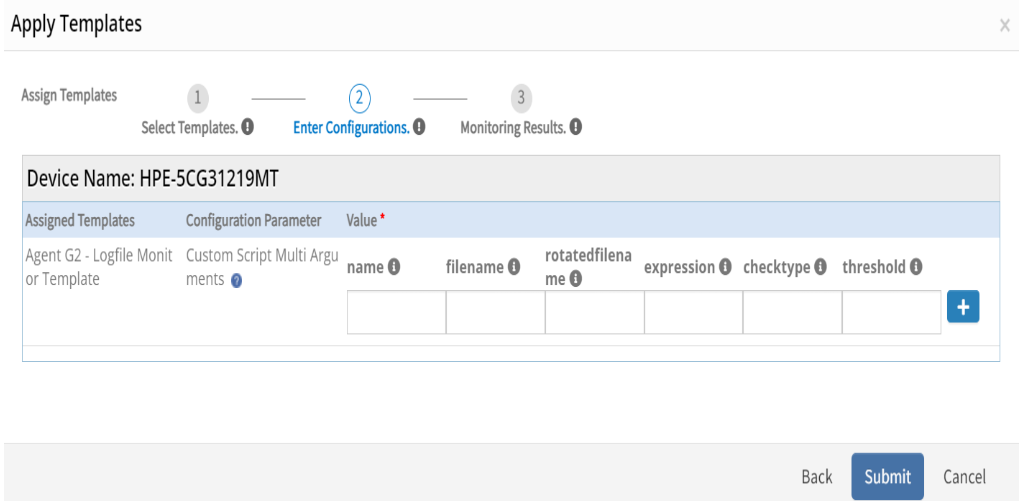
- Enter the configuration details in the field to apply template:
- Name: Instance name of the logfile
- Filename: Name of the logfile to be monitored
- Rotatedfilename: Name of the rotated logfile
- Expression: Expression need to be searched in the logfile
- Checktype: Checktype should be Yes or No
- Yes: sends the alert if expression exist
- No: sends the alert if expression does not exists
- Threshold: Sends the alert based on input threshold
- Click Submit.
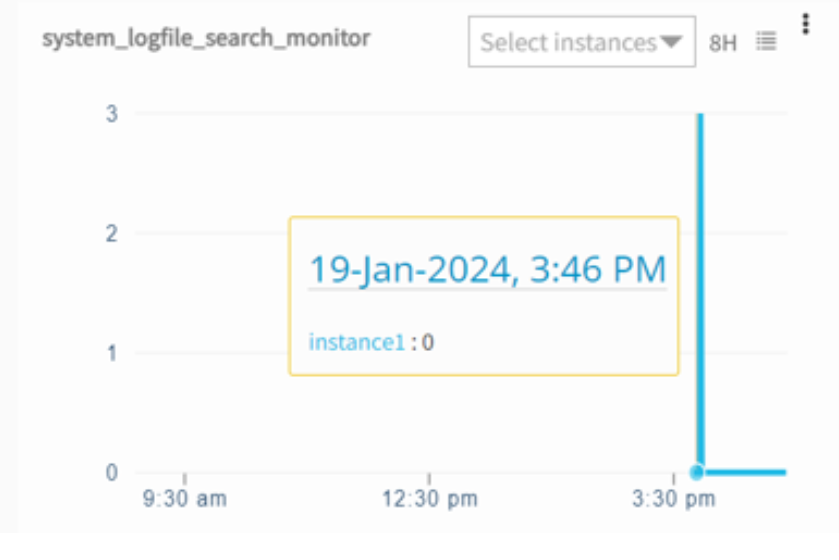
Log Monitor Graphs
Graphs plot according to the search string count.
For example, if the search string appears 6 times in the log file, the log monitor graph displays 6 instances of it.
Log Monitor Alerts
Critical alerts are sent during the log file monitoring. You can view these alerts in the Alert browser.
Check the alert description for the inverse flag to confirm the check type.
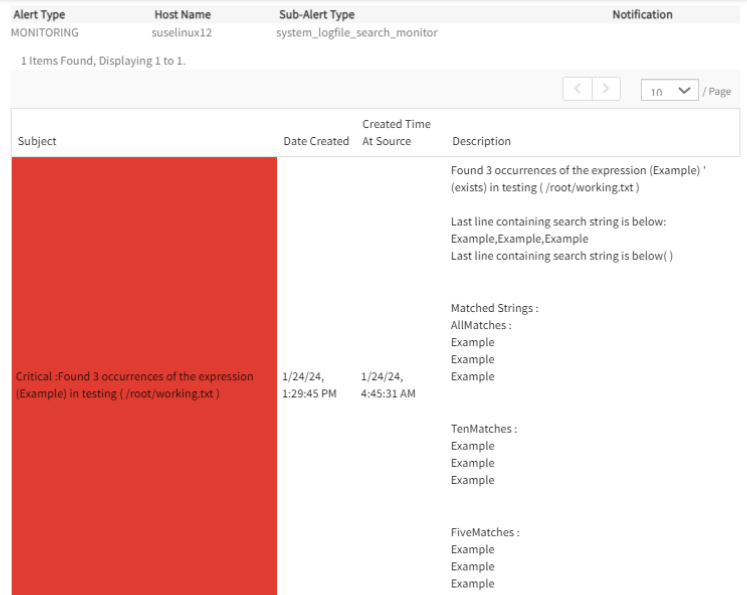
Alert subject and description can be customized in G2 log file monitor using available tokens.
Available tokens List
| Token | Description |
|---|---|
| ${logfile.status} | Logfile monitor status |
| ${logfile.searchcount} | Count of occurrences of the expression |
| ${logfile.expression} | Expression of Logfile monitor |
| ${logfile.checktype} | Exist or not exists |
| ${logfile.component} | Instance of logfile monitor |
| ${logfile.filename} | Name of the logfile |
| ${logfile.last.searchstring} | Last line containing search string |
| ${logfile.rotatedfile} | Rotated logfile |
| ${logfile.last.rotatedsearchstring} | Last line of rotated file |
| ${matchedstring.all} | All matches |
| ${matchedstring.ten} | Ten matches |
| ${matchedstring.five} | Five matches |