The Linux services helps you monitor the operating system specific services for Linux devices in your environment.
Linux Services Monitor helps you track the status of the Linux services in your environment. The main purpose of using the Linux Services Monitor is to observe the application availability and faster detection of failures. You can check the status using a return code with one of the following values:
The Linux services monitor tracks the status of Linux services by observing application availability and detection of failures. The status uses one of the following return codes:
0: Running1: Stopped
The Agent raises an alert if the original status does not match the return code.
To manage Linux services, a Linux services monitor can be added using Setup > Monitoring > Templates > Other Monitors. For more information, see Validate Templates.
After applying the template to a device, the template can be validated if it is assigned to a resource.
Create Linux Services Monitors
- Select a client from the All Clients list.
- Navigate to Setup > Monitoring > Templates.
- Click +Add to create a new monitor template.
- In the Monitor Template screen, enter the following details:
- Template Scope: Choose whether the template is for a specific client or is a partner-level template.
- Collector Type: The application type used to gather information. Select the Agent.
- Applicable for: he type of application is Device.
- Template Name: The name of the template.
- Description: The summary of the template.
- Generation: The generation to which the template belongs, Generation 1.
- Tags: The user-defined tags used for enhanced filtering.
- Prerequisites: The essential prerequisites to consider while monitoring using a template.
- Status: Active
- Notes: Additional information to add to the template.
- Template Family Name: The category that applies to the application.
- Deployment Type: Standard
- After configuring the template, go to Other Monitors and click +Add.
- From the Monitor Type dropdown, select Linux Services Monitor.
- From the Linux Services Monitor section, click Add to enter more detailed parameters. Click Add and Remove to increase or decrease the following settings:
- Frequency: The intervals used to monitor the services. The recommendation is 15 minutes.
- Alert: Select Alert to get alerts for any match.
- Apply Availability Monitor: Select the checkbox to show the availability of the monitors.
- Articles: The articles that you can add.
- Service Name: The name of the service to monitor.
- Return Code: The return code to check the service status command. The Agent raises an alert if the return code does not match.
For an example:- If the SSH service is inactive and a
0is entered in the return code field. After monitoring, the Agent raises a critical alert when the original service status does not match the return code. Otherwise, anOKalert is sent if the return code matches.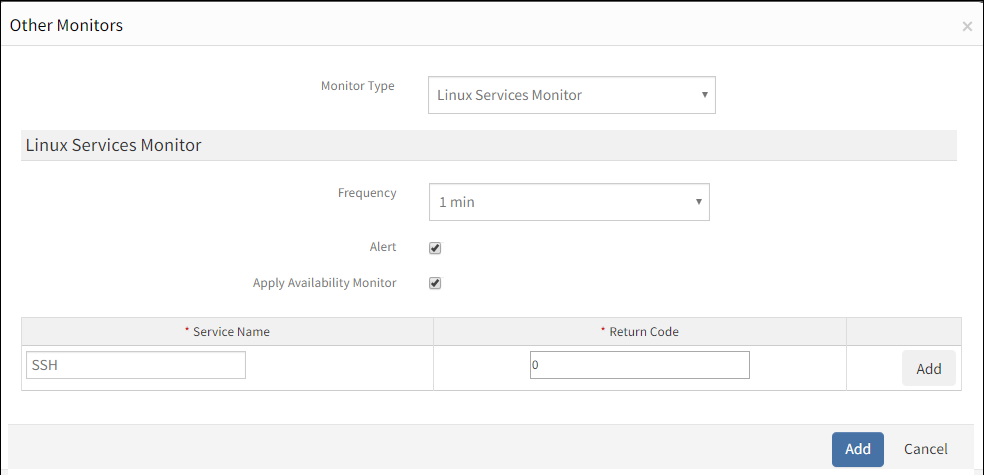
- If the SSH service is inactive and a
- Click Save.
After adding a template with a Linux Services Monitor, assign the template to a device to start monitoring.
Note
We also have a G2 template available for this, Agent G2 - Linux Services Monitoring.Manage Linux Services Monitors
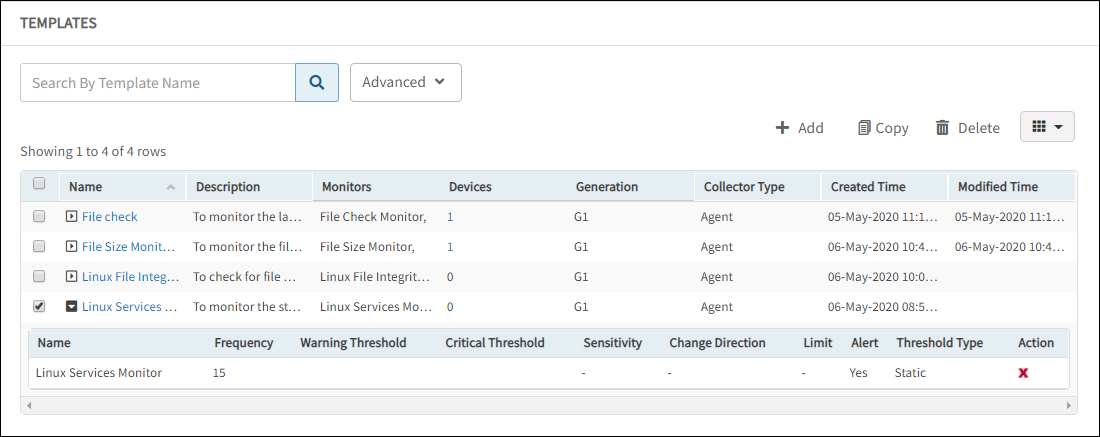
Linux services monitor details can be viewed and modified when added to a template.
- Edit: Click the template name displayed on the templates screen to change the monitor details.
- View: View the monitor details in the templates screen. Click the arrow next to the template name to view the Linux services monitor added to the current template.
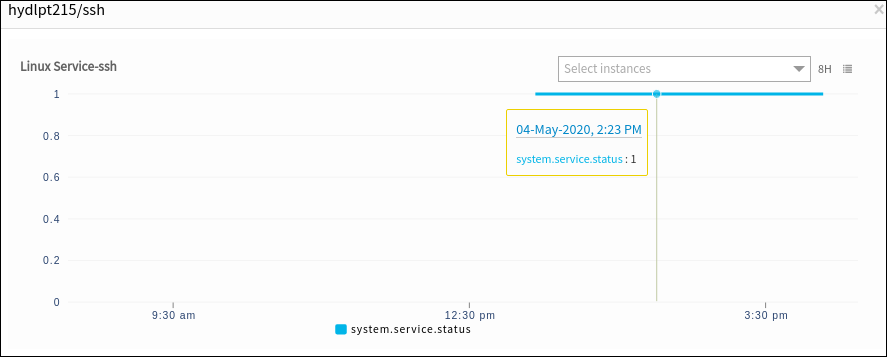
Validate Templates
The graphical data is displayed for each name configured in the Linux services monitor. Monitor graphs can be viewed under Infrastructure > Resources > Device Details > Metrics. The graph displays the monitor details using ghe return code of the services.
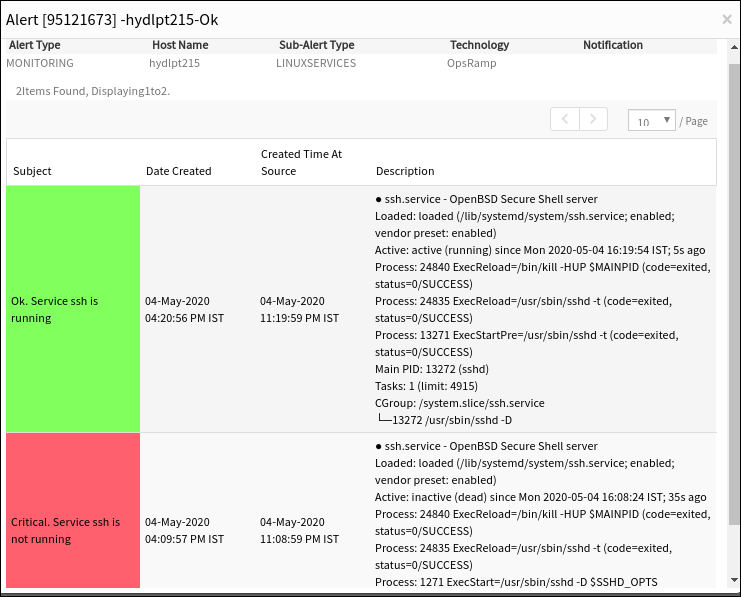
Linux Services Monitor Alerts
Critical Alerts are sent while monitoring the services and the status does not match the return code. View the alerts in the Alert browser. Examine the alert description to verify the last modified time.