You can apply G1 and G2 agent process statistics monitoring templates for Linux and Windows devices. G2 agent templates allow for threshold and filter configuration at the component level.
The agent can send cache, physical, and virtual memory components for all Linux distributions.
Agent G2 Process Statistics Monitors
The following global templates are used to monitor devices.
| Template Name | Supported Metrics |
|---|---|
| Agent G2 - Linux Process Statistics Monitoring-v2 | system.process.stats.count system.process.stats.cpu system.process.stats.memory system.process.stats.threads system.process.stats.open.fds |
| Agent G2 - Linux Process Statistics Monitoring | system.process.stats.count system.process.stats.cpu system.process.stats.memory system.process.stats.threads system.process.stats.open.fds |
| Agent G2 - Windows Process Monitoring | System.windows.process.count System.windows.process.handlecount System.windows.process.pagefilebytes System.windows.process.processorcoretime.percent System.windows.process.processortime.percent System.windows.process.threadcount System.windows.process.workingset |
Note
The template Agent G2 - Linux Process Statistics Monitoring-v2 has an option to select process statistics matching criteria (process.stats.matching.criteria) with three options as Include Process Arguments, Exclude Process Arguments and Match Exact Process Name. The description about these options can be found in configuration parameters below.Note
The template Agent G2 - Linux Process Statistics Monitoring-v2 will work for agent version 13.0.2-1 or greater.- Select a client from the All Clients list.
- Go to Infrastructure > Resources.
- Go to Resource Name > Resource Details > Monitors > Template.
- Click +Assign Templates.
- Go to Apply Templates > Select Templates > Available templates and select the templates.
- Click Assign.
- In the Enter Configurations step, enter a Value for each Configuration Parameter:
For windows template we will get the below options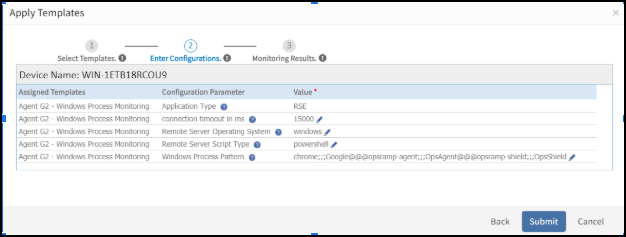
For Linux template we will get the below options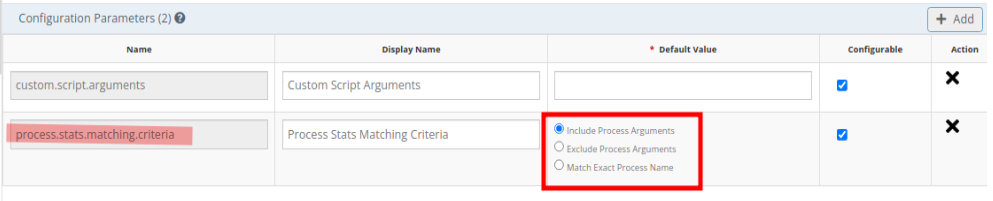
- Click Submit to apply the changes. The Templates screen displays the selected templates.
After applying the template to a device, validate the template to ensure that it is assigned to a resource.
Configuration Parameters
Use the following input argument format for Linux and Windows processes, where processname is the name of the process you want to monitor:
processname@@@processname@@@processname.
The format uses @@@ to delimit multiple processes.
The Agent supports all basic and extended regular expressions, including:
grepwith-Eswitch-based regular expressions for Linux.- PowerShell-based regular expressions for Windows.
In Agent G2 - Linux Process Statistics Monitoring- v2, along with the above configurations we have one more configuration parameter called process stat matching criteria with below 3 options:
Include Process Arguments: Agent will match the given process name or regex with all the process names and its arguments in the system.
Example: If a user has given a process name as systemd for monitoring, agent will monitor all the processes in the system whose name or arguments contains systemd like systemd-journal, systemd-udev, debus-demon(process argument matches)Exclude Process Arguments: Agent will match the given process name or regex only with the process names in the system.
Example: If a user has given a process name as systemd for monitoring, agent will monitor all the processes in the system whose name contains only systemd like systemd-journal, systemd-udev, systemd.Match Exact Process Name: Agent will monitor only if the given process name is found in the system.
Example: If a user has given a process name as systemd, agent will try to find the process name with systemd, if it is not found in the system agent will return nil.
Note
In the first 2 scenarios, If any input string or regex matches with multiple process names in the system, agent will consider those as new components.
For an example, If user has given the process name as systemd to monitor, agent will collect all the processes which matches with systemd i.e systemd-journald, systemd-udevd, systemd-resolved etc and all these processes are considered as the components of the process systemd and for each component it will list all the metrics.
Examples:
| Example regex | Example Description |
|---|---|
opsramp-agent@@@opsramp-shield | The component name is the respective process name. |
opsramp-.\*@@@chrome | The component name is the respective process name and other process names matching the regular expression. |
(ntpd|chrond)@@@notepad.\* | The component name is the process name matching with a given regular expression. If the string notepad.* matches with two process names such as notepad.exe and notepad++.exe. The component names are Notepad and Notepad++. |
processPattern1;;;DisplayName1@@@processPattern2;;;DisplayName2 | Use respective display names for each component while monitoring the same process with different arguments, where the component names are the display names for the respective process patterns. |
svchost.*NetworkService;;;svchost_NetworkService@@@svchost.*DcomLaunch;;;svchost_DcomLaunch | Enter the same display name while configuring [component filter](/solutions/monitoring/template/component-filters/) or component thresholds at the template or device level. Use the component name `svchost_NetworkService and svchost_DcomLaunch while defining the [component filters](/solutions/monitoring/template/component-filters/) and component thresholds. |
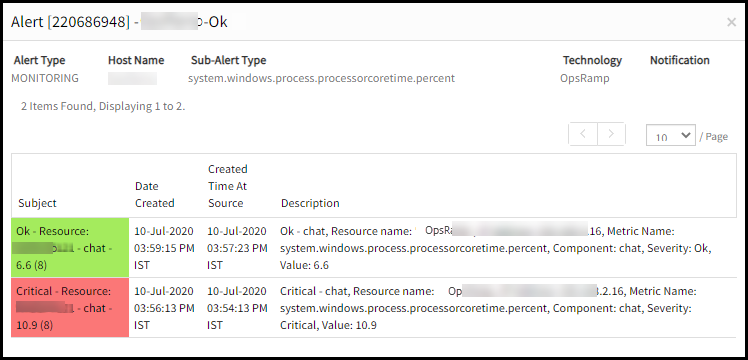
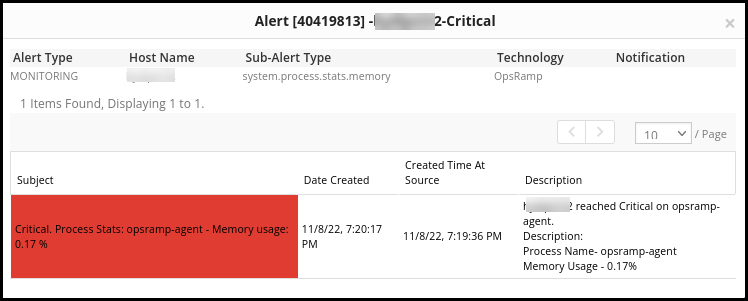
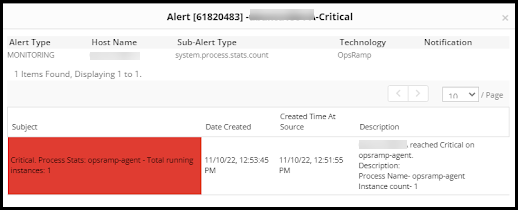
Process Statistics Alert
Alerting is available for Process Count, Memory, and CPU under the process statistics monitoring.
Alerts are sent when monitoring processes and can be viewed in the alert browser. The alert subject displays process alert details similar to those shown in the figure below:
View Collected Metrics
Go to Infrastructure > Resources > Device Details > Monitors > Monitors to view the collected metrics for the respective operating system:
- Windows: Agent G2 - Windows Process Monitoring
- Linux: Agent G2 - Linux Process Statistics Monitoring-v2
- Linux: Agent G2 - Linux Process Statistics Monitoring
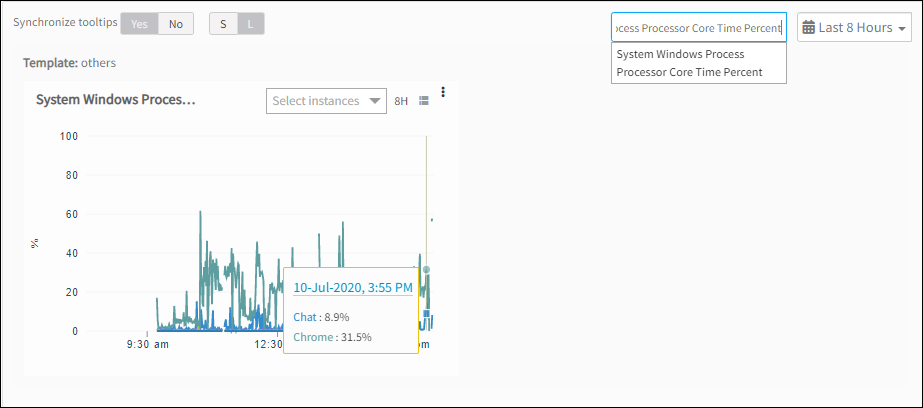
Validate Templates
Each metric name configured in the process statistics monitor has an associated graphical display. Go to Infrastructure > Resources > Device Details > Metrics and use the metric drop-down menu to select and view a metric graph.