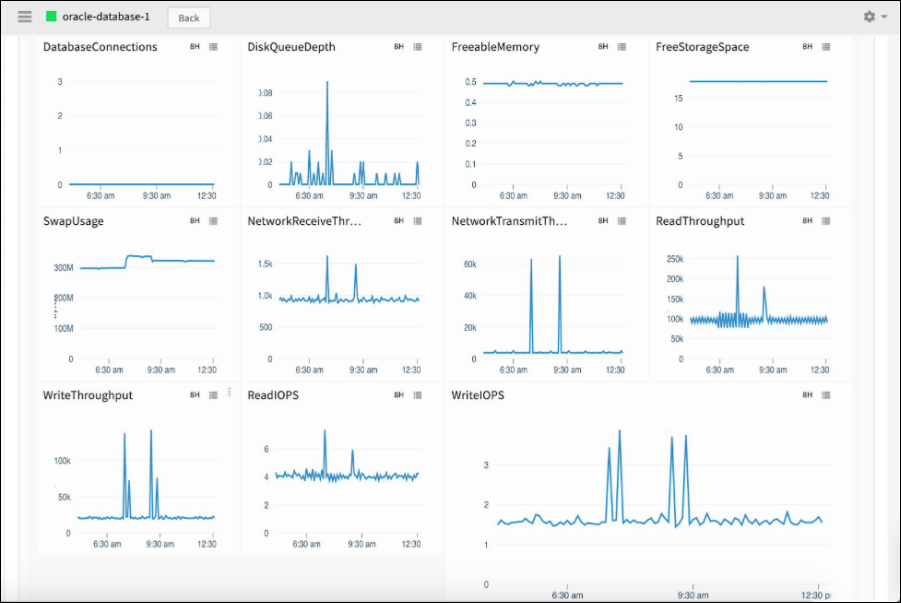
Databases store vital information required to run the enterprise efficiently and hence plays an integral role in the performance of an organization. The infrastructure availability weighs heavily on the database performance and any minor outage or slowdown can adversely affect the business. Tracking or monitoring databases help database administrators to analyze the application and take appropriate actions before it affects the end-users. The administrators can view the metric graphs to validate the performance and availability of the resource. For example, the metrics collected are:
- CPU utilization
- Total storage capacity
- Used storage capacity
- Maximum connection limits
- System uptime
- Current active and inactive session
- Session utilization
Using database monitoring, administrators can get:
- Improved end-user performance.
- Increased response time and database availability.
- Troubleshooting issues before it affects the end-users.
Supported database monitors
- Apache Cassandra
- CockroachDB
- CouchBase
- CouchDB
- DB2
- MongoDB
- MSSQL
- MySQL
- OracleDB
- PostgreSQL
- Sybase
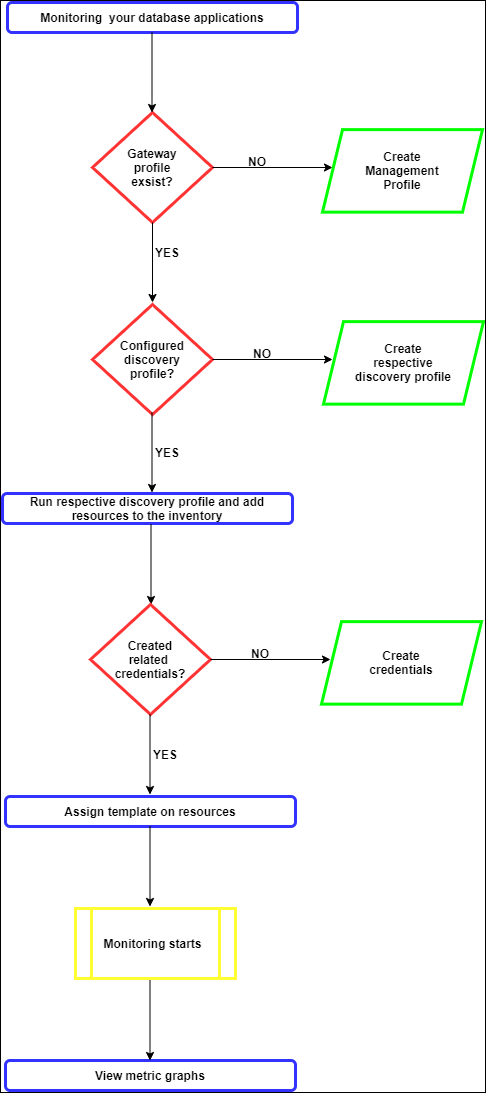
Database monitoring process flow
Visualization
Dashboard
After initiating the database monitoring, use dashboard to gather customized visibility of the resources in your managed environment. Create widgets such as Metric Value, Time Series, Metric List, and Top Metric Utilization to track the performance of the resources.
Alerts
The alerting process automatically detects the performance issues and sends alerts to the administrators.
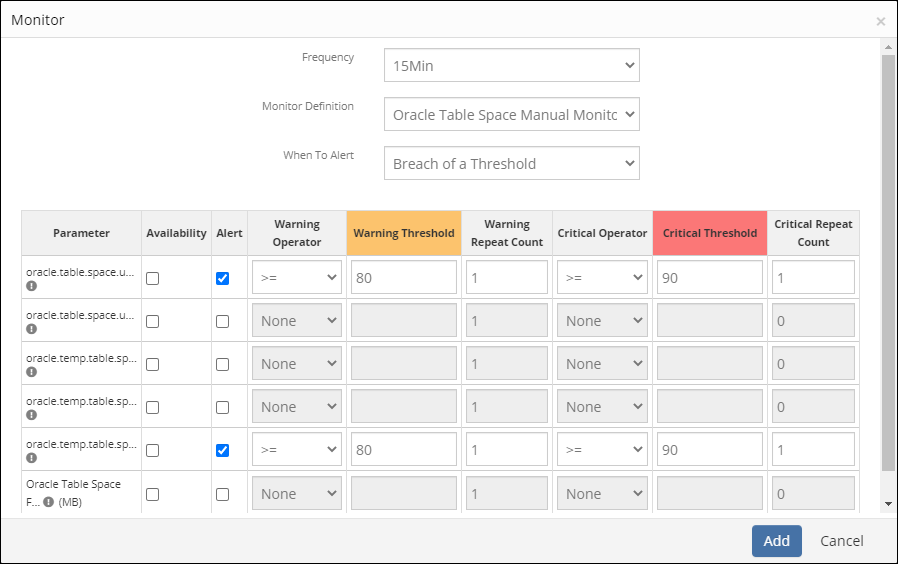
Generate alerts
Determine whether to generate alerts while you are configuring the metric thresholds and frequency.
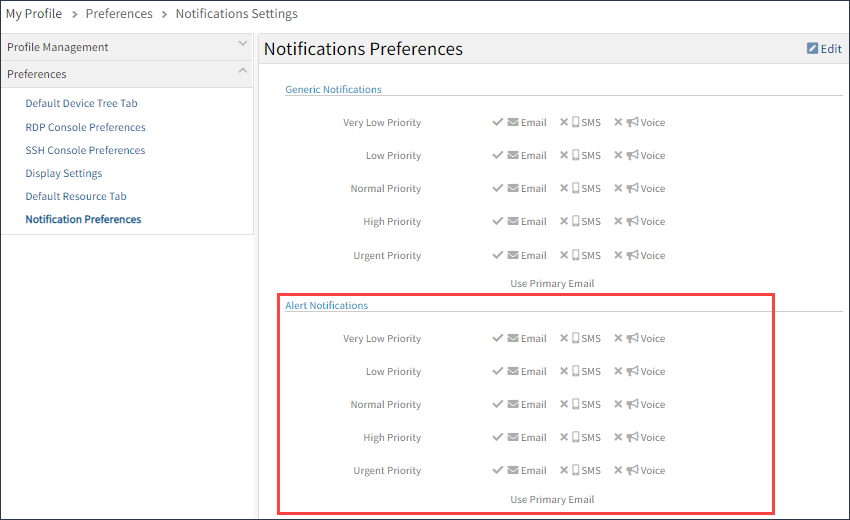
Set notifications
Setting notifications for any alert using email, SMS or voice can notify the administrator about the issue. For more information, see Manage Alert Notifications.
G2 Database Monitoring Support
| Metrics | Monitor | Monitor Configuration Parameters | Templates | |
|---|---|---|---|---|
| Adaptor Type | Application | Application | ||
| Application Type | MS SQL My SQL Oracle DB Postgre SQL | MS SQL My SQL Oracle DB Postgre SQL | MS SQL:
Application Type 'MSSQL'
Connection Timeout in ms
MSSQL Authentication Type
MSSQL Service Port My SQL: Application Type: 'MYSQL' Connection Timeout in ms MySQL service port MySQL service transport type MySQL DB instance list Oracle DB: Application Type: 'ORACLE_DB' Connection Timeout in ms ORACLE_DB service port ORACLE_DB connection type ORACLE_DB service transport type Postgre SQL: Application Type: 'POSTGRESQL' Connection Timeout in ms POSTGRESQL DB instance list POSTGRESQL service port POSTGRESQL service transport type | |
| Collector Type | Gateway | |||
| Monitor Type | Monitors | |||
| Applicable For | Device |