The Agent-based G1 custom monitor helps you to create your own script to create new monitors. To write a script, choose a supported scripting language. For example, Python, Windows PowerShell, and SHELL.
Create Agent-Based Custom Monitors
To create agent-based custom monitors:
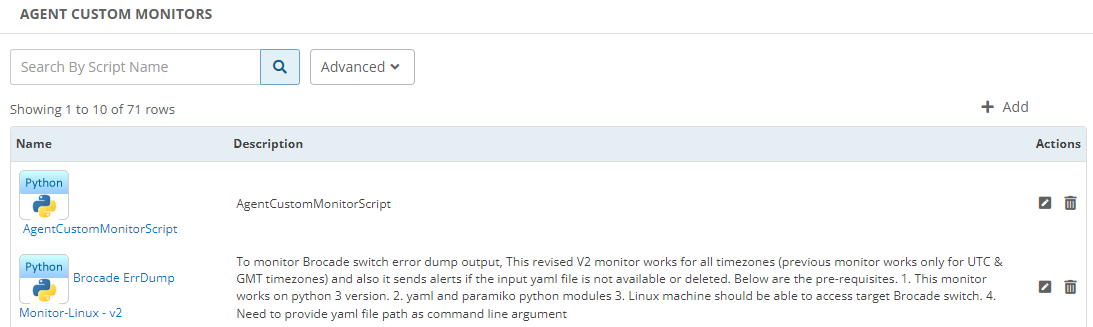
Go to Setup > Monitoring > Agent Custom Monitors.
From AGENT CUSTOM MONITORS, click + Add.
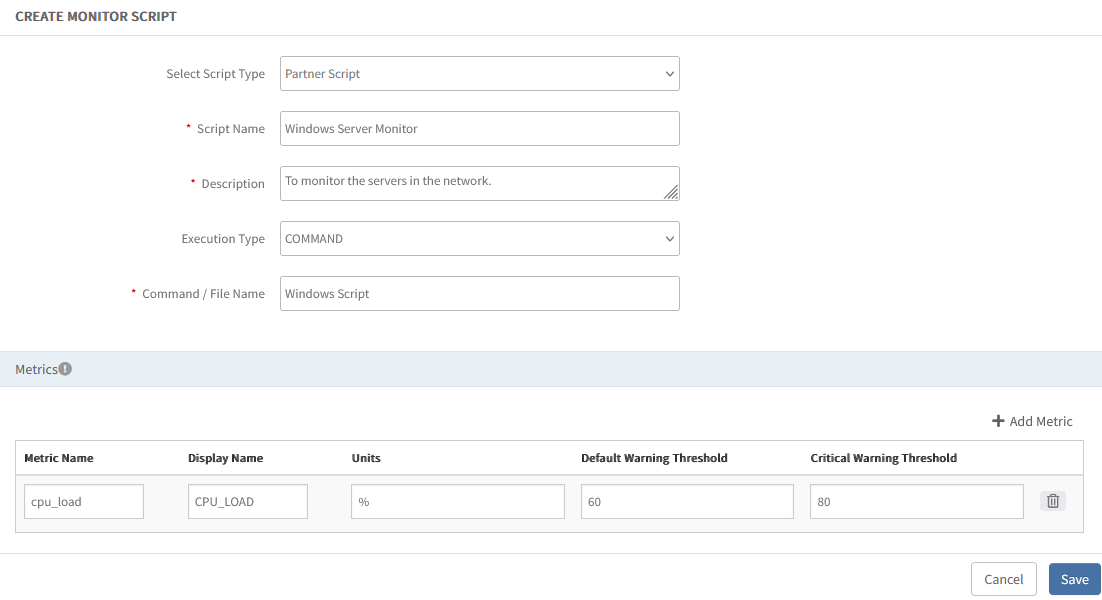
From CREATE MONITOR SCRIPT, provide details for the following parameters:
Select Script Type: Scripts applicable for partners and clients.
Script Name: Unique name provided for the script.
Description: Detailed description that explains the reason for the script.
Execution Type: Select the type of execution. Depending on the selected type of execution, the screen displays more fields. For example, if you select
EXEas execution type, the File field is displayed below. You can use Choose File to upload the required .exe file. If you select any other execution type, you need to provide Command/File Name and the corresponding script extension.Metrics: Metrics required for the script.
To add Metrics:- From Metrics, click + Add Metric .
- Enter metric information.
Supported values for the fields:
Fields Recommended Not Recommended Metric Name alphanumeric characters and '_' only Space, special characters Display Name Alphanumeric characters and '_' only Space, special characters Units Alphabets only Numbers Warning Threshold Numeric values only Alphabets Critical Threshold Numeric values only Alphabets
Click Save.
AGENT CUSTOM MONITORS screen displays the new monitor.
After creating the Agent Custom Monitors, add the custom monitor to a template, and assign the template to a resource.
Note: You cannot create or update a monitor script in the same tenancy scope with the same filename. An error message is displayed saying, “Duplicate Custom monitor script name. File already exists in the current tenancy scope. Please consider a different name.”
Agent-Based Custom Monitor Scripts
Use the following custom monitor scripts for G1 Agents:
- VBS Script
- PERL Script
- PHP Script
- PYTHON Script
- BASH Script
- POWERSHELL Script
Set up Folders and Users
By default, all the custom monitor scripts and log files are downloaded to a predefined location in your system. The system user (Windows) and root user (Linux) holds all required permissions (Read, Write, and Execute) on the download folders.
The following table provides the default folder locations and users for Windows and Linux:
| Operating System | Default Folder Location | Default User |
|---|---|---|
| Windows |
| System User |
| Linux | /opt/opsramp/agent/lib/libexec/ | Root User
|
Manage Agent Custom Monitors
You can manage the configured agent custom monitors using multiple methods as described below.
Search
You can use the search option to find a custom monitor by the script name. For searching with criteria, use the Advanced option.
Advanced search
To use the advanced search:
- Click Advanced.
- From ADVANCED SEARCH window, enter the following parameters:
- Scope
- Script Name
- File Name
- Description
- Click Search.
View custom monitor script
After creating an agent custom monitor script, you can view the details such as metrics and templates from the VIEW CUSTOM MONITOR SCRIPT screen.
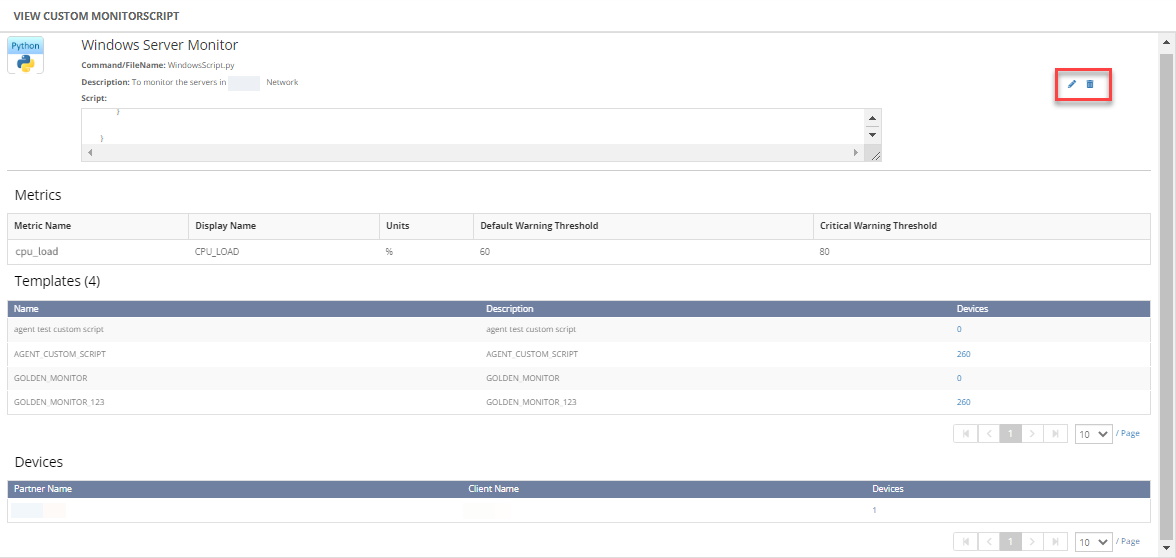
Edit/Delete custom monitor script
If you want to make any changes to your existing script or delete them, use the following options from the VIEW CUSTOM MONITOR SCRIPT screen:
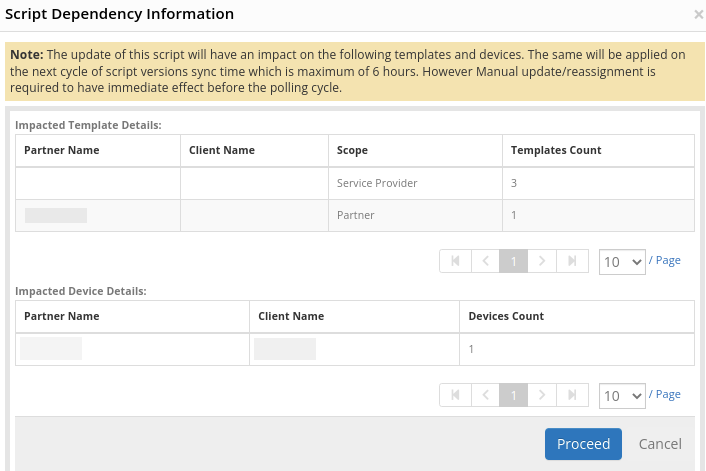
- Edit: To make changes to the configured script, click the edit icon > modify the changes > click the update button to save the changes.
If the script is already assigned to any template/devices, we will display a Script Dependency Information popup, which shows the details of impacted templates and devices.
- Delete: To remove your scripts from the list, click the delete icon and then select Yes.
Create a Template using Agent-Based G1 Custom Monitor
You can add the Agent-based custom monitor to a template to initiate the monitoring of your resources.
To add an agent-based G1 custom monitor to a template:
- Select a client from the All Clients list.
- Go to Setup > Monitoring > Templates.
- From the Templates screen, click + Add.
- From MONITOR TEMPLATE, provide details for the following parameters and click Save.
- Select Template Scope: Template type.
- Collector Type: Select Agent.
- Monitor Type: Select G1 Monitors.
- Applicable for: Select Device.
- Template Name: Name of the template.
- Description: Summary of the template.
- Generation: Generation that the template belongs to.
- Tags: User-defined tags for better filtering.
- Prerequisites: Essential things that you must consider while monitoring using the template.
- Status: Active or End-of-life templates.
- Notes: Information that you want to add to the template.
- Template Family Name: Category that applies to the application. For example, Windows Server, Storage Server, and Network Server.
- Deployment Type: One of the following methods to apply the template to the resources:
- Custom
- Optional
- Standard
After providing the template details, MONITOR TEMPLATE displays the various available Monitors. - Go to Agent Custom Monitors.
The console for the Monitors section varies with the option selected in the Collector Type.
- To add details in Agent Custom Monitors:
- From the Agent Custom Monitors section, click + Add.
- From Agent Custom Monitor, provide details for the following parameters:
- Frequency: Refer to the frequency to execute the template.
- Monitor: Available Agent custom monitors.
After selecting the Monitor, you can enter the Params, Warning, and Critical threshold values. - Select Monitor, Availability, and Alert checkbox to initiate monitoring.
After adding the Agent custom monitor to a template, assign the template to a resource to initiate monitoring.
File Integrity Check
OpsRamp will verify for the custom script for file integrity and ensure that the file checksum remains the same before performing the monitor script execution. If the G1 based custom monitor script on the resource is changed, OpsRamp will redownload the original monitor script from the source for security reasons and continue the monitoring.
During this process, a critical alert will be generated on the resource about the “File checksum mismatch” and the users will be notified about the script modification on the resource.
How to Develop a Sample Bash Script
Input configuration parameters
Only Bourne Again SHell (bash), Korn shell (ksh) support arrays. Because the parameters need to be parsed and assigned to arrays, only bash, ksh shell scripts must be used for writing custom monitor plugins.
Bourne shell (sh) does not support arrays.
The shebang lines #!/bin/bash, #!/bin/sh are required for the scripts.
For example:
./sample.sh
    "/metricName::metricName1|metricName2"
    "/metric::displayName1|displayName2"
    "/warn::warn1|warn2" "/critical::crit1|crit2"
    "/alert::do_alert1|do_alert2"
    "/params::'args_string1|args_string2'"
#!/bin/bash
LANG=C`
Parsing Arguments
Use the following block of code to parse arguments in your custom monitor bash scripts.
 script_dir=$(dirname $0)
 params=`echo $@ | tr " " "\n"`
 for param in $params
 do
 	case "$param" in
		/metricName::*)
			IFS="|" read -ra metricNames<<<"${param#*::}"
		;;
		/metric::*)
			IFS="|" read -ra metrics<<<"${param#*::}"
		;;
		/warn::*)
			IFS="|" read -ra warnings<<<"${param#*::}"
		;;
		/critical::*)
			IFS="|" read -ra criticals<<<"${param#*::}"
		;;
		/alert::*)
			IFS="|" read -ra doAlerts<<<"${param#*::}"
		;;
		/params::*)
			userParamsString=$(echo ${param#*::} | sed -e "s/'//g")
			IFS="|" read -ra userParams<<<"$userParamsString"
		;;
		*)
	esac
 done
Accessing Variables
The following sample shows how to access the variables.
 arrayLen=${#metricNames[@]}
 for (( x=0; x<$arrayLen; x++ ));
    echo ${metricNames[x]}
     echo ${metrics[x]}
     echo ${warnings[x]}
     echo ${criticals[x]}
     echo ${doAlerts[x]}
     echo ${userParams[x]}
     echo ""
 done
You need metric display names for graphical data in JSON payload. Example: “metric” : “displayName1”
Warning and critical thresholds help to calculate the alert state of a metric.
| Variable | Description |
|---|---|
| arrayLen | Number of metrics to be monitored |
| metrics | Array contains all metrics display names |
| warning | Array contains all metrics warning threshold values |
| critical | Array contains all metrics critical threshold values |
| doAlerts | Array contains all metrics alerts flag values |
| userParams | Array contains all metrics respective user parameters |
Displaying Graphs
For graphing the metric values and for alerting, the script must write the output to the console in the below json format.
{
    "metric" : "displayName1",
    "component" : "instance1",
    "value" : "value1",
    "state" : "alert state1",
    "alert_desc" : "alert description1",
    "hostname/address/id" : "host1"
},
{
    "metric" : "displayName2",
    "component" : " instance2",
    "value" : "value2",
    "state" : "alert state2",
    "alert_desc" : "alert description2",
    "hostname/address/id" : "host2"
}| Values | Description |
|---|---|
| metric (required) | Metric name |
| component | Instance name of Metric (only when you have multiple instances) |
| *value | Value of metric or instance |
| state | Alert state of the metric(Only if they need Agent to handle alerts) |
| alert_desc | Alert description (Only if they need Agent to handle alerts) |
| hostname | Hostname of remote host (only for posting metrics to other hosts) |
| address | IPAddress of remote host (only for posting metrics to other hosts) |
| id | Resource ID of the remote host (only for posting metrics to other hosts) |
Provide one of the following values: hostname, address, or id (only when metrics need to post on remote hosts).
- If a user wants to send metric data to a remote host named
XYZ, JSON object should be represented as “hostname”:XYZ. - If a user wants to send metric data to a remote host with IP address
x.x.x.x, JSON object should be represented as “address”:x.x.x.x.
Possible values for state are: #OK #Warning #Critical
Viewing graphical representations
To view the graphical representation of the monitoring:
From All Clients, select a client.
Go to Infrastructure > Resources, select a resource type.
Click the resource name.
From the left pane, click Metrics. The graph is displayed with display names:
displayName1,displayName2.- The graph of displayName1 consists of three values val1, val2, val3 that are plotted against key1, key2 and key3 respectively.
- The graph of displayName2 consists of two values val1, val2 that were plotted against key1 and key2 respectively.
How to Develop a Sample Python Script
Input configuration parameters
The script executes for the metrics at a periodic interval that can be set.
Python sample.py:
    "
    /metricName::metricName1|metricName2
    /metric::displayName1|displayName2
    /warn::warn1|warn2
    /critical::crit1|crit2
    /alert::do_alert1|do_alert2
    /params::args_string1|args_string2
    "
Parse arguments
Use the following code snippet as an example of how to parse custom monitor arguments:
api = None
try:
	sys.path.insert(0, os.path.dirname(os.path.realpath(__file__)))
	from ScriptMonitorPythonApi import ScriptMonitorPythonApi
	api = ScriptMonitorPythonApi(sys.argv)
except Exception, emsg:
	sys.exit()
arrayLen = len(api.metricNames)
metrics = api.metrics
warning_thres = api.warnings
critical_thres = api.criticals
do_alerts = api.doAlerts
userParams = api.userParams| Variables | Description |
|---|---|
arrayLen | Number of metrics to be monitored. |
metrics | Array contains all metrics display names. Metric display names are needed to graphically display the JSON payload. For example, "metric" : "displayName1" |
warning_thres | Array contains all metrics warning threshold values. |
critical_thres | Array contains all metrics critical threshold values. Critical threshold values help calculate the metric alert state. |
do_alerts | Array contains all metrics alerts flag values. |
userParams | Array contains all metrics respective user parameters.Note:The user parameters must not contain the following strings:
|
Display graphs
For graphing the metric values and for alerting, the script must write the output to the console, as shown in the following JSON-formatted example:
[
	{
		"metric" : "displayName1",
		"component" : "instance1",
		"value" : "value1",
		"state" : "alert state1",
		"alert_desc" : "alert description1",
		"hostname/address/id/container_id" : "host1/container_id"
	},
	{
		"metric" : "displayName2",
		"component" : "instance2",
		"value" : "value2",
		"state" : "alert state2",
		"alert_desc" : "alert description2",
		"hostname/address/id/container_id" : "host2/container_id"
	}
]| Values | Description | Required |
|---|---|---|
metric | Metric name. | Yes |
component | Metric instance name. | Include only when there are multiple instances. |
value | Metric or instance value. | Yes |
state | Metric alert state. Valid state values:
| Include only if the agent needs to handle alerts. |
alert_desc | Alert description. | Include only if the agent needs to handle alerts. |
hostname | Remote host hostname. For example, to send metric data to a remote host named XYZ, the JSON object notation is "hostname": 'XYZ'. | Include when needed to post metrics to other hosts. |
address | Remote host IP address. | Include only when needed to post metrics to other hosts. |
id | Remote host resource ID. For example, to send metric data to a remote host with IP address x.x.x.x, the JSON object notation is "id": 'x.x.x.x'. | Include only when needed to post metrics to other hosts. |
container_id | Remote host container ID. | Include only if the metrics need to be plotted against a container. Otherwise, omit this field. |
View graphical representations
To view the graphical representation of the monitoring:
From All Clients, select a client.
Go to Infrastructure > Resources and select a resource type.
Click the resource name to view the Overview page.
In the left panel, click Metrics to display a graph with the following display names:
displayName1Displays three valuesval1,val2, andval3plotted againstkey1,key2andkey3, respectively.displayName2Displays two valuesval1andval2plotted againstkey1andkey2, respectively.
How to Develop a Sample Powershell Script
Input configuration parameters
Custom monitor PowerShell scripts are provided with below input parameters from Agent while invoking the script.
Cscript custom_script.ps1
    "
    /metricName::metricName1|metricName2
    /metric::metric1|metric2
    /warn::warn1|warn2
    /critical::crit1|crit2
    /alert::do_alert1|do_alert2
    /params::"args_string1|args_string2"
"Note: The input parameters must not contain the following string: $$$_$$$
Parsing parameters
Use the following block of code in all the PowerShell custom monitor scripts to parse the parameters.
 if($args.count -gt 0)
	{
	for($i=0 ;$i -le $args.count-1 ;$i++)
	{
		$strArgs = $strArgs + [string]($args[$i])
  	}
	}
	if($strArgs.Contains("/metricName::") -ne 0)
	{
		$MetricNameTokens1 = $strArgs -split "/metricName::", 2
                       $MetricNameTokens= $MetricNameTokens1[1].Trim()
		if($MetricNameTokens.Contains("/") -ne 0)
		 {
			$MetricNameTokens1 = $MetricNameTokens -split "/", 2
                  		$MetricNameTokens = $MetricNameTokens1[0].Trim()
                  			#write-host "metricName " + $MetricNameTokens
	      		 }
	}
		if($strArgs.Contains("/metric::") -ne 0)
	{
                  $MetricTokens1 = $strArgs -split "/metric::", 2
                  	    $MetricTokens = $MetricTokens1[1].Trim()
	    if($MetricTokens.Contains("/") -ne 0)
	    {
	         $MetricTokens1 = $MetricTokens -split "/", 2
		    $MetricTokens = $MetricTokens1[0].Trim()
		    #write-host "Metric is " + $MetricTokens
	   }
         }

                if($strArgs.Contains("/warn::") -ne 0)
	 {
		   $Warning_ThresTokens1 = $strArgs -split "warn::", 2
		   $Warning_ThresTokens = $Warning_ThresTokens1[1].Trim()
        		   if($Warning_ThresTokens.Contains("/") -ne 0)
		   {
			   $Warning_ThresTokens1 = $Warning_ThresTokens  -split "/", 2
			   $Warning_ThresTokens =  $Warning_ThresTokens1[0].Trim()
			     #write-host "warn is " + $Warning_ThresTokens
		   }
          }
                 if($strArgs.Contains("/critical::") -ne 0)
	  {
		  $Critical_ThresTokens1 = $strArgs -split "/critical::", 2
		  $Critical_ThresTokens = $Critical_ThresTokens1[1].Trim()
		  if($Critical_ThresTokens.Contains("/") -ne 0)
		  {
	  	$Critical_ThresTokens1 = $Critical_ThresTokens -split "/", 2
		$Critical_ThresTokens = $Critical_ThresTokens1[0].Trim()
	#write-host "critical is " + $Critical_ThresTokens
		  }
	  }
                if($strArgs.Contains("/alert::") -ne 0)
	  {
		   $Alert_FlagTokens1 =  $strArgs -split "/alert::", 2
		   $Alert_FlagTokens = $Alert_FlagTokens1[1].Trim()
		   if($Alert_FlagTokens.Contains("/") -ne 0)
		   {
		    $Alert_FlagTokens1= $Alert_FlagTokens -split "/", 2
		    $Alert_FlagTokens=  $Alert_FlagTokens1[0].Trim()
		            #write-host "Alert_FlagTokens " + $Alert_FlagTokens
		   }
	    }
            if($strArgs.Contains("/params::") -ne 0)
	    {
		$ParamsTokens1 = $strArgs -split "/params::", 2
		$ParamsTokens = $ParamsTokens1[1].Trim()
		if($ParamsTokens.Contains("/") -ne 0)
    {
		$ParamsTokens1 = $ParamsTokens -split "/", 2
			$ParamsTokens = $ParamsTokens1[0].Trim()
			#write-host "params are " + $ParamsTokens
		}
     }
Sending performance data
The write-host parameter is used to send performance data.
For example: write-host "The Alert Flag tokens are " + $Alert_FlagTokens
Sending alerts
Use the following code to send alert.
 Function SendAlertToAB
 {
    	param([string]$MetricInstance,[string]$Instance,[string]$OldState,[string]$NewState,[int]$Value)
	$currTime = [System.DateTime]::Now
		$timeStamp = [string]$currTime.Year + "-" + [String]$currTime.Month + "-" + [String]$currTime.Day + " " +
[string]$currTime.Hour + ":" + [string]$currTime.Minute + ":" + [string]$currTime.Second
	$SocketXML = ""
	$SocketXML = $SocketXML + "AlertOutput"
	$SocketXML = $SocketXML + ""+ $MetricInstance+""
	$SocketXML = $SocketXML + ""+ $NewState+""
	$SocketXML = $SocketXML + ""+ $OldState+""
	$SocketXML = $SocketXML + "Value of metric " + $MetricInstance + ":" + $Instance + " is " + $Value +""
	$SocketXML = $SocketXML + "" + $timeStamp + ""
	$SocketXML = $SocketXML + "Monitoring"
	$SocketXML = $SocketXML + ""+ $MetricInstance+ "_" +$Instance+""
	$SocketXML = $SocketXML + "Value of metric " + $MetricInstance + ":" + $Instance + " is "+ $Value +"  "
	$SocketXML = $SocketXML + ""

# Invoke exe which sends data through socket if($fileAccessPath.contains("x86"))
        {
		& "C:\Program Files (x86)\OpsRamp\Agent\bin\AgentSockIPC.exe" $SocketXml
	}
	else
	{
		& "C:\Program Files\OpsRamp\Agent\bin\AgentSockIPC.exe" $SocketXml
	}
     }
Note
If you choose to install the agent in a custom directory, use the custom path provided below.Example: {custom_dir}\OpsRamp\Agent\bin\AgentSockIPC.exe