Before beginning your SNMP configuration, set up your instrumentation strategy, create gateway management profiles, and set up discovery profiles.
Create gateway management profiles
The gateway management profile helps in managing the discovery of resources. For more information, see Create Gateway Management Profiles.
Set up discovery profiles
An administrator can create discovery profiles based on the devices to discover. The Discovery and Deployment page displays the added discovery profile. For more information, see Discovery.
Create SNMP monitor with collector type SNMP
Creating SNMP monitors helps administrators to initiate monitoring and set thresholds to get alerts.
Enter the following parameters on the CREATE A MONITOR page:
Create an SNMP monitor
Parameter
Description
Monitor Scope
Partner- or client-level scope of monitor.
Adaptor Type
Monitor type.
Application Type
Resource type.
Name
Unique monitor name.
Description
Monitor description.
Is this monitor for a component that has multiple instances?
Select Yes for Tabular OID or No for Scalar OID
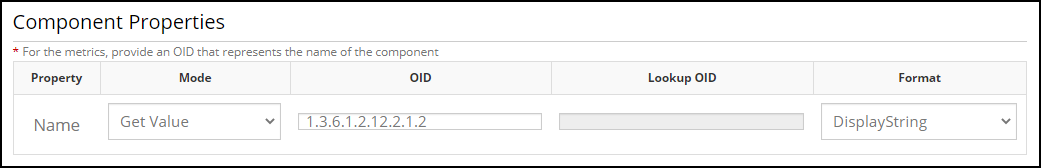
Component properties
Parameter
Description
Mode
Method to get the value or name of the component. Select one of the following options:
Get Value: Unique name of the component.
Get Index: OID Index value.
Lookup Index: OID index and matches with the index of the Lookup OID.
Lookup Value: OID Value and matches the index of the Lookup OID.
OID
Component OID.
Lookup OID
Object OID from another table with the same MIB as the component OID. The field is active only if you select Lookup Index or Lookup Value.
Format
OID data type in the MIB.
Additional properties
Parameter
Description
Name
Name of the OID
OID Type
Select one of the following options:
Scalar OID
Tabular OID
OID
Component OID to add the property.
Format Value
Method to get the monitoring output. Select Enumerated Map.
Provide an enumerated map
Key and value pair for each OID.
Unit
Method to evaluate the monitoring output. Skip Unit selection if Enumerated Map is already selected.
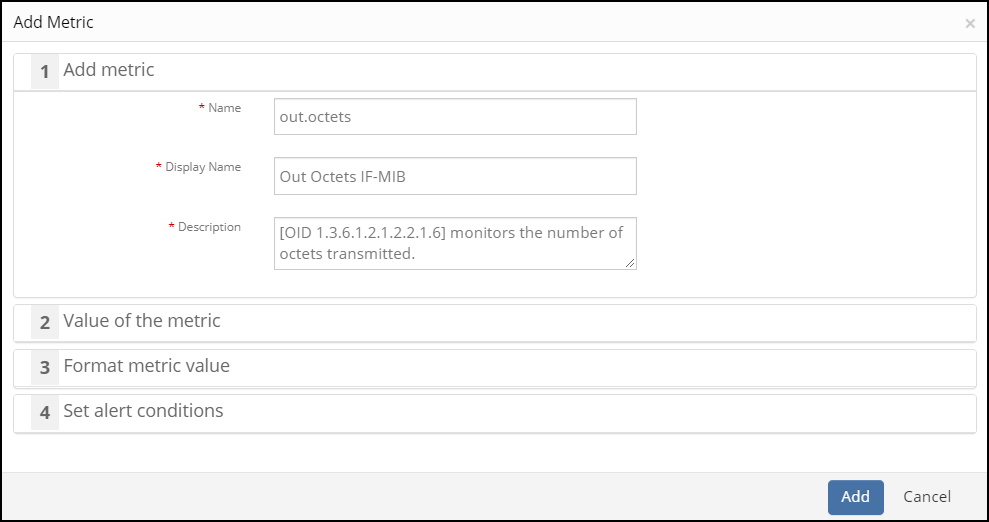
Add metric
Parameter
Description
Name
Name or label to define the metric displayed on the graphs. For example, hr.storage.utilization.
Display Name
Name or label to define the metric displayed on the dashboard.
Description
Reason for using the metric.
Value of the metric
Parameter
Description
Provide SNMP OID-based inputs.
Name
OID object name defined in the MIB.
OID
OID defined in the MIB. The scalar OIDs need to end with .0.
OID Type
Scalar or tabular OID
Data Type
OID base syntax defined in the MIB. Select the data type according to the metric.
Formula
Delta: Provides the difference between the current poll value and the previous poll value.
Rate: Provides the quotient of the difference between Current Poll Value and Previous Poll Value with Current Poll Time and Previous Poll Time. Arithmetically, Rate = (Current Poll Value)-(Previous Poll Value)/ (Current Poll Time)-(Previous Poll Time). Rate returns the value in per second format. For example, requests per second, bytes per second, errors per sec, and per sec.
Delta and Rate will return negative, zero, or positive values.
Counter Delta: Provides the difference between the current poll value and the previous poll value. Counter Delta = (Current poll value - Prev poll value)
Counter Rate - Provides the quotient of the difference between Current Poll Value and Previous Poll Value with Current Poll Time and Previous Poll Time. Arithmetically, Rate = (Current Poll Value)-(Previous Poll Value)/ (Current Poll Time)-(Previous Poll Time). Counter Rate returns the value in per second format. For example, requests per second, bytes per second, errors per sec, and per sec.
Counter Delta and Counter Rate will only return a positive value or zero. They will not return negative values.
Poll Frequency
Frequency for monitoring the devices. Select one of the following:
User-Defined: The chosen OID requires frequent monitoring.
Less Frequent: The chosen OID is monitored seldom. The OIDs are polled every eight hours.
Does the metric need additional inputs from user?
Name
Variable name used while calculating the metric value.
Description
Variable information.
Default Values
Variable value. For example, if you want to monitor the network interface bandwidth for WAN links, provide ISP speed value in Mbps, Kbps, or bps.
Calculate the value of the metric
Metric Value
Value of the SNMP OID: Selected by default when only a single SNMP OID-based input entry is available.
Using the inputs provided above, derive the value of the metric using an expression: Enter the Java-based mathematical expression to calculate the OID output. Example: (used/(used+free))*100, where `used` and `free` are SNMP OID-based names.
Get a single OID value as a metric result for multiple OID inputs.
Perform more mathematical calculations for multiple OID results.
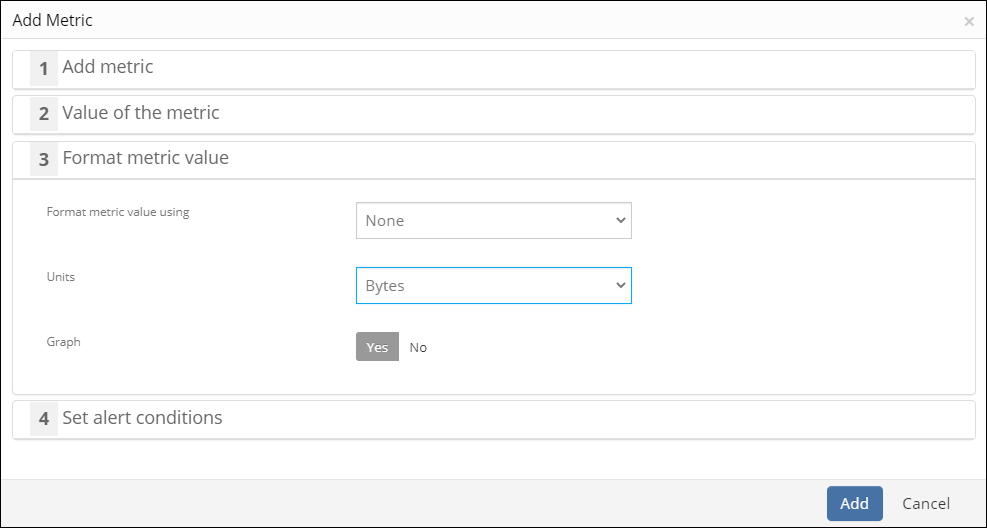
Format metric value
Parameter
Description
Format metric value using
Method to get the monitoring output. Select Enumerated Map.
Provide an enumerated map
Key and value pair for each OID. For example, the enumeration values for device health status OIDs are:
1 - up
2 - down
3 - testing
4 - downgrade
5 - warning
Use formatted value in
Alerts: To get alerts.
Graph: To generate metric graphs.
Units
Unit according to the metric value. For example, for performance OIDs, select Percentage(%). Skip Units selection if an enumerated map is already selected.
Graph
Select Yes to populate graphs for a metric.
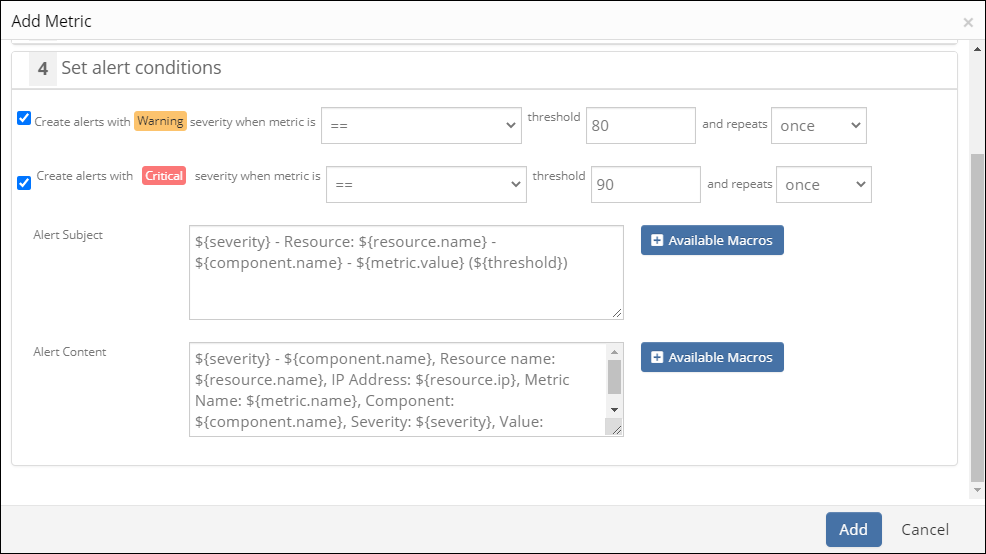
Set alert conditions
Parameter
Description
Warning severity
Warning alert is created when the metric matches the operator and exceeds the warning threshold value.
Critical severity
Critical alert is created when the metric matches the operator and exceeds the critical threshold value.
Alert Subject
Alert subject displayed for a warning or critical alert on the alert browser.
Alert Content
Alert description displayed on the alert details page. The actual values replace the alert subject displayed on the alert browser.
Graph
Select Yes to populate graphs for a metric.
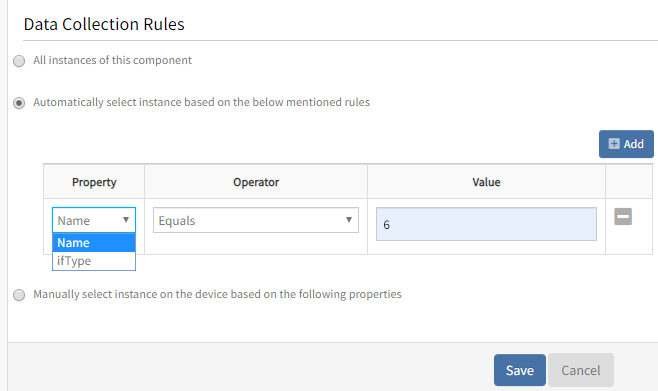
Data Collection Rules
Parameter
Description
All instances of this component
Monitors all component OIDs (Default selection).
Automatically select instances based on the below-mentioned rules
Add Value for the selected Property and Operator defined in the Additional Properties section to filter the monitoring components.
Manually select instances on the device based on the following properties
Select the components added in the Additional Properties section. You can view and choose the manually selected components while assigning templates to a resource.