The Remote Shell monitor enables using custom Bash, Perl, and Python scripts to monitor remote devices.
With this adapter framework, building separate scripts for each metric is not recommended as it is less efficient. If the number of metrics is high, it can consume more system resources, such as processes and CPU, on the end device. So this method is NOT RECOMMENDED, instead of this use RSE.
Prerequisites
Remote System
- Resource has SSH support.
- Installation of one of the scripting languages, such as Bash, Python, and Perl.
- All the libraries of the installed script are available in the remote system.
- The custom script follows the predefined OpsRamp response format.
- OpsRamp
- Gateway version 5.5.0.
- User credentials with permissions to create a metric, monitor, and template.
- Access to the remote device requires a valid SSH credential.
- Valid custom script execution path is provided in the monitors.
Constraints
- Do not support command arguments in the scripts.
- Cannot monitor gateway using Remote Shell.
Create metrics
You can create Custom Metrics using custom scripts.
Select a client from the All Clients list.
Go to Setup > Monitoring > Metrics.
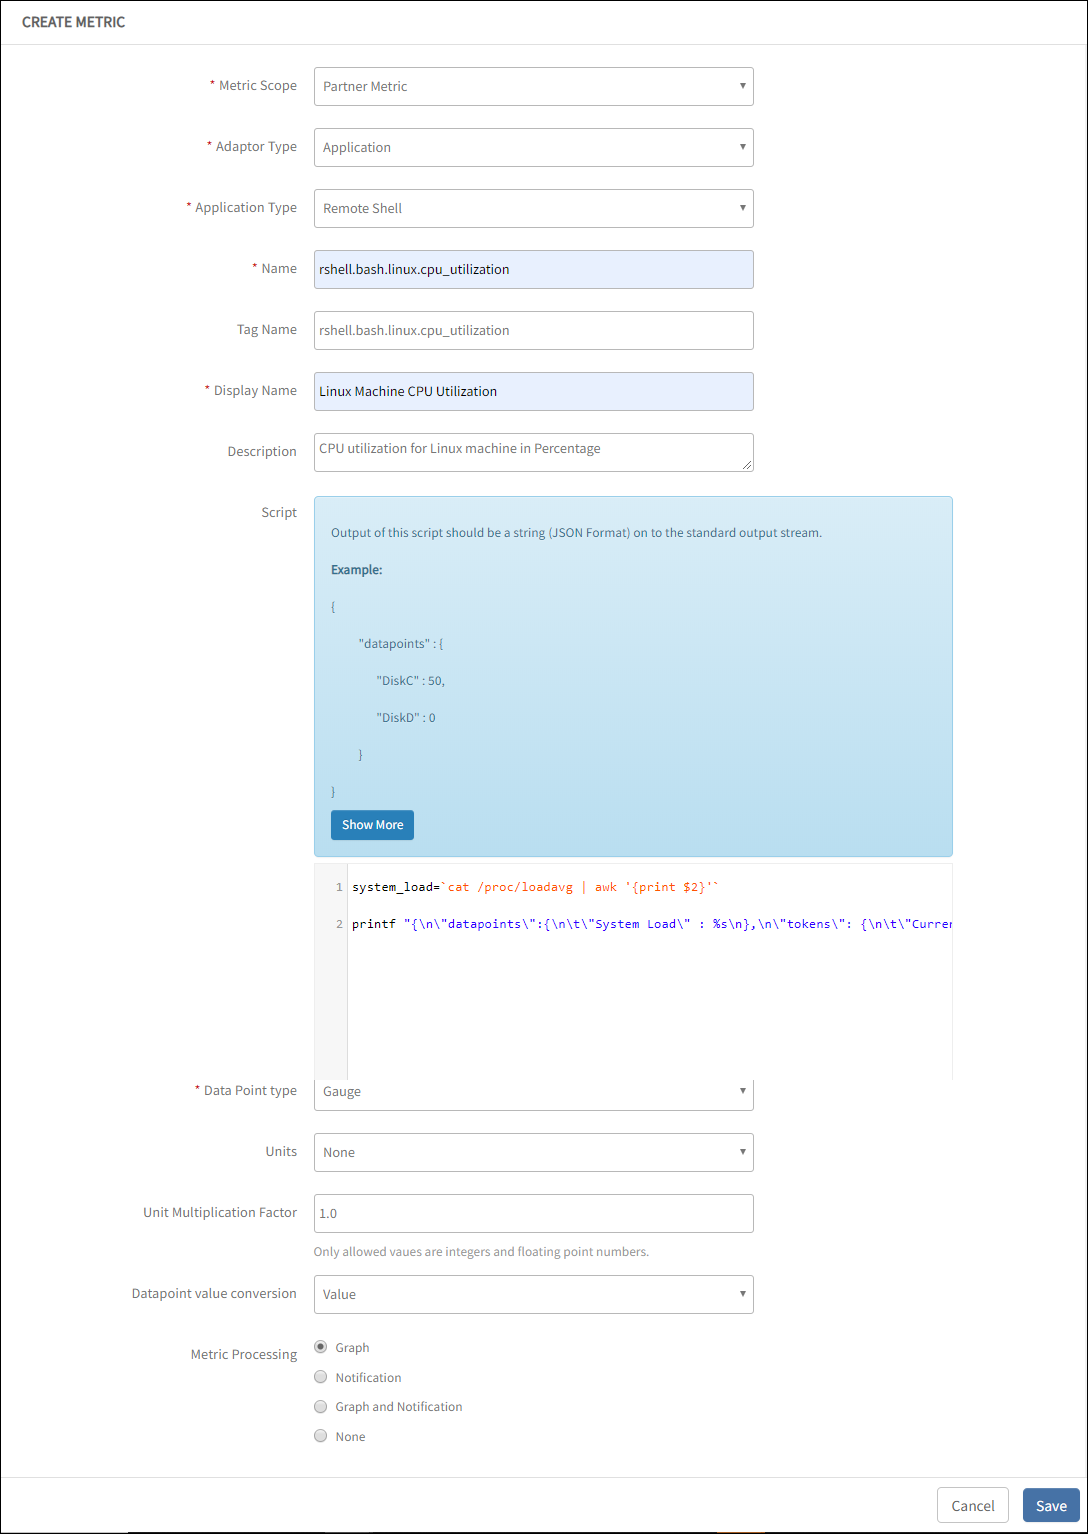
From the METRICS screen, click + Add and enter:
Collector Type: Select Application.
Application Type: Select Remote Shell.
Name: Enter a Name for the metric.
- The recommended metric naming convention is
<Prefix>_<Script Type>_<OS>_<Name>as naming convention for the metric. For example:rshell_bash_linux_disk_utilization,rshell.python.linux.cpu_utilization, andrshell_perl_linux_memory_utilization
- The recommended metric naming convention is
Tag: User-defined tags for better filtering. For example, Application, Adapter, RemoteShell.
Display Name: Display Name provided for the metric.
Description: Reason for the metric.
Script: Enter the custom script in the Script text box. Refer to Bash script and JSON outputs example for single and multiple datapoints to view the example script.
Data Point type: Select the required data point.
Units: Select the required values for Units, Unit Multiplication Factor, and Datapoint value conversion lists.
Unit Multiplication Factor: Value chosen to multiply a value based on the chosen unit.
Data Point Conversion: One of the following options:
- Value
- Enumerated Map
Metric Processing: One of the following values for processing the Metric:
Notification
Graph
Graph and Notification. To configure values for Graph and Notification, enter the details for the following parameters:
- Warning if value: Warning threshold value.
- Critical if value: Critical threshold value.
- Subject: Subject for the metric.
- Description: Description for the metric.
The values for Subject and Description are populated by default. It is recommend that you not change the values because it can result in an alert generation failure.
Click Save.
Create monitors
The custom remote shell monitor is a collection of remote shell metrics. You can create a template using the remote shell monitor.
- Monitor only one gateway using remote shell.
- Monitor to have metrics of the same script type.
- Select the custom parameter path depending on the script type.
From All Clients, select a client.
Go to Setup > Monitor Management > Monitors.
From Monitors, click + Add.
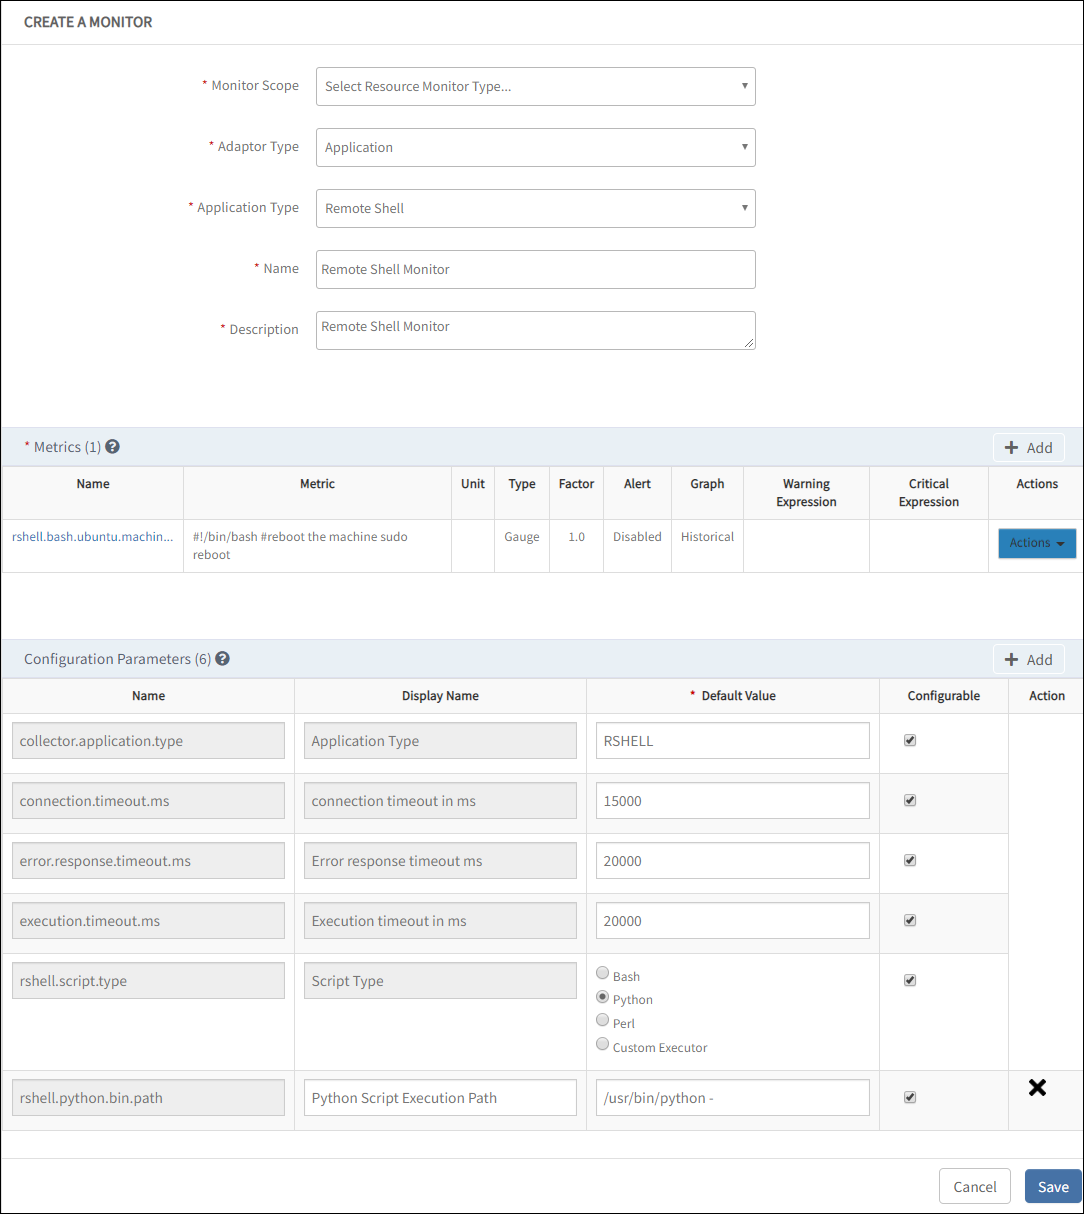
From Create a Monitor, enter the following parameters:
Monitor Scope: Scope for each monitor.
Adaptor Type: Select Application.
Application Type: Select Remote Shell.
Name: Unique monitor name.
Description: Details of the added monitors.
Metrics: A metric is a measurement for a specific characteristic of the performance of a device.
To add metrics:- From Metrics, click Add Metrics. A maximum of 20 metrics is recommended. Adding more number of metrics in a monitor can cause performance issues.
- Search the metric and click Add Metrics. The metrics section displays the selected metric.
Configuration Parameters: A configuration parameter is a user input to help the metric collector. To add parameters:
Enter Default Value for all the configuration parameters.
Select the Configurable checkbox and click Add.
Enter configuration parameters depending on your environment or devices. You can view the default value for the respective name selected. For example, the following shows the configuration parameters for a script type:
- bash:
rshell.bash.bin.path - python:
rshell.python.bin.path - perl:
rshell.perl.bin.path - custom executor:
rshell.customexecutor.bin.path
- bash:
Click Save.
Create templates
A template is an instance of a monitor and applied to devices.
Select a client from the All Clients list.
Go to Setup > Monitoring > Templates.
From the TEMPLATES screen, click + Add.
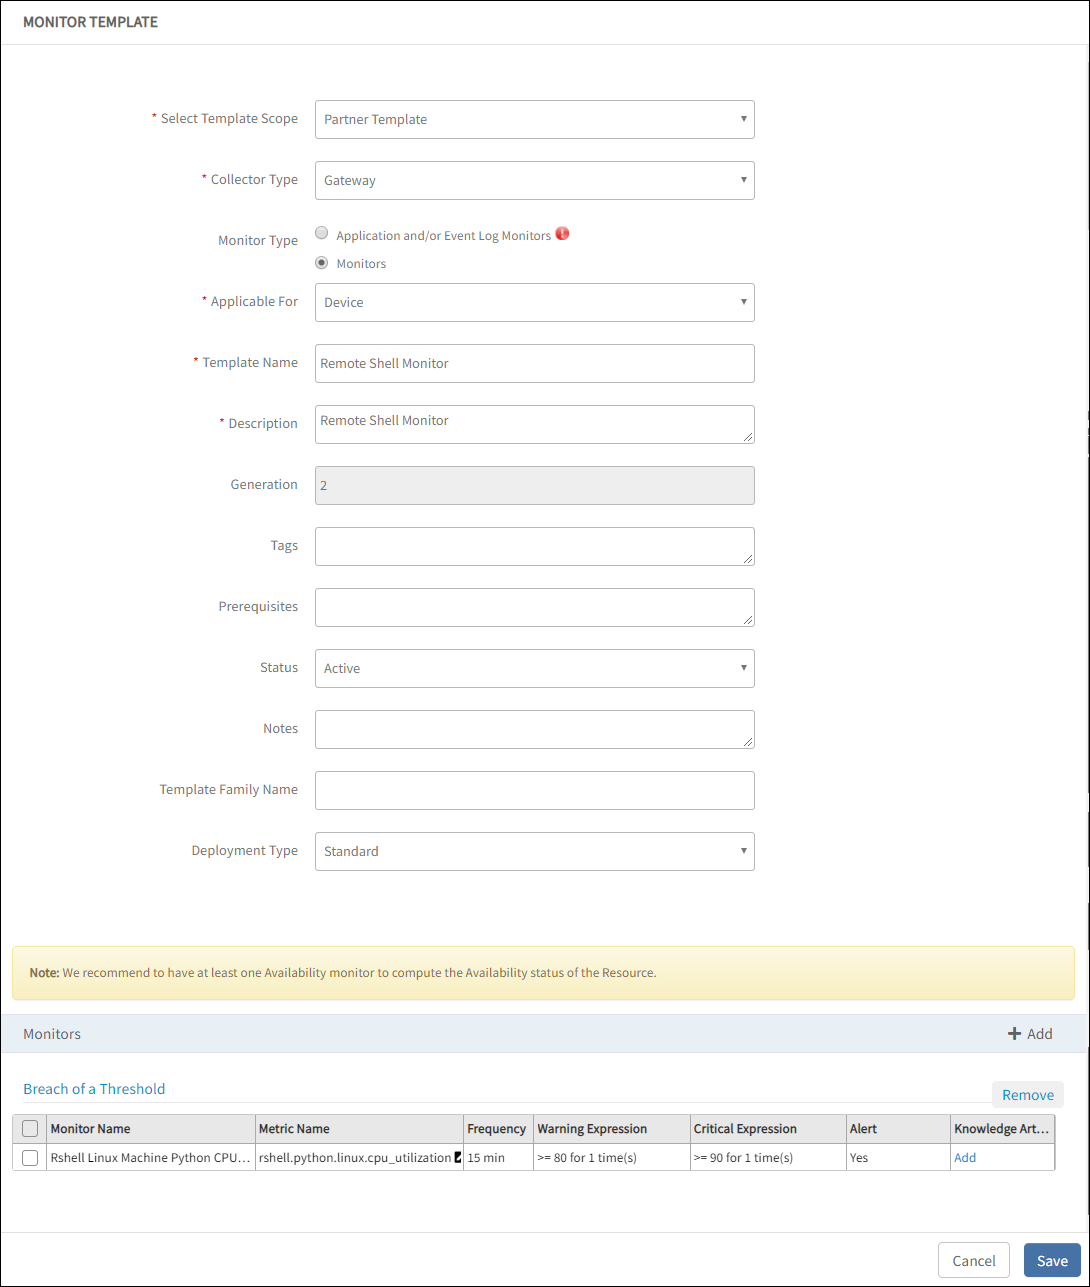
From MONITOR TEMPLATE, enter the following parameters:
Select Template Scope: Template type.
Collector Type: Select Gateway.
Monitor Type: Select Monitors for G2 Templates.
Applicable for: Select Device.
Template Name: Name of the template.
Description: Summary of the template.
Generation: Generation that the template belongs to.
Tags: User-defined tags for better filtering. For example, Application, Adapter.
Prerequisites: Essential things that you must consider while monitoring using the template. For example, check the SQL services while monitoring the SQL Parameters using the Windows templates.
Status: Active or End-of-life templates.
Notes: Information that you want to add to the template.
Template Family Name: Category that applies to the application. For example, Windows Server, Storage Server, and Network Server.
Deployment Type: One of the following methods to apply the template to the resources:
- Custom
- Optional
- Standard
After providing the template details, MONITOR TEMPLATE displays the Monitors section. The user interface for the Monitors section varies with the option selected in the Collector Type.
Monitor: To add details in Monitors:
From the Monitors section, click Add button.
From the Monitor screen, enter the following parameters:
- Frequency: Refer to the frequency to execute the template.
- Monitor Definition: Monitor type.
- When to Alert: Select Breach of a Threshold.
Select the Availability and Alert checkbox to initiate monitoring.
Click Save.
Assign templates
Creating credentials for the template
Select a client from the All Clients list.
Go to Infrastructure > Resources.
Select a resource, click Credentials, and +Add.
From Create New Credentials, provide details for the following parameters and Save:
- Name
- Description
- From the Type drop-down list, select SSH.
- Authentication Type
- Username
- Password
- Confirm Password
- Port
- Connection Time-out (ms)
Enter the details of the user with access to the remote device with SSH.
Assign the template to a resource
- Go to Infrastructure > Resources, select a resource, and click the resource name to view details.
- Go to Monitors > Templates and click +Assign Templates.
- From Apply Templates, select the templates. The selected Templates section displays the chosen templates.
- Click Assign. The template gets assigned to the selected device.
After assigning the template to a resource for monitoring, select Get Latest Metric Values to view the latest metric information.
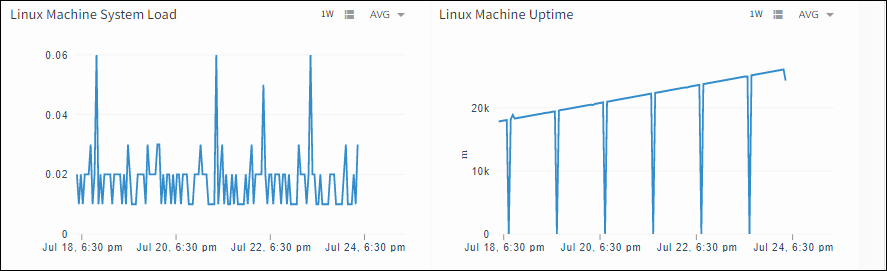
View graphs
The gateway monitors the remote system using the assigned templates and displays the results in a graphical format.
- Go to Infrastructure > Resources, select a required resource from the list of resources. Or, use the search option to find the resource.
- Click the resource name to view details.
- From the left pane, click Metrics. The Metrics page displays graphs generated by all monitoring templates assigned to a device.
- Search with the template name to filter the graphs.
Bash script examples
In these examples:
- Datapoints are used for plotting graphs.
- Tokens are used for alert information.
system_load=`cat /proc/loadavg | awk '{print $2}'`
printf "{\n\"datapoints\":{\n\t\"System Load\" : %s\n},\n\"tokens\": {\n\t\"Current System Load\" : \"%s\"\n}\n}\n" "${system_load}" "${system_load}"
Bash single datapoint and token
This example is a JSON output for a single datapoint and token.
{
"datapoints":{
    "System Load" : 1.60
},
"tokens": {
    "Current System Load" : "1.60"
}
}
Bash multiple datapoints and tokens
This example is a JSON output for multiple datapoints and tokens.
{
   "datapoints":{
           "DiskC" : 50,
           "DiskD" : 81
   },
   "tokens": {
           "disk_utilization.total" : "DiskC : 40 GB, DiskD : 100 GB",
           "disk_utilization.used" : "DiskC : 20 GB, DiskD : 50 GB"
   }
}