Windows PowerShell can help you to control and automate the administration of the Windows operating system and applications that run on Windows.
With this adapter framework, building separate scripts for each metric is not recommended as it is less efficient. If the number of metrics is high, it can consume more system resources, such as processes and CPU, on the end device. So this method is NOT RECOMMENDED, instead of this use RSE.
Prerequisites
- The PowerShell supports all versions of Windows devices
- Supported types: WQL queries and PowerShell scripts.
- Supported cmdlets: Get-WmiObject and Get-CimInstance.
- The target device must have WinRm in Running State (Enabled).
- Target device must have User privileges.
- Set the PowerShell environment variable in the target device.
- PowerShell script works only on Windows Gateway.
- Place the PowerShell script in Windows Gateway.
Default path:
/OpsRamp/Gateway/scripts/wmi/monitoring/rpshellscripts - The script must follow a predefined response format at the metric level.
- Arguments support for PowerShell script.
- No argument support for the metric level script.
- Gateway version 5.5.0.
- User credentials with permissions to create a metric, monitor, and template.
- Access to the remote device requires a single valid Powershell credential.
Create custom metrics
Custom metrics can be created with custom scripts.
Select a client from the All Clients list.
Go to Setup > Monitoring > Metrics.
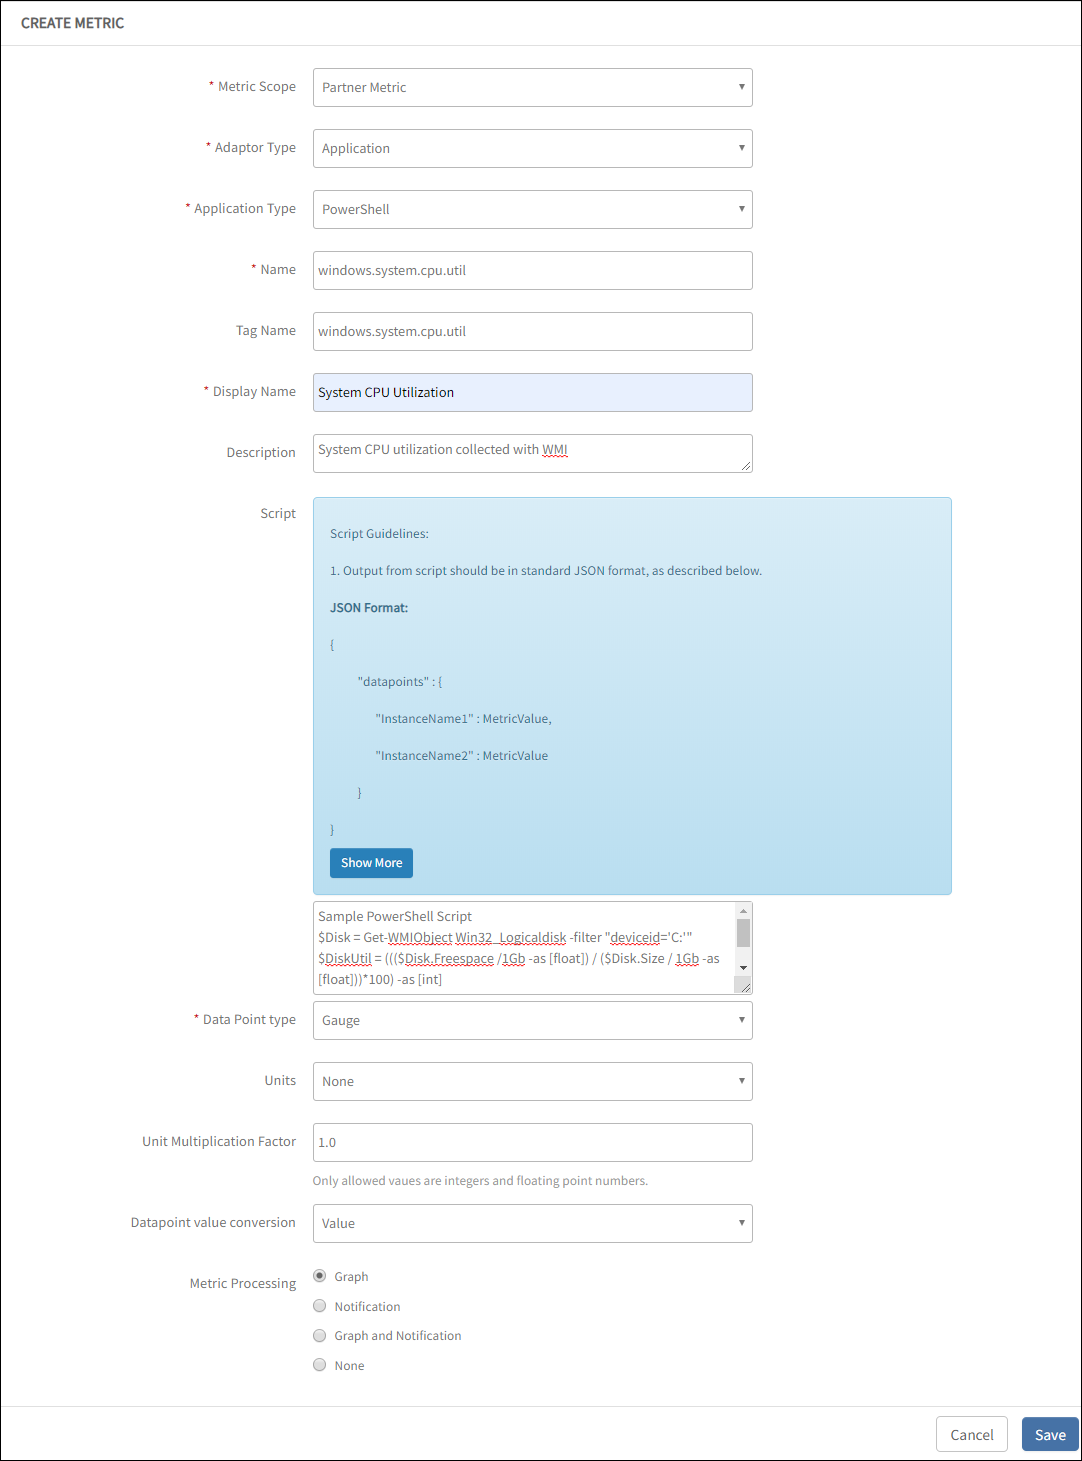
From METRIC, click + Add and enter:
Metric Scope: Partner Metric or Client Specific Metric.
Adaptor Type: Select Application.
Application Type: Select PowerShell.
Name: Unique Name for the metric. The recommended metric naming scheme convention is
<Prefix>_<Script Type>_<OS>_<Name>. For example:windows_system_cpu_utilization.Tag: User-defined tags for better filtering. For example, Adapter, PowerShell.
Display Name: Enter Display Name. For example, System Drive Free Space.
Description: Enter the reason for the metric.
Script: Custom script in the Script text box. You can refer to Script and JSON outputs-example to view the example script provided in the Script section in the user interface.
Data Point type: Value chosen to plot data in the graph.
Units: Required values for Units. You can choose Units depending on the chosen Data Point Type.
Unit Multiplication Factor: Value chosen to multiply a value based on the chosen unit.
Data Point Conversion: One of the following options:
- Value
- Enumerated Map
Metric Processing: One of the following values for processing the Metric:
Notification
Graph
Graph and Notification.
To configure values for Graph and Notification, enter:
- Warning if value: Warning threshold value.
- Critical if value: Critical threshold value.
- Subject: Subject for the metric.
- Description: Description for the metric.
The values for Subject and Description are populated by default.
It is recommended that the values not be changed because it can result in an alert generation failure.
Click Save.
Create monitor
Custom PowerShell monitor is a collection of PowerShell metrics. You can create a template using the PowerShell monitor.
Go to Setup > Monitoring > Monitors.
From Monitors, click + Add.
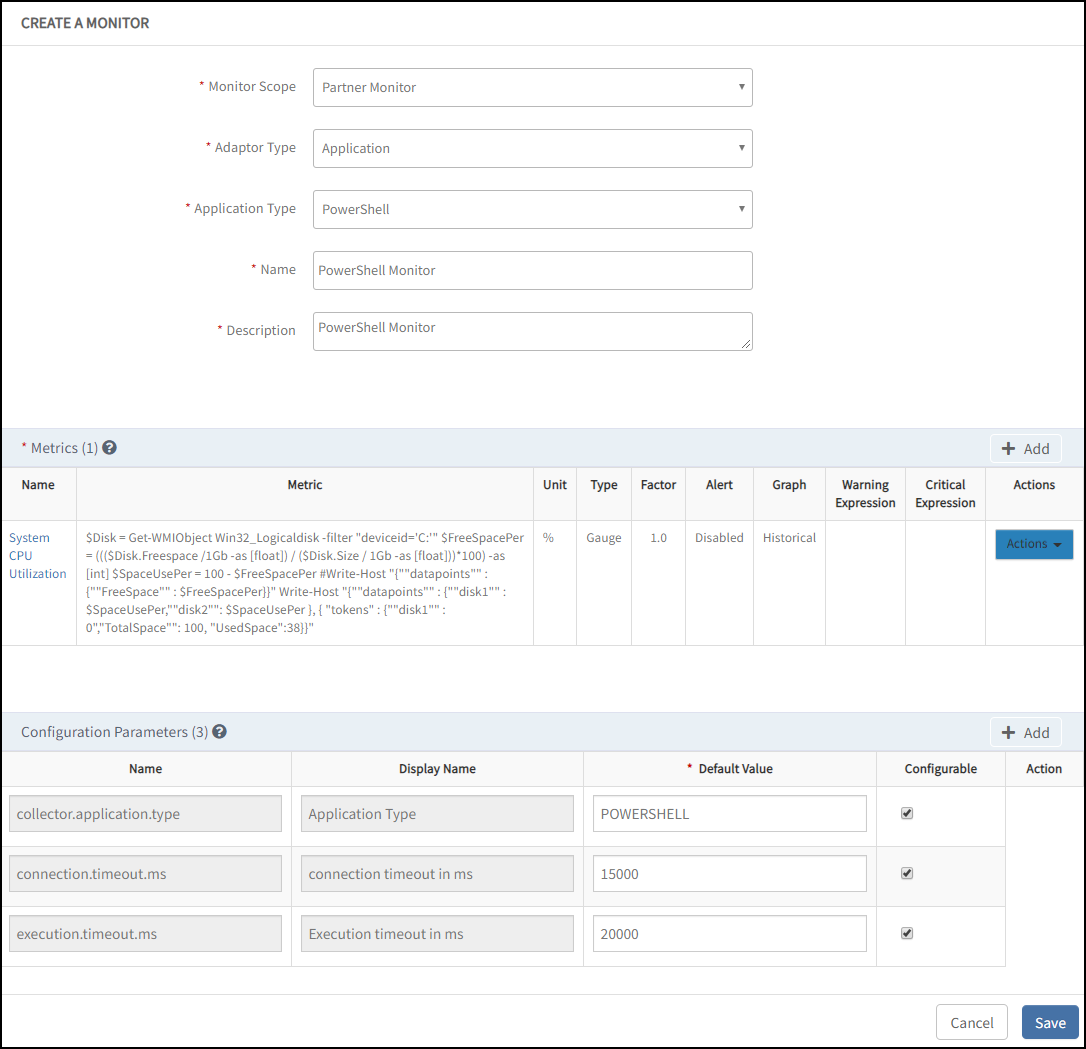
From CREATE A MONITOR, enter the following parameters:
Monitor Scope: Select Partner Monitor or Client Specific Monitor.
Type: Select Application.
Application Type: Select PowerShell.
Name: Enter a unique name for the metric.
Description: Enter the reason for creating the monitor.
After providing the monitor details, navigate to the Metrics section.
Metrics: To add Metrics:
- From Metrics, click Add Metrics.
- Search the metric and click Add Metrics. Metrics section displays the selected metric.
After adding the metrics, navigate to Configuration Parameters.
Configuration Parameters: To add configuration Parameters:
- Enter Default Value for all the configuration parameters.
- Select the Configurable checkbox.
- Click Add.
- Enter Configuration Parameters depending on the selected script type. You can view the default value for the respective Name selected.
Click Save.
Create template
A template is an instance of a monitor and applied to devices.
Select a client from the All Clients list.
Go to Setup > Monitoring >Templates and click + Add.
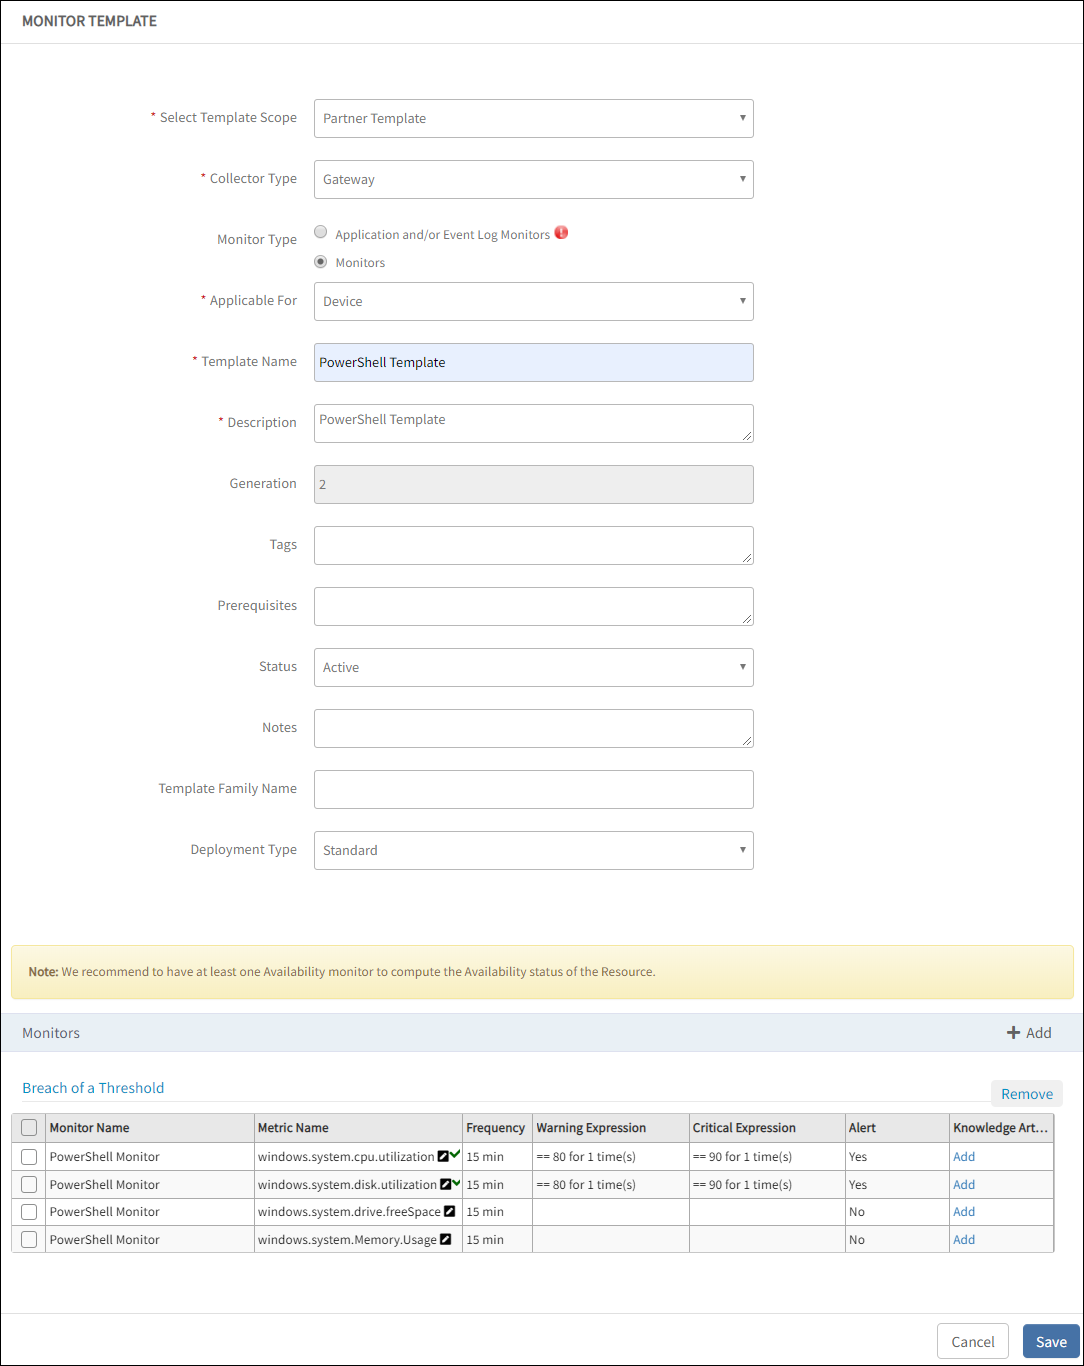
From MONITOR TEMPLATE, enter:
Select Template Scope: Template type.
Collector Type: Select Gateway.
Monitor Type: Select Monitors for G2 Templates.
Applicable for: Select Device.
Template Name: Name of the template.
Description: Summary of the template.
Generation: Generation that the template belongs to.
Tags: User-defined tags for better filtering.
Prerequisites: Essential things that you must consider while monitoring using the template. For example, check the SQL services while monitoring the SQL Parameters using the Windows templates.
Status: Active or End-of-life templates.
Notes: Information that you want to add to the template.
Template Family Name: Category that applies to the application. For example, Windows Server, Storage Server, and Network Server.
Deployment Type: One of the following methods to apply the template to the resources:
- Custom
- Optional
- Standard
After providing the template details, MONITOR TEMPLATE displays the Monitors section. The user interface for the Monitors section varies with the option selected in the Collector Type.
Monitor: To add details in Monitors:
- From Monitors section, click Add button.
- Frequency: Frequency to execute the template.
- Monitor Definition: Monitor type.
- When to Alert: Select Breach of a Threshold.
- Select Availability and Alert checkbox to initiate monitoring.
- From Monitors section, click Add button.
Click Save.
Assign template
You need to create credentials to assign a template to a resource.
Create credentials for the template
Select a client from the All Clients list.
Go to Infrastructure > Resources, select a device.
Navigates to the device information page.From the center pane, click Credentials > +Add.
From Create New Credentials, enter:
- Name
- Description of the new credentials.
- From the Type drop-down list, select Windows.
- Username
- Password
- Confirm Password
- Connection Time-out (ms)
Click Save.
Assign templates
- From the left pane, click Infrastructure. The Infrastructure screen of the selected client is displayed.
- From Resources tab, select a required resource from the list of resources. Or, use the search option to find the resource.
- Click the resource name to view details.
- From the left pane, click Monitors. Templates tab is displayed.
- From Templates tab, click +Assign Templates.
- From Apply Templates, select the templates. The selected Templates section displays the chosen templates.
- Click Assign. The template gets assigned to the selected device.
After assigning the template to a resource for monitoring, click Get Latest Metric Values to view the latest metric information.
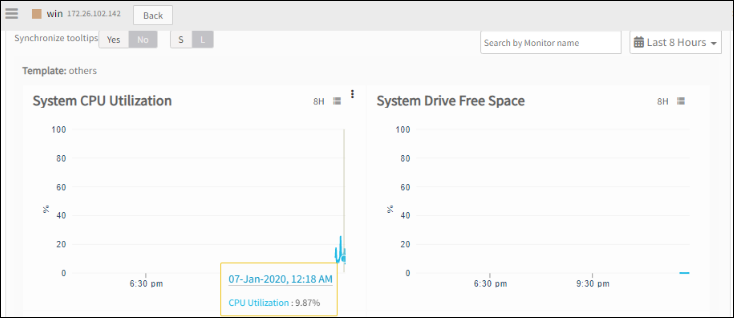
View graphs
The gateway monitors the remote system using the assigned templates and displays the results in a graphical format.
- From the left pane, click Infrastructure. The Infrastructure screen of the selected client is displayed.
- From Resources tab, select a required resource from the list of resources. Or, use the search option to find the resource.
- Click the resource name to view details.
- From the left pane, click Metrics. The Metrics page displays graphs generated by all monitoring templates assigned to a device.
- Search with the template name to filter the graphs.
Example: PowerShell script
$Disk = Get-WMIObject Win32_Logicaldisk -filter "deviceid='C:'"
$DiskUtil = ((($Disk.Freespace /1Gb -as [float]) / ($Disk.Size / 1Gb -as [float]))*100) -as [int]
$TotalSpaceUtilized = 100 - $DiskUtil
write-host @" { "datapoints": { "DiskC": $TotalSpaceUtilized }}"@
PowerShell single instance
In this example, JSON output is provided for a single instance.
{
"datapoints" : {
    "DiskC" : 50,
    "DiskD" : 81
    }
}
PowerShell multiple instances
In this example, JSON output is provided for multiple instances.
{
  "datapoints" : {
    "DiskC" : 50,
    "DiskD" : 81
    }
  "alerttokens": {
    "disk_utilization.total" : "DiskC : 40 GB, DiskD : 100 GB",
    "disk_utilization.used" : "DiskC : 20 GB, DiskD : 50 GB"
    }
}