Introduction
In the context of monitoring systems, thresholds can be used to trigger alerts when certain conditions are met. Thresholds can be customized to meet specific requirements or goals.
The process for customizing thresholds can vary between synthetic and non-synthetic resources. Synthetic monitoring involves simulating user behavior or application transactions to test the performance of an application or system. Non-Synthetic monitoring involves monitoring real user behavior or system performance in a production environment. Thresholds are typically set based on historical data and observed patterns.
Synthetic monitoring requires more customization of thresholds than non-synthetic monitoring due to simulating user behavior and transactions. You can define thresholds in templates based on the component type.
You can customize the threshold in four ways:
- Default Threshold: The values for the threshold are already predefined and this cannot be modified.
- Template Level Component Threshold: Users can change the default values and use it accordingly, by creating a copy of the template and changing the default values that suits their business values.
- Resource Threshold: The resource can have different components, you can customize these thresholds which are specific to a resource being monitored.
- Component Threshold: Components of the said resource. For example, Monitor “D Driver of the Laptop”.
Pre-requisite
- Agent: 7.0.0 and above.
- Gateway: 7.0.7 and above.
Types of threshold customization
There are two types of threshold customization:
Synthetic Monitoring
Note: To know more about how to create and monitor a synthetic resource, refer to Synthetic Monitoring.Non-synthetic Monitoring
Note: As a user, you may Create a Template or Copy a Template to configure in a scope level.
Non-synthetic monitoring resources
Assign Templates with Threshold
- From All Clients, select a client.
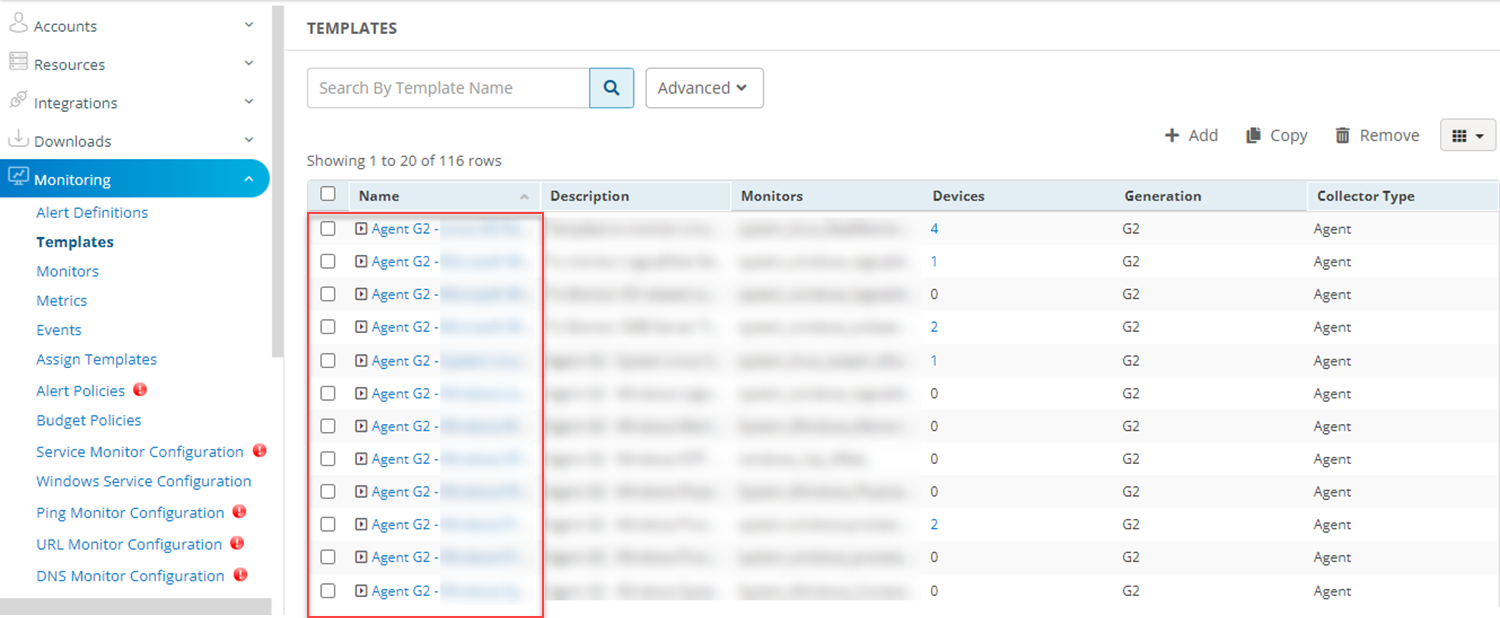
- Go to Setup > Monitoring > Template.
- From the TEMPLATES screen, select the template name.
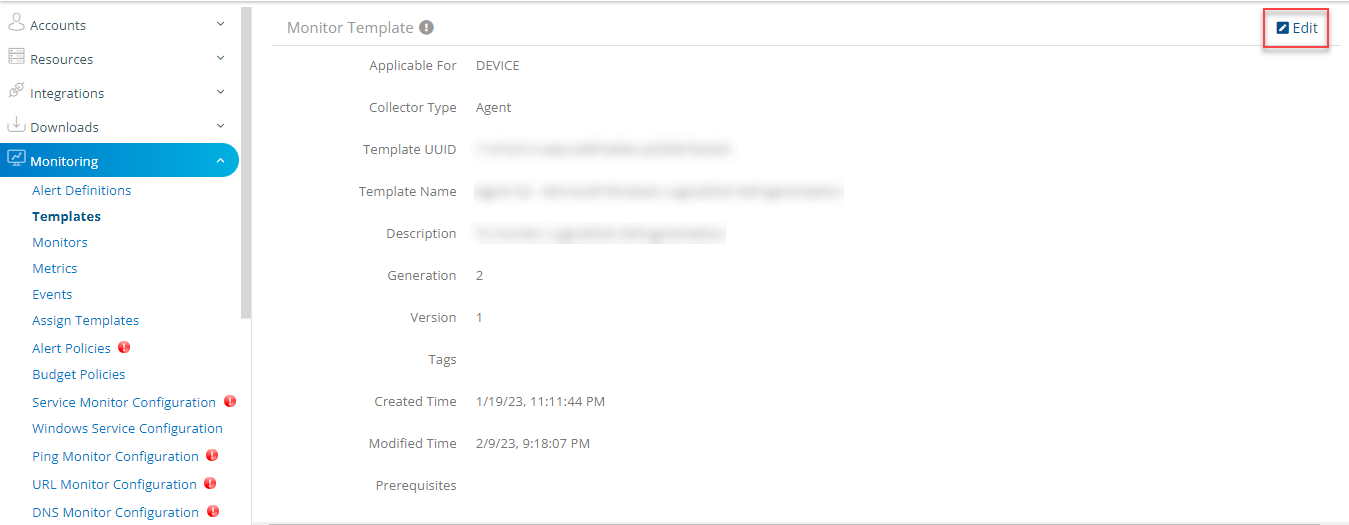
- The Monitor Template screen appears. Click Edit > Next.
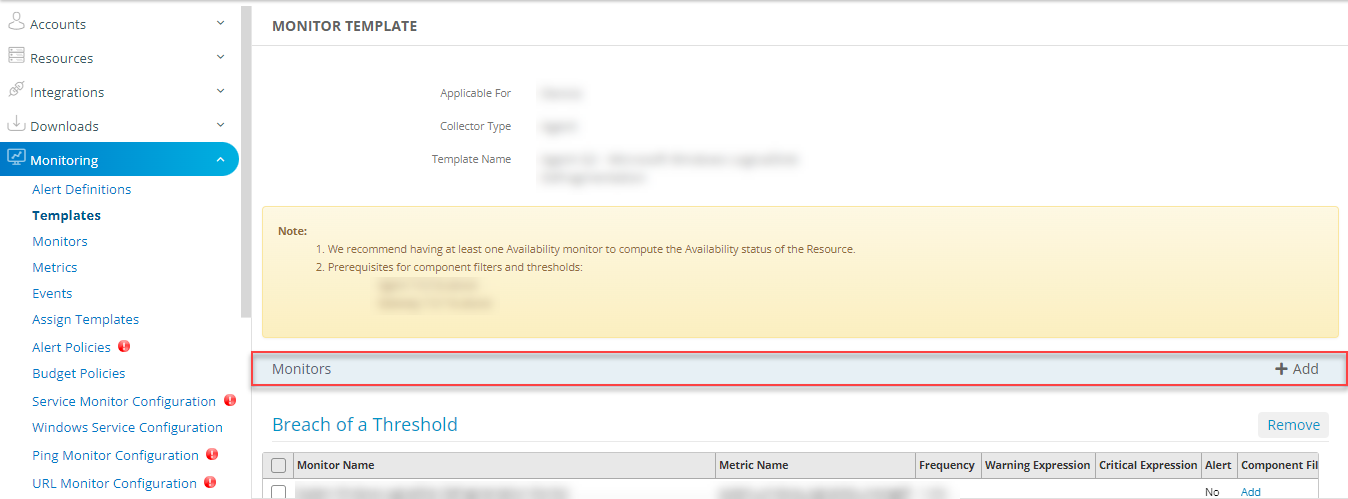
- The MONITOR TEMPLATE page appears, in the Monitor section, click + Add.
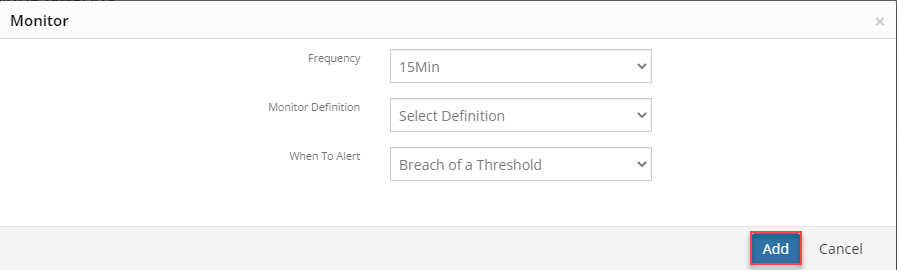
- The Monitor page appears, select the following:
| Functionality | Description |
|---|---|
| Frequency | Select the frequency ranging from 1 Min to 1440 Min. |
| Monitor Definition | Select the definition from the drop-down list box. |
| When To Alert | Select the alert from the drop-down list box. You may select:
|
- Click Add.
- Go to Monitors > Breach of a Threshold.
- Now, select following details as required:
- Monitor Name: Name of the monitor is displayed.
- Metric Name: Name of the metric is displayed.
- Frequency: The number of occurrences of a repeating event within a certain period of time is displayed.
- Waring Expression: A warning notification is displayed.
- Critical Expression: A critical warning notification is displayed.
- Alert: Alert information is displayed to the user.
- Component Filters: Configure metric filter for components of a specific resource.
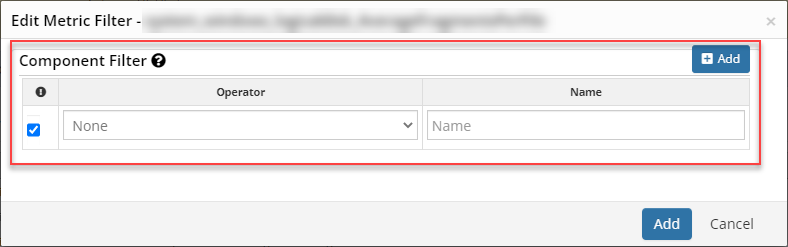
- From the Component Filter column, click Add.
- From Edit Metric Threshold, click + Add.
- Enter details for the following parameters:
- Operator: List of available operators you can use to compare the component name.
- Name: Enter the name for the parameter.
- (Optional), Click + Add to add multiple parameters.
- Click Add.
- Component Threshold: Configure metric threshold for components of a specific resource.
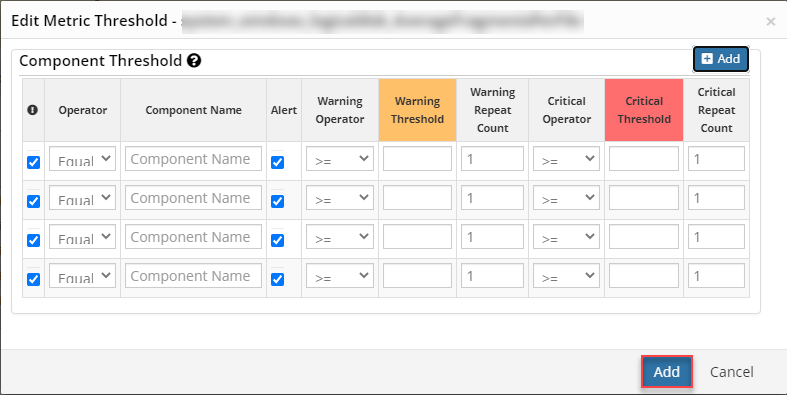
- From the Component Threshold column, click Add.
- From Component Threshold, click + Add.
- Enter details for the following parameters:
- Operator: List of available operators you can use to compare the component name.
- Component Name: Enter the name of the component.
- Alert: Select the checkbox to send alerts to the alert browser.
- Warning Operator: Operator to compare the warning threshold value.
- Warning Threshold: Threshold value to get warning alerts.
- Warning Repeat Count: Number of times the alert threshold condition breaches before generating an alert.
- Critical Operator: Operator to compare the critical threshold value.
- Critical Threshold: Threshold value to get critical alerts.
- Critical Repeat Count: Number of times the alert threshold condition breaches before generating an alert.
- Click Add.
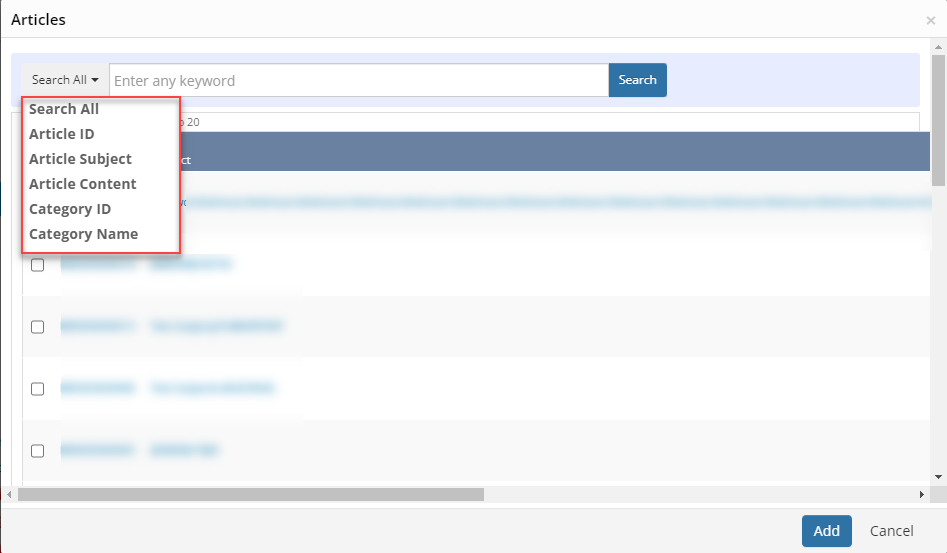
- Knowledge Articles:
- You can search the required article, by selecting:
- Search All: Enter any keyword in the search bar, that would display all the articles.
- Article ID: Enter the article id for the article in the search bar.
- Article Subject: Enter the article subject name.
- Article Content: Enter the article content information.
- Category ID: Enter the category ID name.
- Category Name: Enter the category name.
Note: You may select a single or multiple article by clicking the check box next to the article.
- Click Add.
- You can search the required article, by selecting:
Click Save.
Notes:
- Select a single or multiple monitors and click Remove to remove the monitor.
- When a user sets the Critical Value of CPU to 80 KB. and if the CPU value is greater than 80KB, the user would be notified with the Critical alert.
Customize Thresholds
To customize a threshold navigate to Infrastructure > Resources > Server.
- Select the resource and click Monitors > Monitors.
- Click the edit icon beside the threshold name.
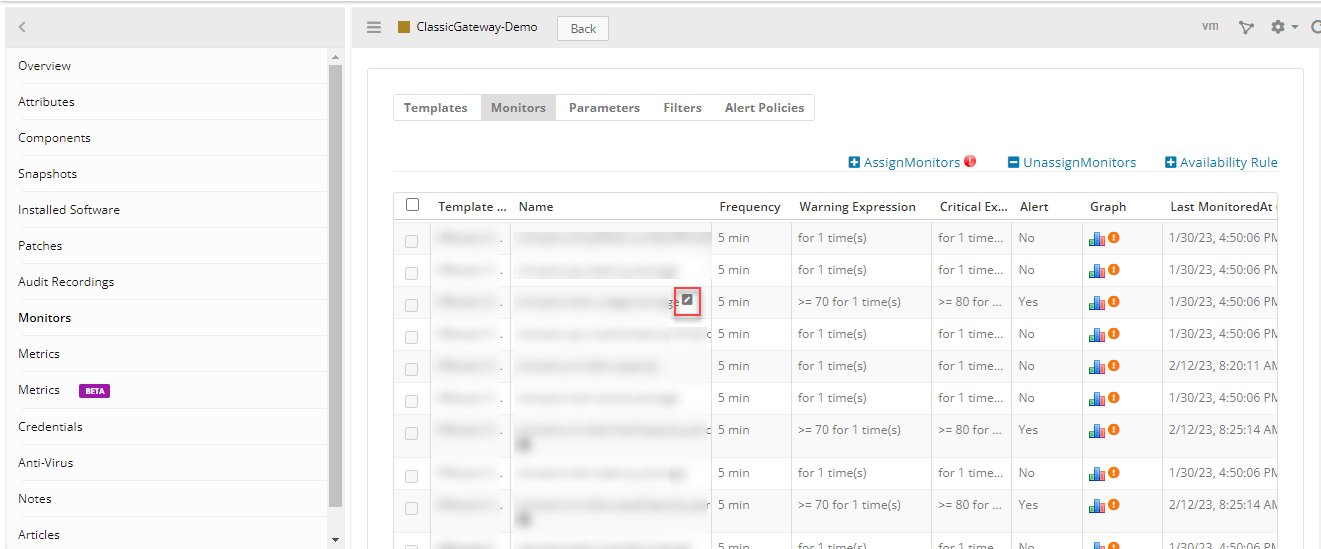
- The Edit Metric Threshold page appears.
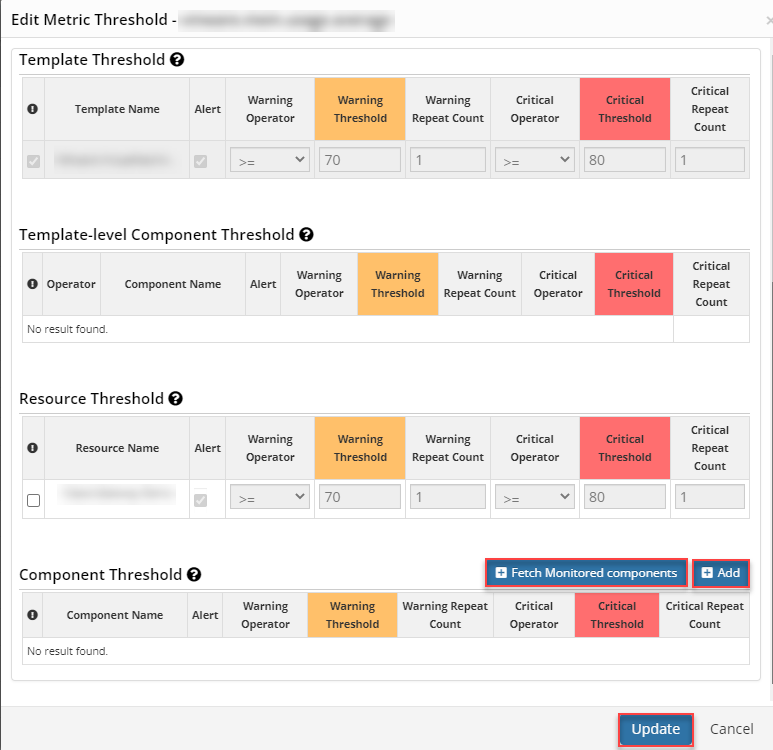
- You will be able to view and edit the below threshold information:
- Template Threshold
- Template-level Component Threshold
- Resource Threshold
- Component Threshold
Note: You may click + Fetch Monitored components to update the details or click + Add to add additional component threshold details.
- Click Update.
Restore resource metric thresholds
The Restore resource metric thresholds functionality lets you restore the Resource level metric threshold and the Component level metric threshold, with the template level thresholds.
Note: This is applicable for G2 based templates.
Non-synthetic monitoring resources
To restore the resource metric and component metric thresholds for non-synthetic monitoring resources:
Go to Infrastructure > Resources > Server.
Search for the server and then click the resource name.
Click Monitors > Monitors tab.
Click the edit icon next to the metric name.
From the Edit Metric Threshold window, select the resource threshold check box to enable it.
Edit the information and click Update to update the values.
Click the edit icon again, next to the metric name.
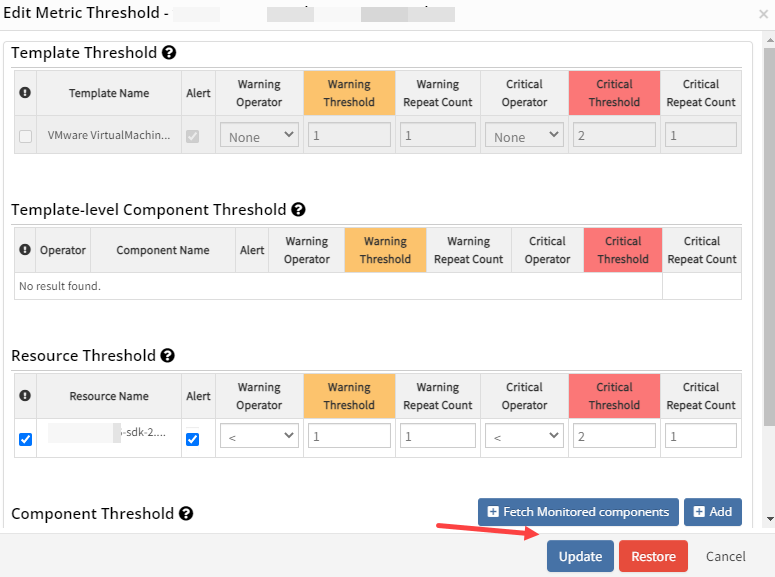
From the Edit Metric Threshold window, click Restore.
A message appears, “All Resource and Component level threshold changes on this metric will be restored with template level thresholds. Do you want to continue? "Click Yes to restore.
- The resource level thresholds will be restored with template level metric thresholds.
- The resource component level thresholds will be restored with template level component thresholds. If the template level component thresholds are not configured within the metric, then the resource component level thresholds will be restored with the template level metric thresholds.
Click Update to retain the restored values.
Synthetic monitoring resources
To restore the component metric thresholds for synthetic monitoring resources:
Go to Infrastructure > Resources > Synthetics.
Search for the synthetic and then click the synthetic name.
Click Monitors > Monitors tab.
Click the edit icon next to the metric name.
From the Edit Metric Threshold window, select the component threshold check box to enable it.
Edit the information and click Update.
Click the edit icon again, next to the metric name.
From the Edit Metric Threshold window, click Restore.
A message appears, “All Component level threshold changes on this metric will be restored with template level thresholds. Do you want to continue? "Click Yes to restore.
- The resource component level thresholds will be restored with template level component thresholds.
- The resource component level thresholds will be restored with template level component thresholds.
Click Update to retain the restored values.
Repetitive alert
This functionality is part of the agent and gateway where a Critical/Warning alert will be repeatedly sent every 6 hours if the alert state remains the same.
Starting with Agent version v12.0.0 this option is available.
Example: A Critical alert is generated on a resource once it reaches 90% CPU usage and if the CPU usage remains the same for the next 6 hours then another Critical alert will be appended to the previously generated Critical alert. The same applies to the Warning alert.
Instead of sending a Critical alert for every monitoring poll and flooding with the same alert, the agent and gateway send a repeated alert every 6 hours to reduce the alert noise. If the alert level changes from Critical to Warning or vice versa within 6 hours, the time calculation will be reset and the process will begin again.
This only works for state change alerts in which the alert state changes from Critical to Warning.