Important Note
The old UI and its associated documentation are valid until the 2024.08.U1 release. The new UI and its related documentation will apply starting from the 2024.09.U1 release, see (New UI Document).The Synthetics section displays the configured synthetic monitors. After creating a synthetic monitor, click the monitor to view details such as Overview, Metrics, and Monitors.
Dashboard
The dashboard displays the total number of configured synthetics, the status of each synthetic configured on the Infrastructure page, Add, Delete button, and a Refresh button.
Status of synthetics
| Field | Description |
|---|---|
 | Indicates the total number of created synthetic monitors. |
 | Indicates the number of synthetic monitors that are up and running. |
 | Indicates the number of monitors that have Open, Warning or Critical alerts. |
 | Indicates the number of monitors for which the template thresholds are not configured and are facing issues. |
 | To add synthetic monitors. |
 | To delete synthetic monitor. |
 | To refresh the Synthetic items. |
 | To search for any Synthetic monitor. |
Availability is calculated based on the configured Component Thresholds of monitors in templates for every synthetic. When you do not configure component thresholds for availability or response time, the availability is displayed as Unknown (Gray color) even when the website is down.
Overview
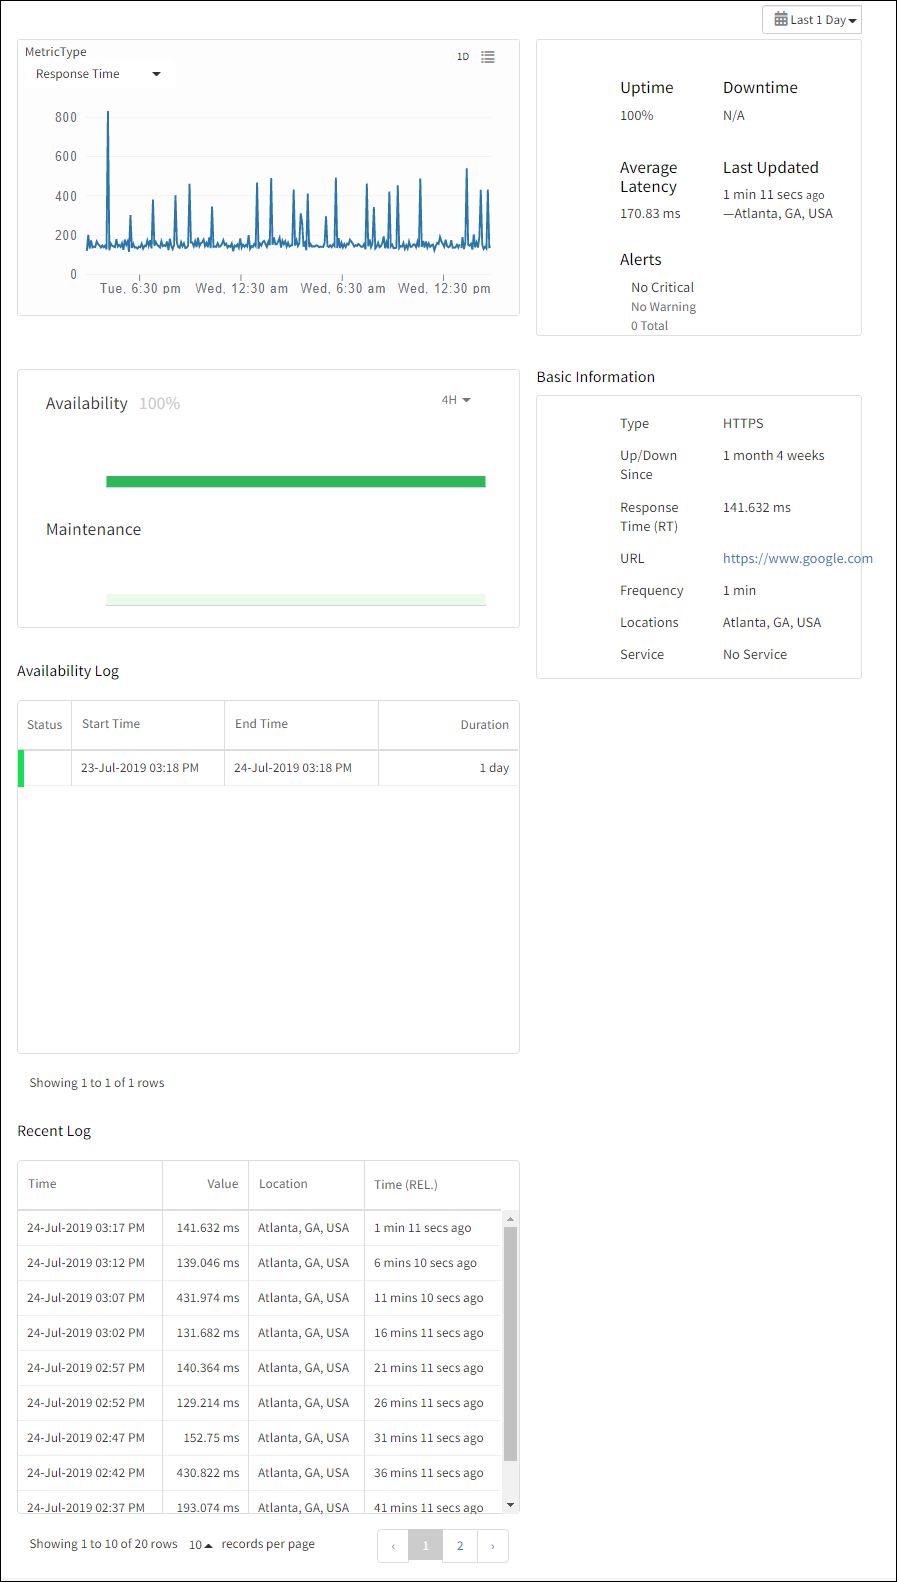
Overview displays various details like basic information, metric type, availability log, and recent log.
Metric type
Metric type displays a graphical representation of each metric for a selected synthetic monitor.
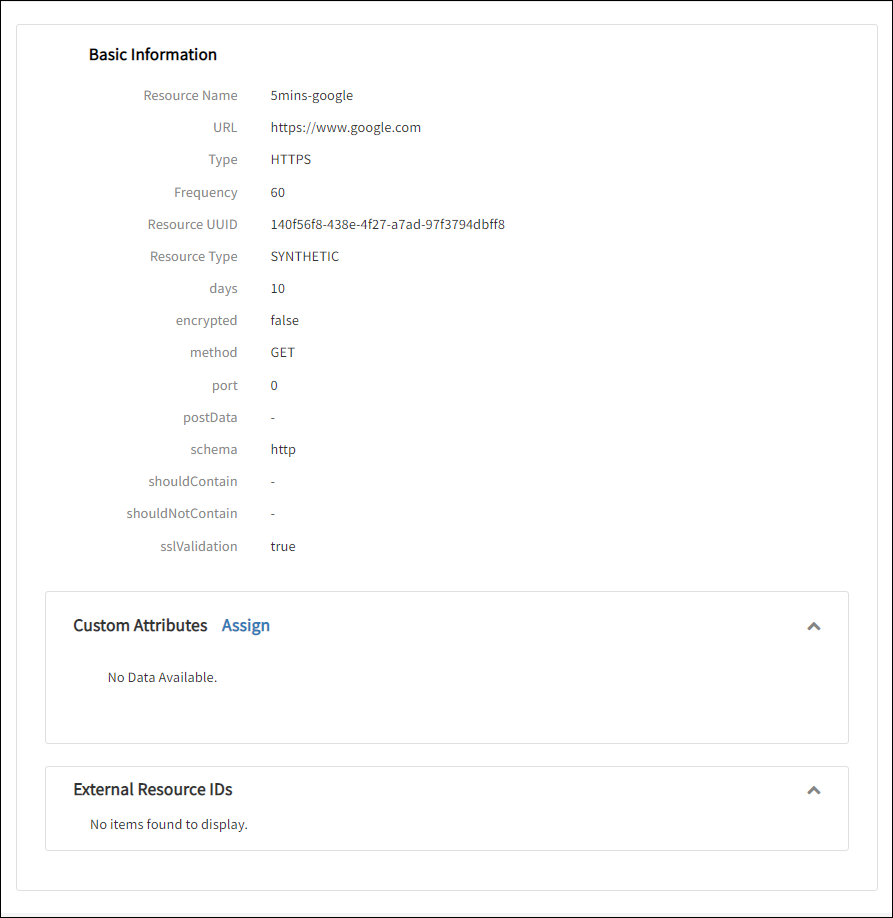
Basic information
Basic Information section displays the fundamental information about the selected synthetic monitor. For example, the type of synthetic monitor, the time period since the synthetic monitor is UP/DOWN, Response Time (if any), configured URL, Frequency, Locations, and Service.
Availability log
Availability Log section displays the log details of the availability status (Up or Down) for the selected synthetic monitor. The Availability Log section displays a view Root Cause icon when the availability status of the synthetic monitor is Down. The view Root Cause displays the root cause for the unavailability of the synthetic monitor.
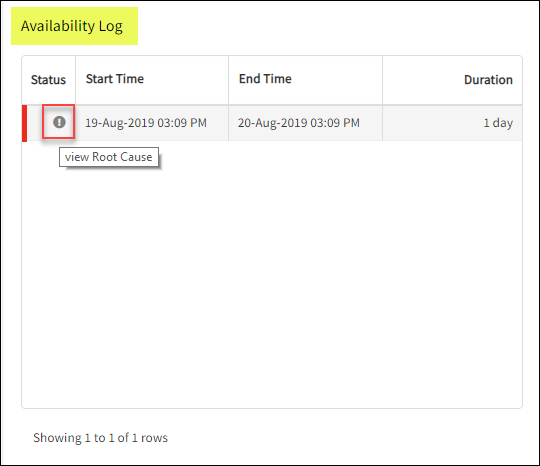
View root cause in availability log
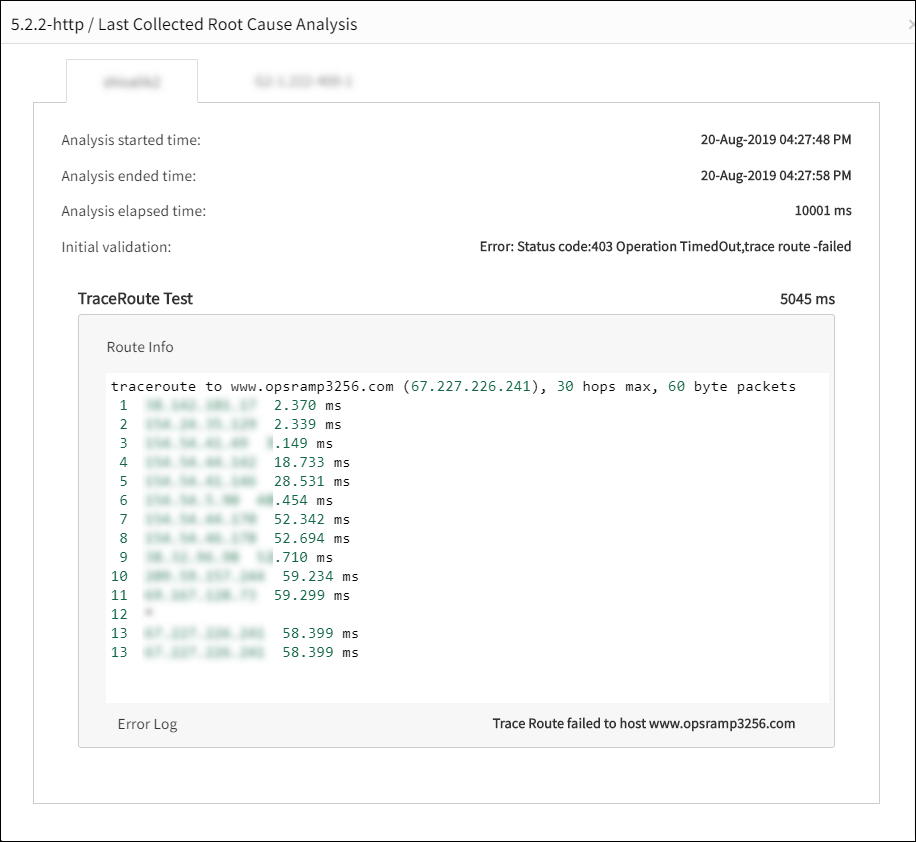
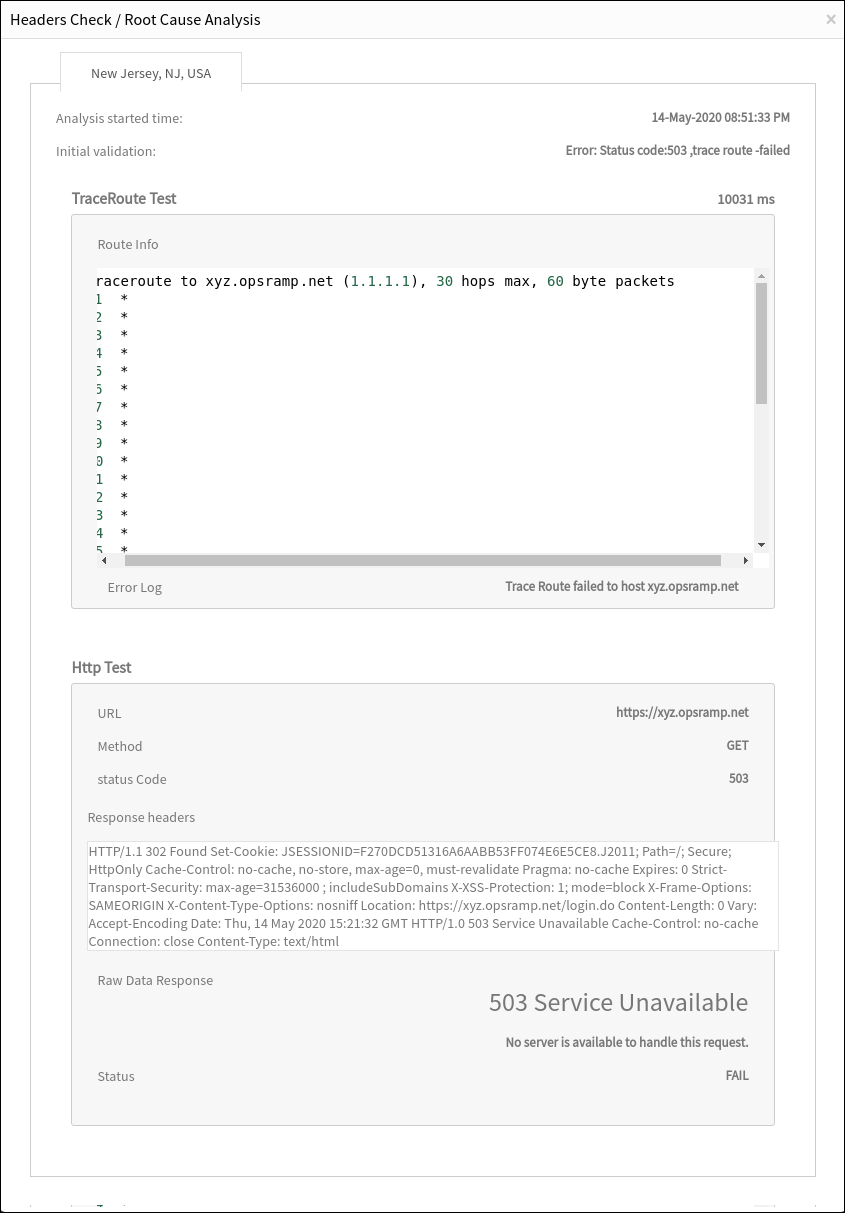
From the Availability Log section, click view Root Cause. The Last Collected Root Cause Analysis window is displayed.
From the Last Collected Root Cause Analysis window, analyze the below details from the configured location.
- Analysis started time – The Root Cause Analysis (RCA) collection start time.
- Analysis ended time – The RCA collection end time.
- Analysis elapsed time – The time taken to do the RCA.
- Initial Validation – Displays the reason for the Down availability status for the selected synthetic monitor.
- TraceRoute Test – Displays details that allow you to debug the issue.
TraceRoute test
The TraceRoute Test section focuses on the reachability of the host from a configured location. The status of the synthetic monitor displays Down (red color) when the configured host is inaccessible from the configured location in the console. The TraceRoute Test information helps you to analyze and track the exact point of failure.
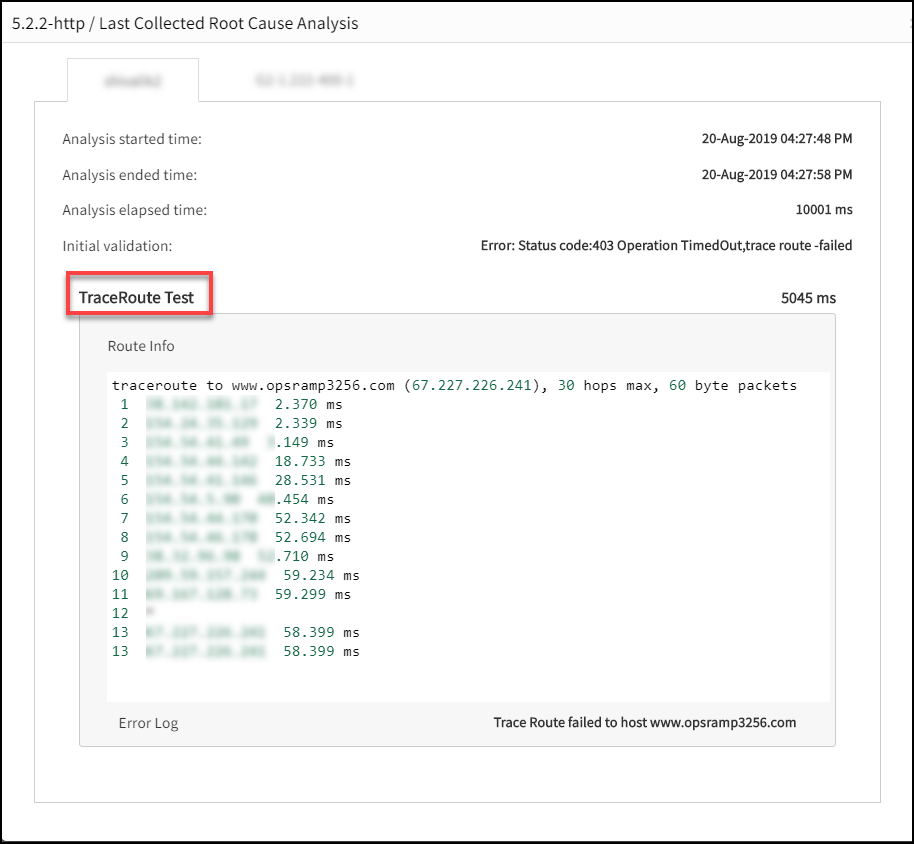
The TraceRoute Test section displays the following details:
- Route Info – The path taken by packets from the configured location to the host.
- Error Log – Displays that Traceroute is a failure.
TraceRoute Test supports only 30 hops maximum and 60-byte packets.
Recent log
Recent Log displays information about the recently collected metrics.
Attributes
Attributes display all basic information on the configured synthetic monitor.
Location availability
Location availability highlights the uptime or downtime of a synthetic monitor from each location.
HTTP test
For HTTP/HTTPS monitors, HTTP Response Headers and HTTP Raw Response Time are provided to identify the issue that makes your website unavailable at a location. The HTTP Test section displays the following:
- URL: URL of the website.
- Method: REST method of the connected website.
- Status Code: HTTP response code or Libcurl error code of the Website.
- Response Headers: HTTP response headers of the website.
- Raw Data Response: HTTP response provided by the website.
- Status: Success or failure of the test.
HTTP-SCRIPT transaction monitor screenshot
The view Root Cause section in Location Availability displays success and error screenshots when an error occurs.
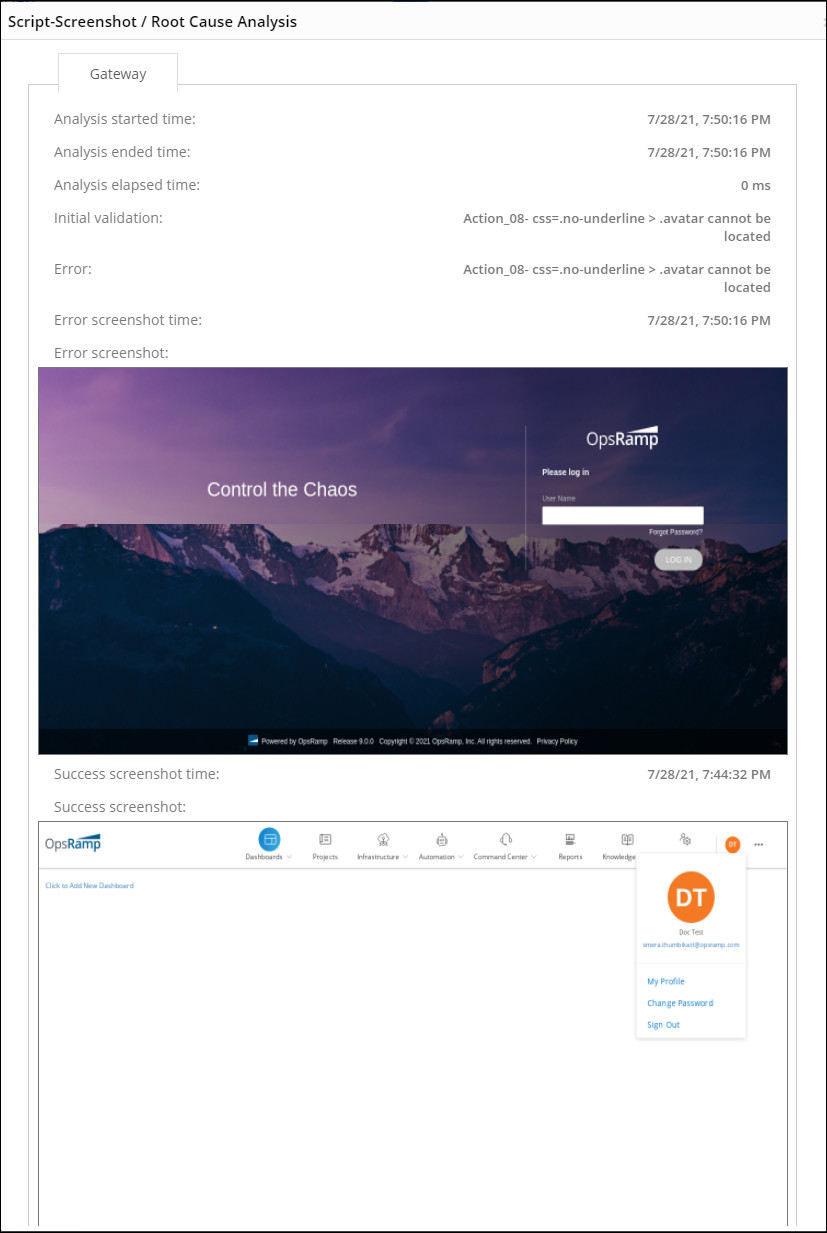
The success screenshot is taken when the monitor is created or updated.
Monitors
Displays templates and monitors assigned to the configured synthetic monitor.
Templates
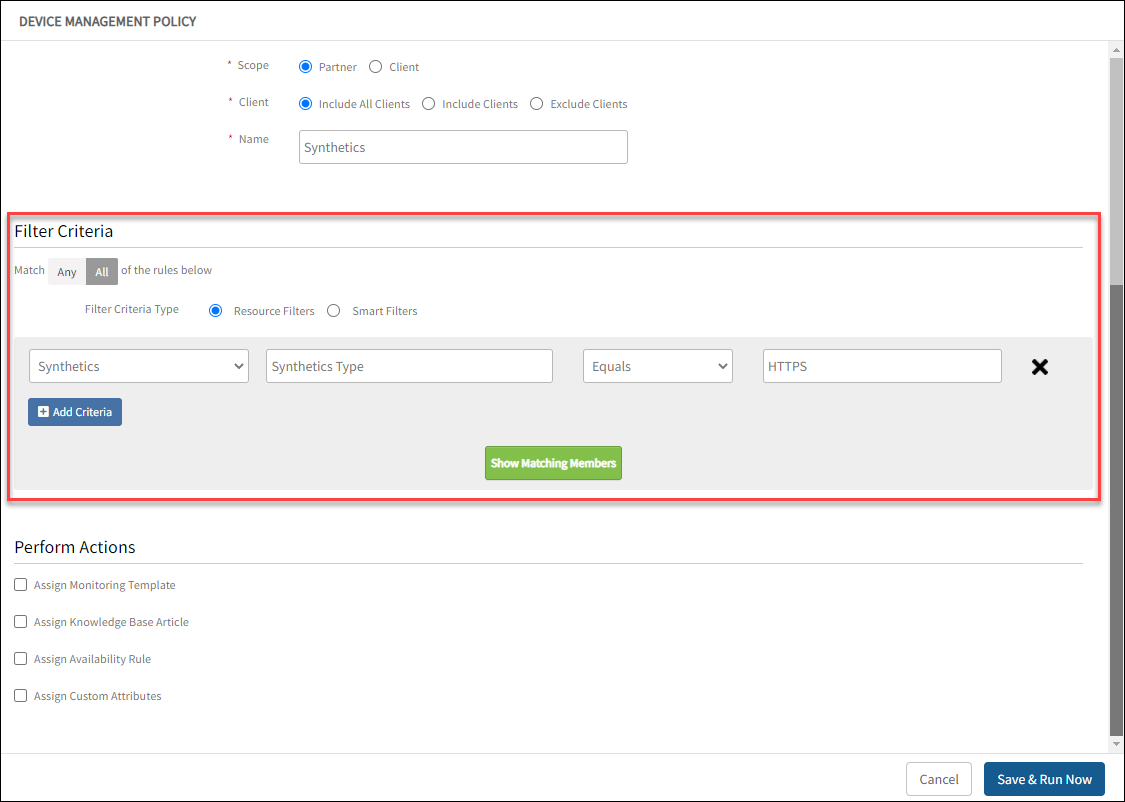
Displays the templates available for the selected synthetic monitor. You can assign templates to enable the monitoring of your synthetic using the Assign Templates option. You can also implement a device management policy on specific synthetic resources.
To create a device management policy, you can filter synthetic using synthetic Name or Type when applying Resource filters as Filter Criteria. For example, to apply HTTPS templates, select HTTPS as Synthetic Type for the resource type Synthetics.
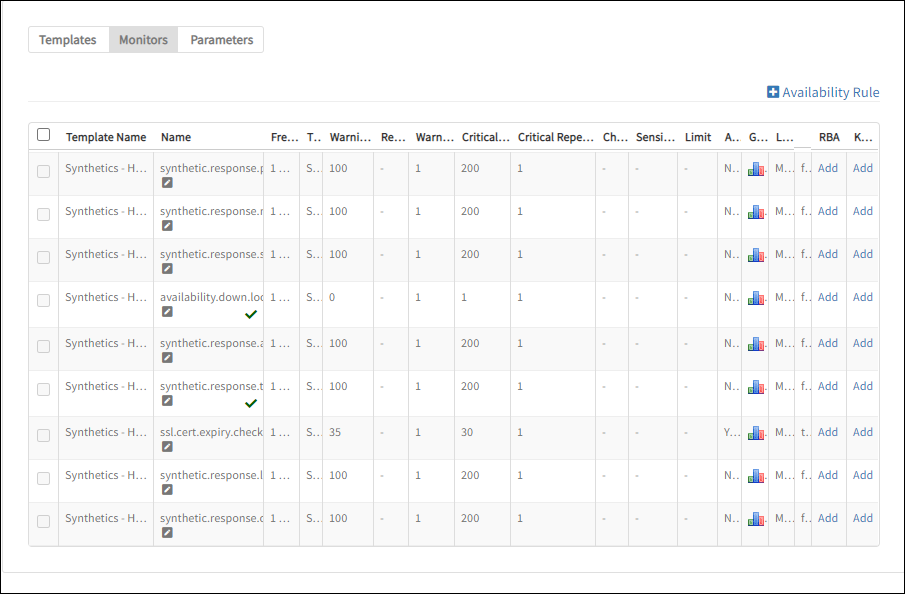
Monitors
Monitors allow you to configure alerts and edit threshold values assigned to any metric in the selected synthetic monitor.
Availability rule
Use availability to configure rules to confirm the status of the resources with the availability check depending on the critical alerts received for the metrics.
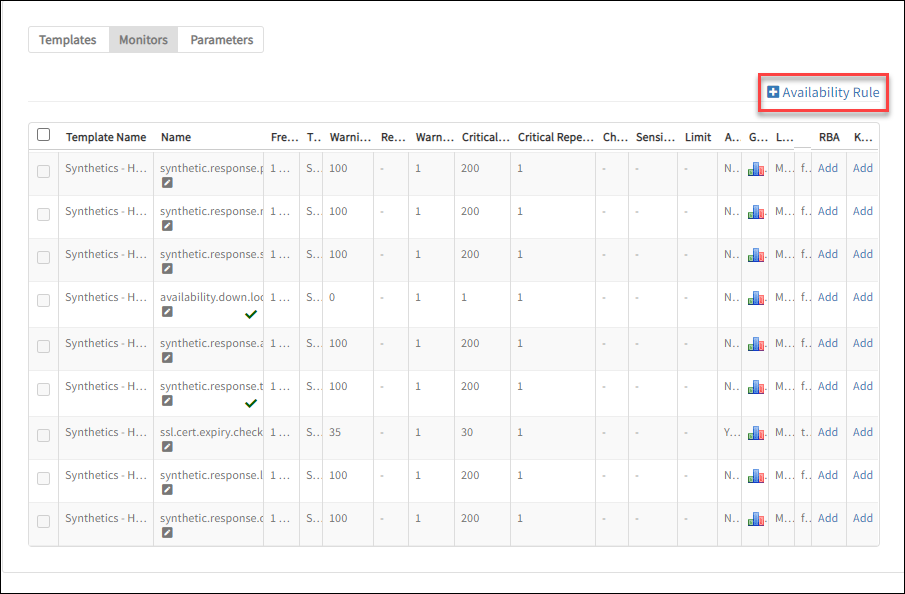
After clicking Availability Rule, select one of the following options to determine the status of the resource:
- Resource is Up if ALL availability monitors are OK, Resource is Down otherwise
- Resource is Up if ANY availability monitor is OK, Resource is Down otherwise
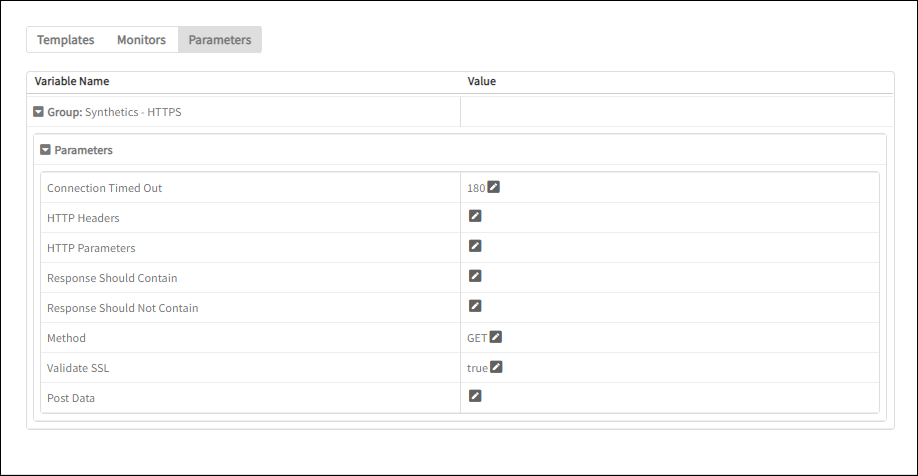
Parameters
Parameters display the parameters migrated from synthetics to the monitoring templates section. You can change the values for the migrated parameters of the selected synthetic monitor.
Metrics
Metrics displays a pictorial representation of all metrics configured in the assigned templates.
Synchronize tooltips
| Tooltip | Description | ||
|---|---|---|---|
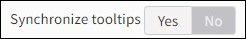 | Enable or disable tooltips. | ||
 | Decrease (S) or Increase (L) the size of the graphical representations for each metric. |
Credentials
Credential Set enables you to create or assign credentials to your synthetic monitors. You can use these credentials to mask plain text usernames and passwords in the synthetic script.
Notes
Notes enable you to record special instructions for any synthetic monitor under consideration.
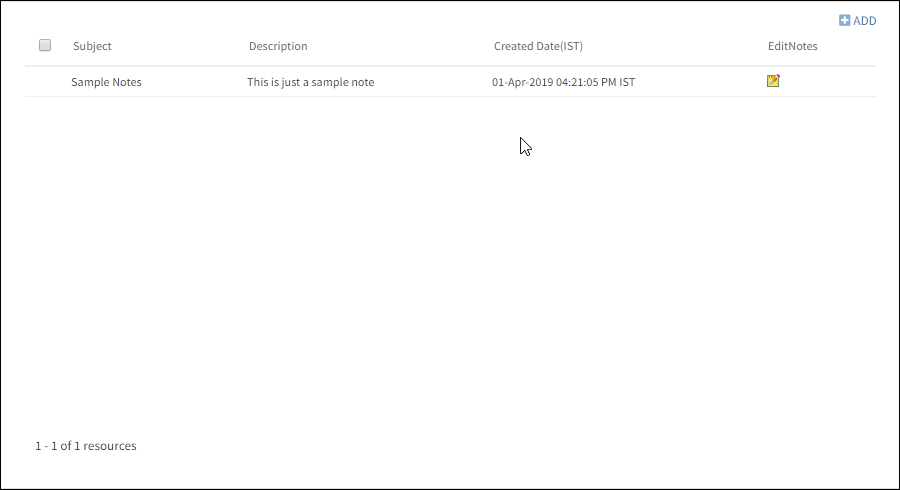
To add Notes:
- Click Add displayed on the Notes window.
- On the Notes window, enter the required details.
- Click Save.
You can change existing notes from the Notes window using Edit Notes.
Articles
Articles display notes tagged to the configured synthetic monitor.
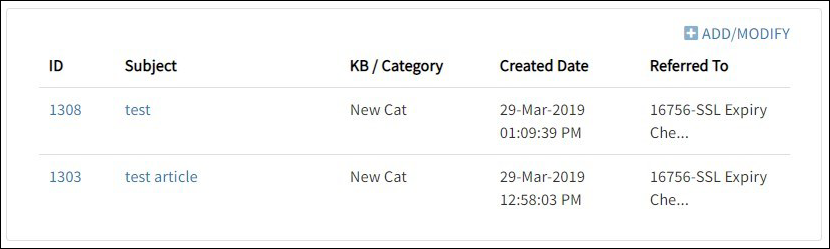
Add/modify option
The ADD/MODIFY option allows you to add or remove articles for the selected synthetic monitor.
- Click ADD/MODIFY.
The Articles window is displayed. - Select the checkbox of articles from the Articles window.
- Click Add.
The Articles section displays the selected articles.
Next steps
See Modify Metric Custom Notifications and Thresholds for information on customizing threshold values.
See Create Templates.
See Credential Set in SCRIPT – HTTP Synthetic Transaction Synthetic Monitor.