Important Note
The old UI and its associated documentation are valid until the 2024.08.U1 release. The new UI and its related documentation will apply starting from the 2024.09.U1 release, see (New UI Document).Once the templates are created, the administrators can customize the existing component threshold values assigned to a metric in the synthetic monitor to receive the alert.
Follow the steps below to configure the component level threshold for metrics:
- Select a client from the All Clients list.
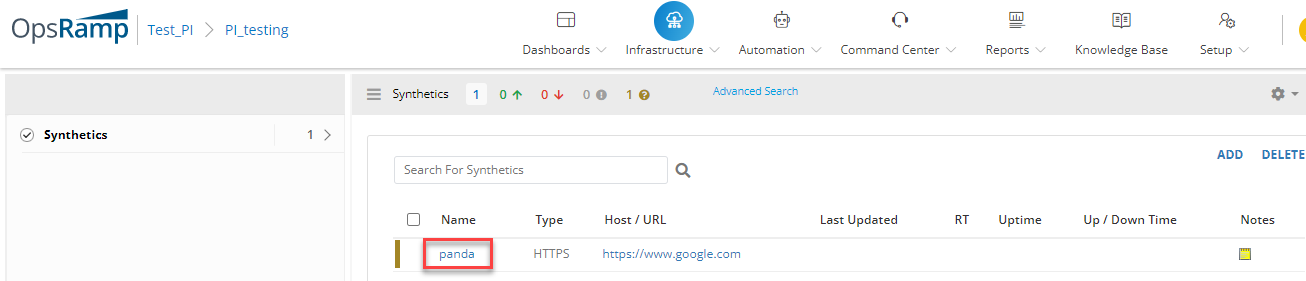
- Navigate to Infrastructure > Resources > Synthetics.
- Select the synthetic resource from list to configure.
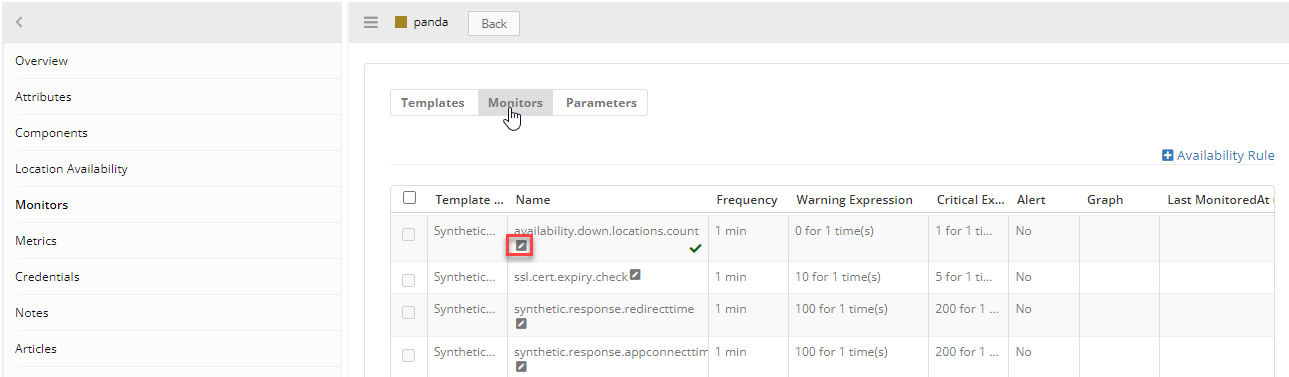
- Go to Monitor > Monitor.
- You should now see the list of Synthetics Templates Metrics. Click the Edit Symbol of a metric to update the component threshold.
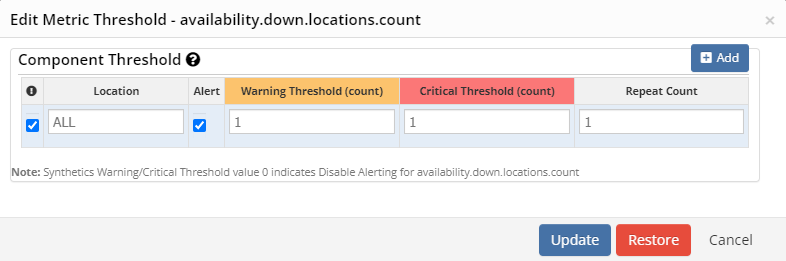
- The page Edit Metric Threshold will now appear. Click + Add button.
- Enter the following parameters. Click Update button.
| Component Threshold Parameter | Description | Example |
|---|---|---|
| Location | Public and private locations present in the client to enable monitoring. | ALL |
| Alert | To get alerts for configured metrics, enable the Alert option | - |
| Warning Threshold | A warning alert is sent when the metric reaches the Warning Threshold. | 5 |
| Critical Threshold | A critical alert is sent when the metric reaches the Critical Threshold. | 10 |
| Repeat Count | Number of times (iteration) the Warning and Critical threshold values are verified before an alert is sent. | 1 |
- Once the component threshold has been successfully updated, you will receive a confirmation page.