Automonitoring enables quick onboarding for multiple cloud, cloud native, and other resources. By providing environment-specific configuration parameters (such as the port and hostname) you can discover and monitor resources in real-time. Pre-configured dashboards provide out-of-the-box visualizations, which can be customized to your requirements.
Discovered resources alert definitions are configurable. Alert definitions are filters that are based on tags and alert thresholds.
Constraints
- Automonitoring and template-based models are incompatible and can not be used together on the same client.
- Custom monitor development is not supported.
- Resources do not have a default availability metric assigned. This model does not support an availability metric.
- Metric configuration is limited to resources being monitored by the agent:
- Adjusting polling frequency. Controlled by the agent configuration .yaml files.
- Disabling and enabling metrics. Controlled by the agent configuration .yaml files.
- Gateway or gateway-based proxy monitoring resources are not compatible with the automonitoring model.
Resources
| Resource Type | Resource |
|---|---|
| Cloud |
|
| Cloud Native |
|
| Cloud Native Services | Over 50 cloud native applications that operate in a cloud environment. |
| Agent | Linux and Windows agents running in both the cloud and on-premise. |
Usage
The automonitoring model onboards, monitors, and sets alerts for the metrics independent of the template-based model.
In addition, a single client can implement both automonitoring-based and template-based monitoring on two separate clients. The following diagram shows how both monitoring methods can be used:
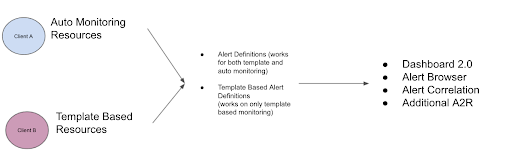
These models work in parallel and converge on central platform areas, making the alerting experience is the same across automonitoring and template-based clients.
Alerts
Alert thresholds are configured with alert definitions which you can use to define alerting thresholds on automonitored resources. Alert definitions allow you to take a metric, filter by tags, and set thresholds with a repeat count.
See Automonitoring Alert Definition for more information.
FAQs
Availability
How does availability work?
Availability is a function of the alert definitions model. Alerts are set by the metrics.
Co-existing with the template-based model
Will the new automonitoring model and template model exist together, if so, how long?
Automonitoring and template-based models exist together. However, each model requires different clients with different metric data and alert settings. Alert Definitions can be used to augment template based monitoring and provide enhanced granularity and flexibility for defining alert definitions for existing clients.
New clients
Does the new automonitoring model require a new client for onboarding, if so, how will this impact my existing monitoring?
New clients are required to ensure that existing users are not disrupted by the new automonitoring model changes. Existing clients cannot enable the automonitoring option.
New client dependency
Are there any other DnM features that are dependent on a new client to be set up?
The following list is dependent on a new client setup with the automonitoring model enabled:
- Automonitoring
- Alert Definitions model
The new dashboard initiative is not dependent on a newly created client.
Custom monitors or metrics
Will custom monitors or metrics be allowed to be added as additional metrics if they are not automonitored?
Because automonitoring is focused on cloud and cloud native workloads, custom monitor extensibility is not available.
Cost of cloud API
Because you can not adjust the metric pulling frequency, how will this increase the cost of cloud API monitoring spend (AWS Cloudwatch, Azure Monitor, GCP Stackdriver)?
With the automonitoring model, there are two (2) API requests made every minute per cloud integration (AWS, Azure, and GCP) .
There are API requests to:
- GET available metrics collection
- GET metric data samples for all metrics
The cost delta between the current model and automonitoring model (assuming one minute rate frequency) is minimal. Both models have roughly the same cost of operating. Teams that want to reduce cost can only onboard their critical resource and increase resource filter flexibility by using the Filter by Tag option in the Onboarding Wizard.