Monitor-generated events indicate the presence of device or resource anomalies. Alerting helps you interpret and act on events by providing a single aggregation and response system for all events. Events can also be produced by diagnostic and third-party tools.
Much of the work of interpreting and responding to an alert is automated. Alerting correlates related-cause alerts, automatically suppresses redundant alerts, notifies operators, and creates incident tickets for alerts that need attention.
The following figure shows the alert handling workflow:
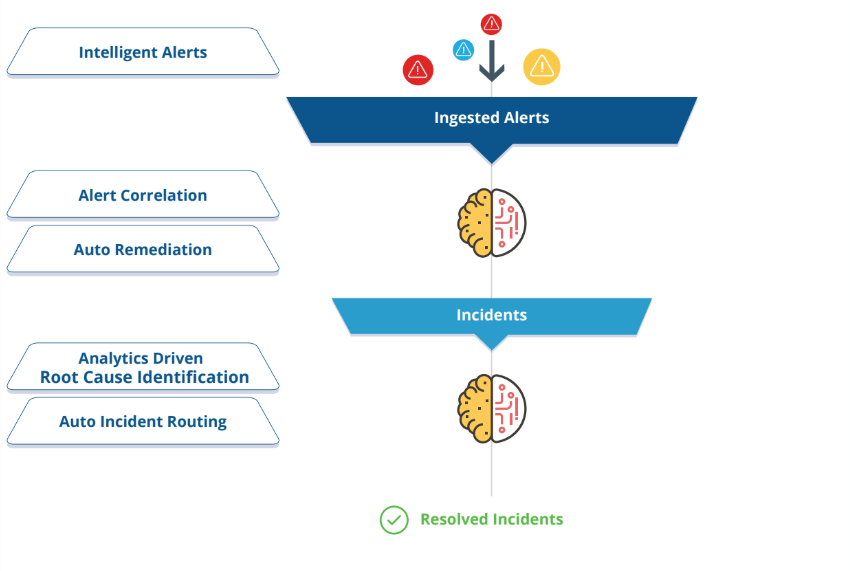
Note: The information alerts do not activate actions within our alert policies. The information alerts are considered to provide information and are distinct from regular alerts.
Alert terminology
The following terms are used in alert management:
| Term | Description |
|---|---|
| ID | Sequential number that uniquely identifies an alert or inference. In the alert list, the ID field also indicates the alert state using color-coding. |
| Subject | Alert description summary, which includes metrics associated with the alert. |
| Description | Brief description of the alert source and cause. This might include metrics with threshold crossings, monitor description, device type, template name, group, site, service Level, and component. |
| Source | Platform or monitoring tool that generated the alert. |
| Metric | Service name of a threshold-crossing alert. |
| First Alert Time | Time when monitoring started for a resource. An alert is generated to provide notification that monitoring started for the resource. |
| Alert Updated Time | Most recent alert time. Updated when an alert is unsuppressed manually or with the alert First Response policy. |
| Elapsed Time | Elapsed time since the first alert was generated. |
| Action/Status | Current alert status and most recent alert action. |
| Last Updated Time | Time when alert status was last updated. |
| Device Type | Device type associated with an alert. |
| Resource | Resource name associated with the alert. |
| Repeated Alerts | Count of the number of duplicate alerts generated by the resource. |
| Partner | Name of the partner owning the resource. |
| Incident ID | Unique incident ID associated with the alert. Alerts are associated with incidents by:
|
| Entity Type | Category of the source that generated the alert:
|
Alert Throttling Limit
The OpsRamp Gateway enforces a throttling limit of 1,000 alerts. If the number of incoming alerts exceeds this limit, additional alerts may be dropped. For more information on API throttling limits, see the Rate Limits section in the API Overview.
Alert lifecycle
The alert lifecycle describes alert status transitions, from Open status to Closed status, as a result of actions applied to the alert.
Alert action
The following actions can be applied to an alert:
| Action | Description |
|---|---|
Acknowledge | A received alert needs to be acknowledged. After you acknowledge the alert, a comment is displayed as Acknowledged and includes the user name. From the Incident unique ID drop-down menu, click Acknowledge and a tick mark is displayed below the Incident ID. |
Create Incident | A ticket can be created for the generated alert, assigning users and setting the priority. After an incident is created, the status of the alert changes to Ticketed and the incident ID is displayed in the Action/Status column. |
Attach And Update Incident | Map an alert to an existing ticket or update the ticket with the alert contents. This action is generally used to update the same ticket with related alerts. |
Attach Incident | Map an alert to an existing ticket without updating the ticket with the alert contents. |
Suppress | Suppress the current alert and all duplicate alerts. A new alert of the same type is displayed as a fresh alert and not as a duplicate alert. The status of the alert changes to Suppressed. The Snooze setting suppresses alerts for a specified time interval. If a repeated alert occurs when the alert is in snoozed state, the alerts repeat count increments and the snooze duration is reset based on the repeated alert attributes. Note that if the alert payload has a source time that is older than the suppression time, the First Response recommendation or suppression is not applied. |
Unacknowledge | Undo the Acknowledge action taken on an alert. For example, if a solution did not address a specific problem, unacknowledge the alert. The status of the alert changes to Open or Ticketed provided an incident ID is associated with the alert. |
Unsuppress | Undo a Suppress action taken on an alert. The status of the alert changes to Open or Ticketed provided an incident ID is associated with the alert. |
Run Process | Add process definitions to an alert and run. The option does not appear for Suppressed and Heal alerts. |
Close | Close an alert when an issue is solved and the alert is resolved. The alert state changes to OK. | Heal | Under the alert list, there is a new option called Heal. When the user selects the Heal action, an OK alert with the identical properties is created, giving the appearance that the alert has been healed. This will make it easier for users to manually fix the alert.This option is applicable to heal the alert for critical and warning types of alerts even if they are in any action. We don't have the option to perform heal action on multiple alerts simultaneously, but can perform heal alert action only on one alert at a time. |
For correlated alerts, an action can be performed on the entire inference, but not on a single alert.
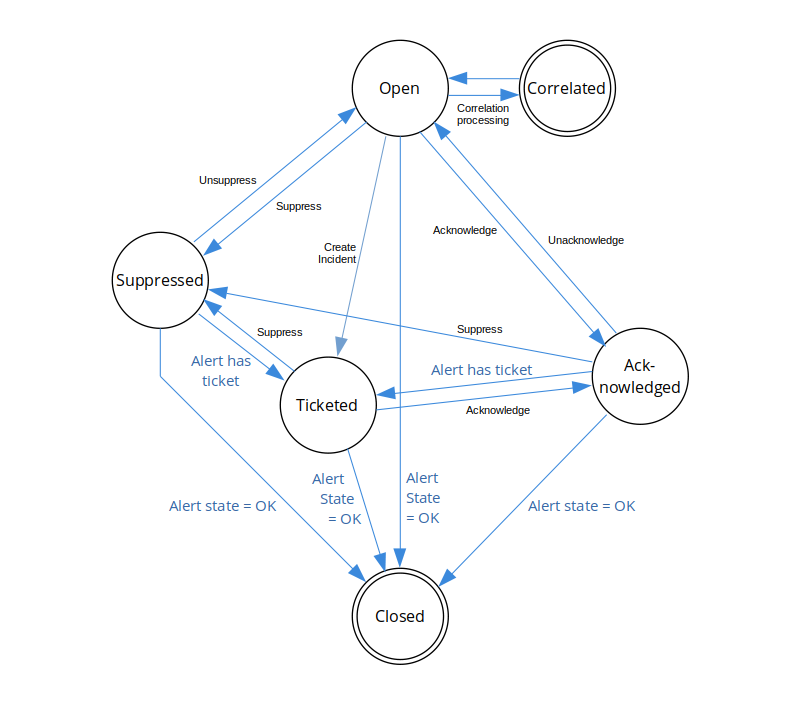
Alert status
Alert status describes a logical condition of an alert within the alert lifecycle. Alert status should not be confused with alert state, which can be critical, warning, or OK.
Both automatic and manual alert actions can cause an alert status change, as shown in the following figure:
| Status | Description |
|---|---|
| Open | The initial alert status is Open. |
| Correlated | Alert correlation processing changes the alert status to Correlated. Alerts correlated to an inference have a Correlated status and subsequently inherit the inference alert status. Correlated alerts do not change status independently but transition with the associated inference alert status. Suppress and Acknowledge actions can be applied to an inference alert and the correlated alert logically inherits the associated inference alert status but the alert, itself, retains a Correlated status. Therefore, you do not need to suppress a correlated alert because the Correlated status is a final status for alerts that are part of an inference. |
| Ticketed | The Create Incident action transitions open alerts to a Ticketed status.A Ticketed alert retains a Ticketed status even if an Unacknowledge or Unsuppress action is applied. |
| Acknowledged | Acknowledged alerts are set to an Acknowledged status. |
| Suppressed | Suppressed alerts are set to a Suppressed status. |
| Closed | The Closed status is a final alert status. Alerts can be closed manually only when the alert is in the OK state. |
You can monitor alert status in the Alert Details page comments section:
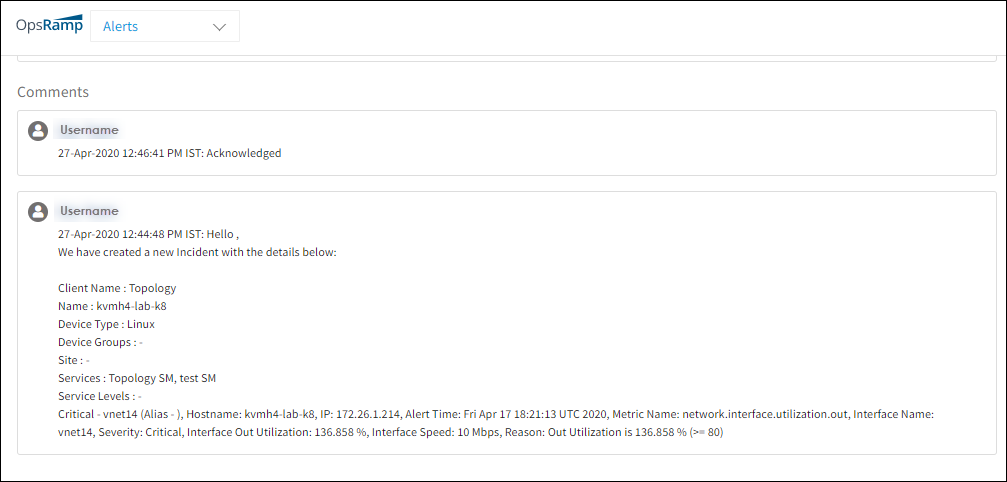
After waiting until the problem no longer is displayed as an alert the alert is placed in the OK state. Alerts in the OK state are not displayed in the alert browser. In the OK state, if the same alert reoccurs, a new alert is created. Otherwise, the repeat count is incremented for the alert.
Alert filters
The following filters can be applied to alerts:
| Attribute Name | Description |
|---|---|
| Client | View the alerts of all or select clients. |
| Resource Origin | View alerts from all sources or a single source. |
| Sites | Select alerts specific to the site. |
| Resource Groups | Select alerts associated with a resource group. |
| Resource Type | Filtered alerts by resource type. Multiple resource types can be specified up to a maximum of ten. |
| Name | Filter alerts by resource name. |
| Source | Filter alerts by source, such as the available integrations. |
| Entity Type | Filter alerts by entity type:
|
| Alert Type | Filter alerts by alert type:
|
| Metric | Filter alerts by metric name. |
| Priority | Filter alerts by priority, where P0 is the lowest priority and P5 is the highest priority. |
| Current Status | Filter alerts by status or state:
|
| Actions | View alerts by current status:
|
| Duration | Filters on alerts that occurred within a specified duration. For example, if the duration is set to the last seven days and the alert timestamp is set to created time, alerts created within the last seven days are selected. |
| From Date | Specify duration start time. |
| To Date | Specify duration end time. |
| Alert Timestamps | Filter by alert timestamp. |
| Event Type | Filter by event type:
|
| Special Attribute | Filter on alerts triggered when a resource becomes unavailable. |
Native attributes filter criteria
Below are the description of the native attributes that can be applied to alerts in alert browser criteria and Alert Management Policies filter criteria.
| Native Attribute Name | Description |
|---|---|
| Agent Installed | Agent monitoring resources. |
| Alert Component | Component of a threshold-crossing alert. |
| Alert Description | Filter by a brief description of the alert source and cause. This might include metrics with threshold crossings, monitor description, device type, template name, group, site, service Level, and component. |
| Alert Metric | Filter alerts by service name of a threshold-crossing alert. |
| Alert Occurrence Frequency | Filter by the number of different alerts within a period of time. |
| Alert Problem Area | Filter alerts by the problem area which is extracted from the alert metric. |
| Alert Type | Filter type of the alert. |
| Alert Subject | Alert description summary, which includes metrics associated with the alert. |
| Alert Source | Filter alerts by their source which is the platform or the monitoring tool that generates the alert. |
| Alert State | Filter alerts by status or state. |
| Alias name | Filter alerts by Alias name of the resource associated with the alert. |
| DNS Name | Filter alerts by DNS name of the resource associated with the alert. |
| ip Address | Filter alerts by ip address of the resource associated with the alert. |
| Model | Filter alerts by the model of the resource associated with the alert. |
| Application | Filter alerts by application of the resource associated with the alert. |
| Operating system | Filter alerts by an operating system of the resource associated with the alert. |
| Resource Name | Filter alerts by name of the resource associated with the alert. |
| Resource Group | Filter alerts by name of the resource group associated with the alert. |
| Resource Type | Filter alerts by resource type. Multiple resource types can be specified up to a maximum of ten. |
| Service Group | Filter alerts by name of the service group of the resource associated with the alert. |
| Inference Alert | Filter alerts by the alert whose event type is inference. |
| Make | Filter alerts by selecting the manufacturer of the resource. | Site | Filter the alerts specific to site. |
| Resource: Instance id | Filter alerts by instance id of the resource associated with the alert. |
| Resource: Resource IP | Filter alerts by resource ip of the resource associated with the alert. |
| Resource: Resource Name | Filter alerts by name of the resource associated with the alert. |
| Resource: Resource Type | Filter alerts by type of the resource associated with the alert. |
| Resource: Resource Group | Filter alerts by name of the resource group of the resource associated with the alert. |
| Alert: No. of Occurrence | Filter alerts by number of repeated alerts. |
| Alert: Update Time | Filter alerts by most recent alert time. | Alert: Healed Time | Filter alerts by alert healed time. | Resource: AWS Account id | Filter alerts by the AWS account id of the resource associated with the alert. | Resource: AWS Instance Name | Filter alerts by the AWS instance name of the resource associated with the alert. | Business Hours | Filter alerts by the business hours based on the user configuration. | Alert: Component | Filter alerts by the component of the alert. | Alert: Created Date | Filter alerts by the alert creation date. | Resource: DNS Name | Filter alerts by the DNS name of the resource associated with the alert. |
Alert noise
Alert noise or alert floods might make it difficult to recognize and deal with more important alerts. The platform can reduce alert noise in the following ways:
- Automatically ignore repeat alerts
- Manually stop processing alerts temporarily
Automatically ignore repeat alerts
When the platform receives more than one alert with the same resource, metric, component, and state combination within one minute, the platform ignores the alerts after processing the first alert.
Ignoring the repeat alerts conservers resources. Outgoing email can be blocked if the platform continues to process the noise. When there are no repeat alerts with the same resource, metric, component, and state combination within a minute, the platform resumes normal alert processing.
Manually stop processing alerts temporarily
When the platform receives an alert flood from a resource or metric, the operations team stops the processing of the resource or metric until they ensure the flooding has stopped. For example, flooding occurs when you get 100s of alerts within a few minutes from a single metric on a resource or a resource sends 100s of alerts within a few minutes. This flood of alerts affects the processing of other alerts for the client, which might be important alerts. Also, this flood of alerts from one client might affect alert processing for other clients as well because of the load generated by these noisy alerts. When this flooding occurs, the operations team changes the server configuration to stop processing these alerts and informs the corresponding client of the issue. After the issue is resolved, the operations team changes the configuration back to normal to process all alerts.
Alert repeat and occurrence history
Older alert occurrences are not always available because they are purged after 180 days.
- On the Alerts page, the link in the Repeat column does not show the number of alerts indicated when the occurrences are older than 180 days.
- On the Alert Details page, the Total Occurrences link does not show the number of alerts indicated when the occurrences are older than 180 days.
De-duplicated Alerts (Repeated Occurrences)
When an alert is triggered repeatedly under the same conditions, the system avoids generating multiple separate alerts by appending the new occurrence to the existing alert. This is known as alert de-duplication or handling repeated occurrences.
Conditions for Repeated Occurrence (De-duplication)
A new alert will be treated as a repeated occurrence of an existing alert (instead of creating a new one) only if all the following conditions are met:
- Matching Context: The following attributes of the new alert must exactly match the existing open alert:
- Client
- Resource
- Metric
- Component
- Alert Status: The existing alert must not be in the OK state. If the alert is in the OK state, a new alert will be created.
- Mapped Incident (if applicable): If the existing alert is mapped to an incident, the incident must be in the Open state. If the incident is Resolved or Closed, a new alert will be generated instead of appending to the previous one.
Example Scenario:
| Condition | Result |
|---|---|
| Same client/resource/metric/component + existing alert in Critical state + mapped incident is Open | Alert is de-duplicated (appended as repeated occurrence) |
| Existing alert is in OK state | New alert is generated |
| Incident mapped to alert is Closed | New alert is generated |
Machine learning concepts
Machine learning (ML) status shows the stages of machine learning implemented in a policy used with analyzing a sequence to suppressing alerts:
| ML Status | Description |
|---|---|
 | Insufficient data. The policy is temporarily disabled. Due to insufficient data, the machine learning model cannot detect any alert sequences and the policy is temporarily disabled. The policy becomes active when the machine learning model has sufficient data. |
 | Training ML model is queued. When a policy is created or a CSV file is uploaded to a policy, the training can be queued. If a policy is in training, the new policy is queued. After the training on the existing policy is completed, the status of the new policy moves to training initiated. |
 | Training ML model is initiated. After completion, training on the machine learning model is initiated. The status then moves to training started. |
 | Training ML model is started. After completion, training on the machine learning model is started. Training progress is shown on the progress bar. |
 | Training ML model is in progress. After completion, training on the ML model continues with the percentage of progress shown in the progress bar. |
 | ML model training is complete. Predictions will commence and the ML model detects alert sequences and suppression. |
 | ML training encountered an error. Contact support for assistance. |
ML seasonality patterns
Alert seasonality patterns help detect seasonal patterns of alerts. These patterns are based On unmodified alert information retrieved from existing data. OpsQ suppresses an alert that matches with the seasonality pattern detected by ML. For example, if an alert is displayed at 10 PM on Mondays, OpsQ suppresses the alert triggered at 10 PM on Mondays.
ML retrieves three months of alerts and groups alerts based on three attributes (resource, metric, and component). Seasonal patterns of alerts are studied for each group. Alert groups that have seasonal patterns are listed and displayed when a group is selected.
Ninety percent of the alerts must be seasonal to qualify as seasonal alerts.
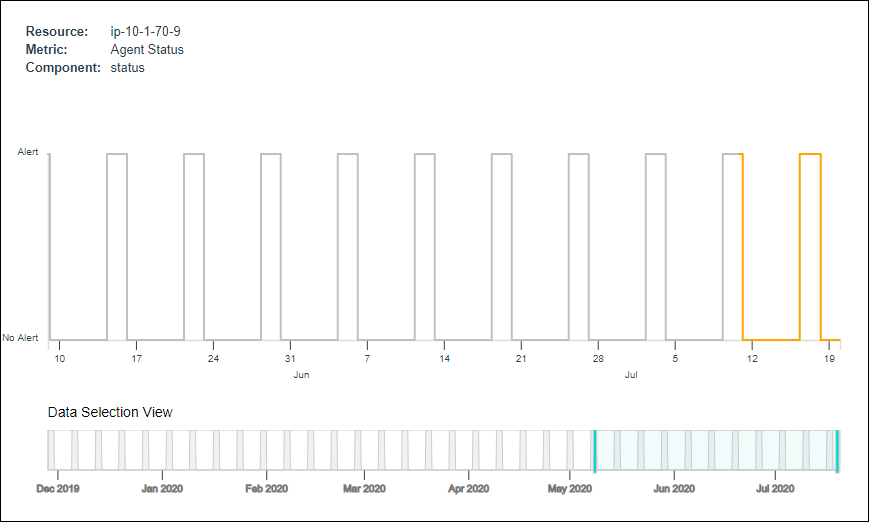
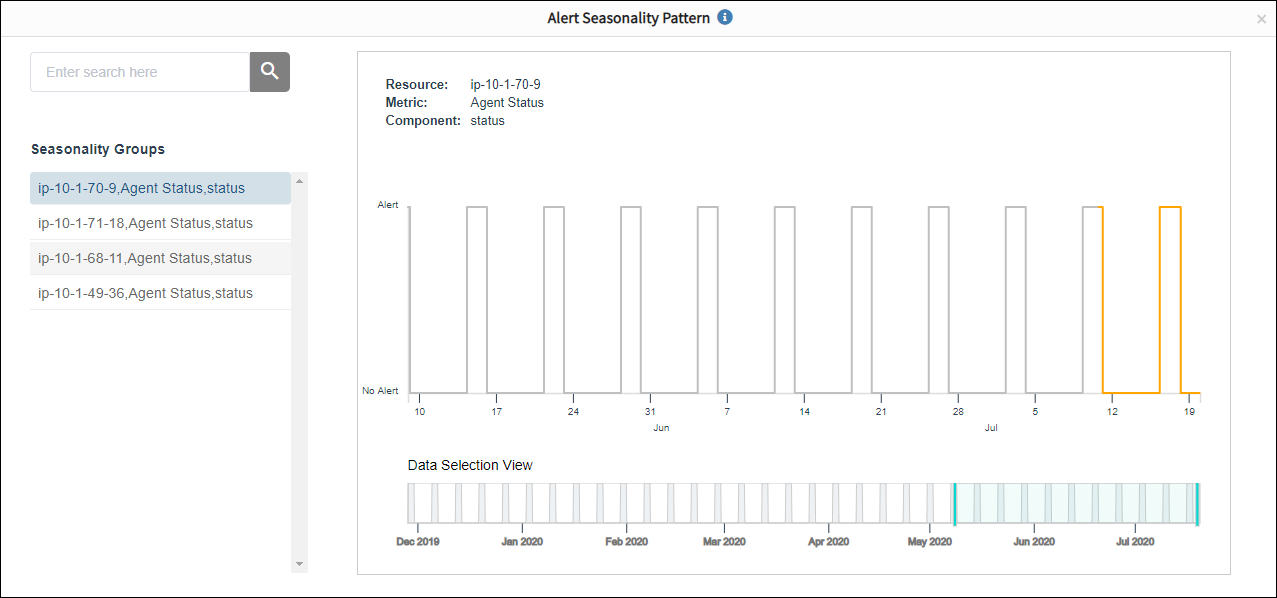
Seasonality pattern graphs
Seasonality pattern graphs have the following attributes:
| Attribute | Description |
|---|---|
| Resource, metric, and component | Attributes of alerts and the seasonality group that is selected.The seasonality groups are named using these three attributes. |
| Numbers (displayed horizontally) | The timeline with dates in a month.Hover over the dates to view the date and time for each generated alert. |
| Gray lines | The past alerting time for a specific group (resource, metric, and component). |
| Orange lines | The predicted alerting time based on the learned alert seasonality. |
| Blue shaded area | Zoom in (or zoom out) on the blue line to examine time duration. |
Seasonality groups in the graph refer to alert groups that have seasonal patterns.
The following graph provides the details of the seasonal patterns for alert data and describes when OpsQ suppresses alerts due to matching seasonal patterns:
This is a sample recommendation by the OpsQ bot for a suppressed seasonal alert:

The following graph shows the seasonal pattern of a suppressed alert: