How to access the Gateway logs if encountered with following issues?
- Gateway is disconnected
- Discovery and monitoring not working
- App installation failed
Kubernetes keeps detailed logs of all cluster and application activities, which you can use to narrow down the causes of any failures.
Step 1: See the detailed logs for each container
- To check the detailed logs for each container, first we need to get the pod name using the following command.
kubectl get pods -A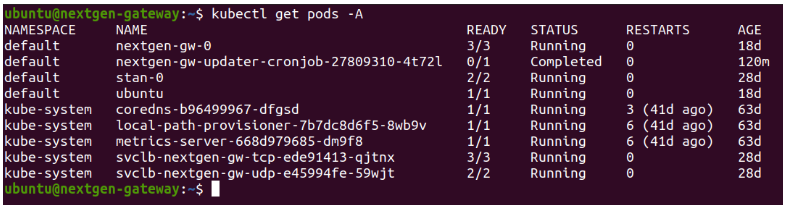
- Now, if we want to check the nextgen-gw-0 pod logs and the list of containers running within the POD, use the following command.
kubectl get pod nextgen-gw-0 -o="custom-columns=NAME:.metadata.name,CONTAINERS:.spec.containers[*].name"
To check the container logs, use the following command.
kubectl logs <pod name> --container <container name> -fTo check the previously terminated pod logs, use the following command.
kubectl logs <pod name> --container <container name> -f -p
Step 2: See the Vprobe container logs
Vprobe container is a core container and if any issues observed with connectivity issues, discovery, monitoring, scheduling, app install/uninstall, and app upgrade then you must to verify the vprobe container logs.
kubectl logs nextgen-gw-0 --container vprobe -fStep 3: See the Nativebridge container logs
Nativebridge is responsible for native commands and script executions. If you observe any issues with modules that use native commands or script executions, you should check the nativebridge container logs.
kubectl logs nextgen-gw-0 --container nativebridge -fExample: Ping, EMC VNX, EMC VNXe, EMC ClaRiion, RSE etc.
Step 4: See the Postgres container logs
Postgres container is responsible for persisting the data. If you observe any issues with postgres container startup, you should check the postgres container logs.
kubectl logs nextgen-gw-0 --container postgres -f