A trace is the complete record of a request as it moves through an application. Every span in that request carries the same trace ID, allowing OpsRamp to group distributed work into one transaction.
A span is a timed operation. Typical spans represent inbound HTTP requests, outbound API calls, RPC methods, database statements, queue producers or consumers, and internal application steps. A span normally records its name, start and end time, duration, service, operation, attributes, events, and status.
Building the call tree
Each span has a span ID. A child span also carries the span ID of its parent. These identifiers form a directed call tree:
- The first operation creates the root span. It has no parent span within the trace.
- When that operation starts downstream work, it creates or propagates context for a child span.
- The child keeps the same trace ID and records the caller’s span ID as its parent ID.
- The process repeats across services until the request completes.
The root span usually approximates end-to-end request latency. Child spans explain how that time was distributed. Sibling spans share a parent and can overlap when work executes concurrently.Missing parent spans can occur when context was not propagated, instrumentation was incomplete, or sampling removed part of a trace. In those cases, OpsRamp can still display received spans, but the call tree may be partial.Use the trace waterfall or span map to inspect sequence, nesting, parallel work, critical-path latency, and the operation where an error originated.
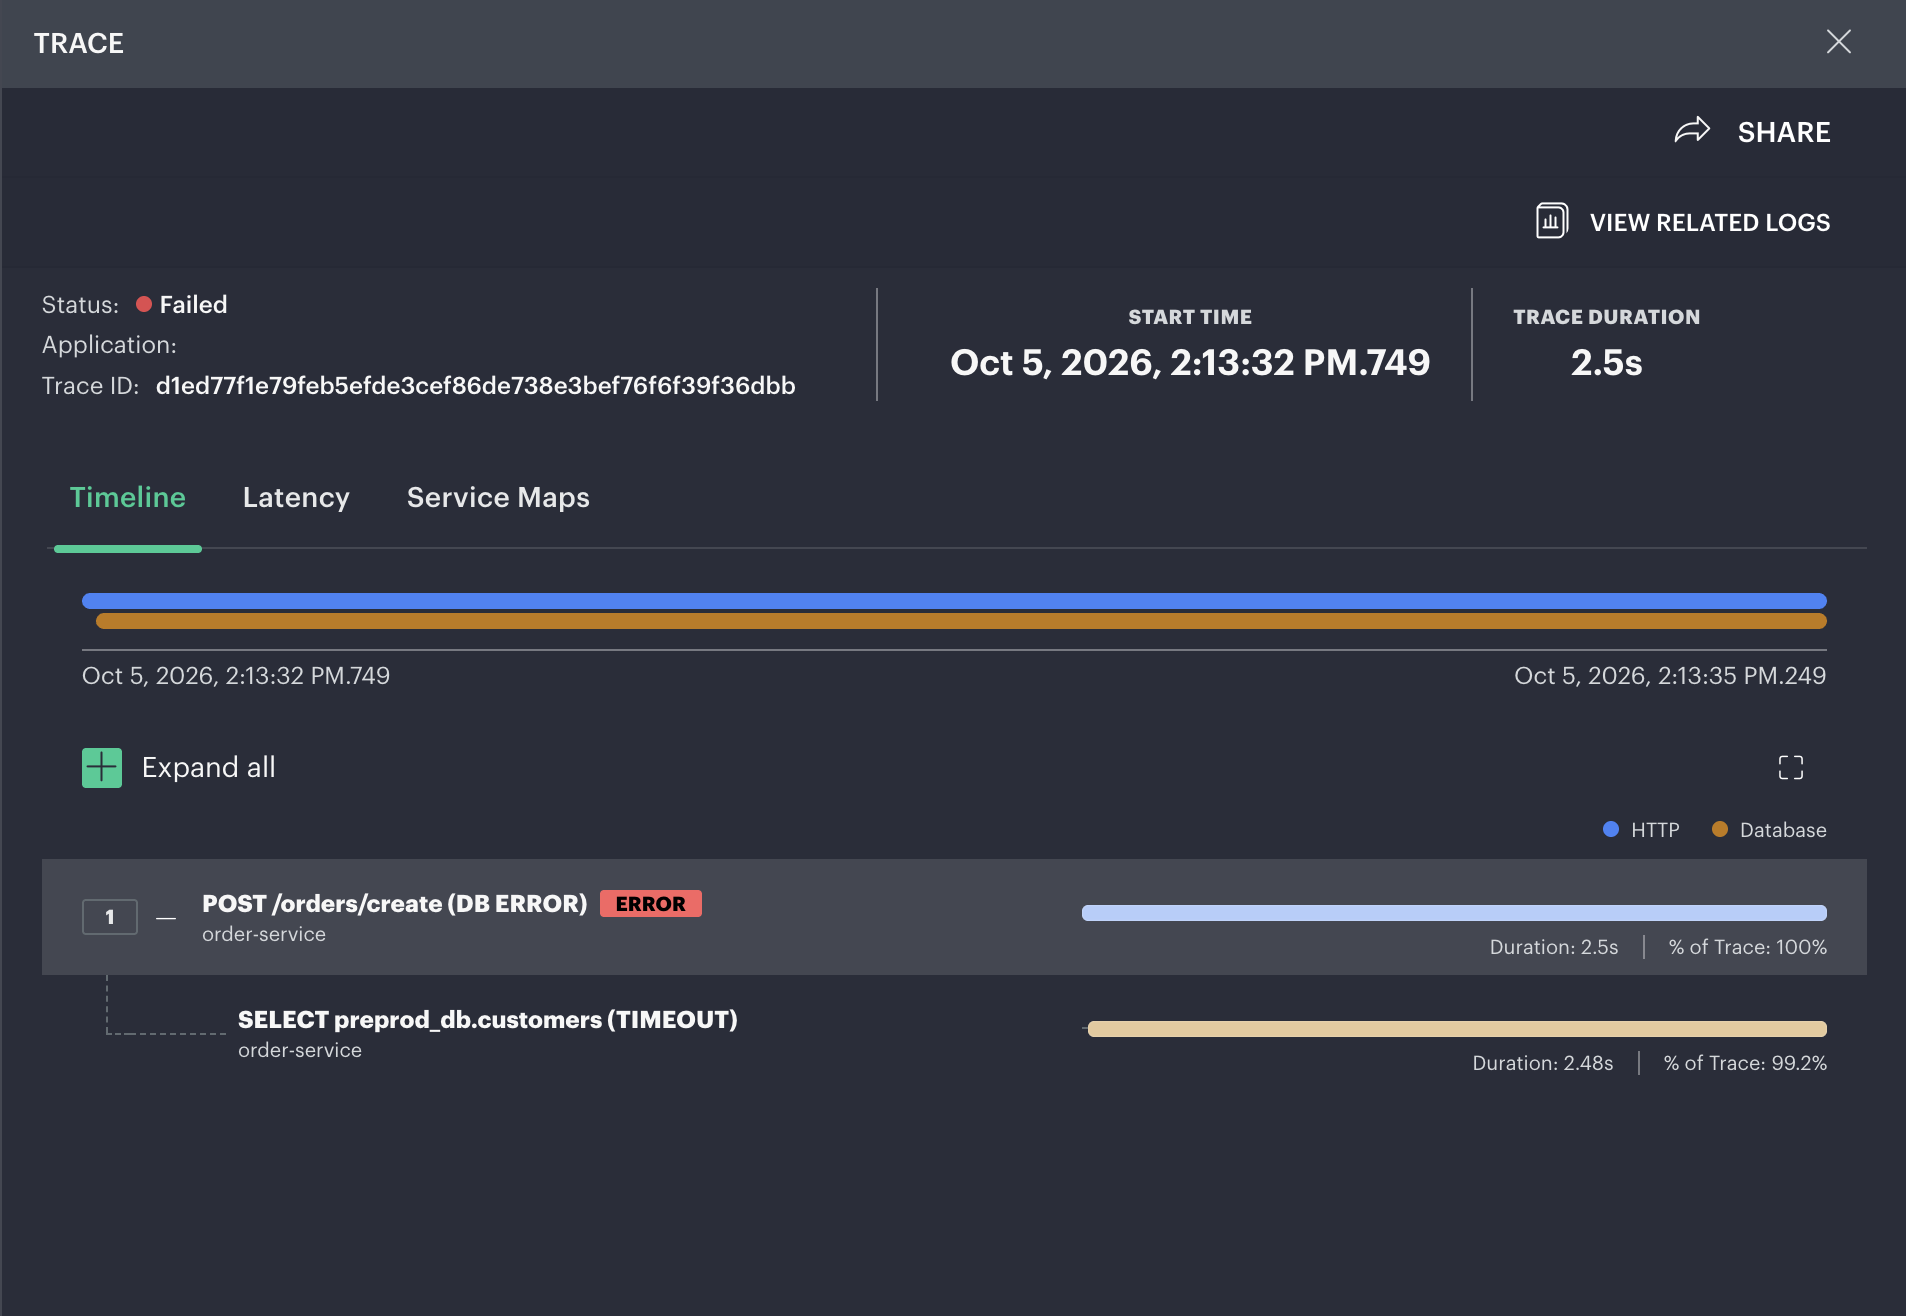
Synthetic OpsRamp portal example: the database child starts after the HTTP parent and finishes within its duration.