OpsRamp’s trace views derive service and operation insights from ingested spans. Depending on the deployed version and available data, these include average, percentile, and maximum latency; throughput; error rate; and Apdex.
Read the metrics in context
- Compare services and operations over the same time range before attributing a change to one dependency.
- Use latency percentiles to identify tail behavior that averages can hide.
- Interpret throughput and error rate together; a low error count during low traffic is not evidence of healthy capacity.
- Apdex depends on the configured threshold. Confirm the active threshold with the tenant or proxy configuration before comparing services.
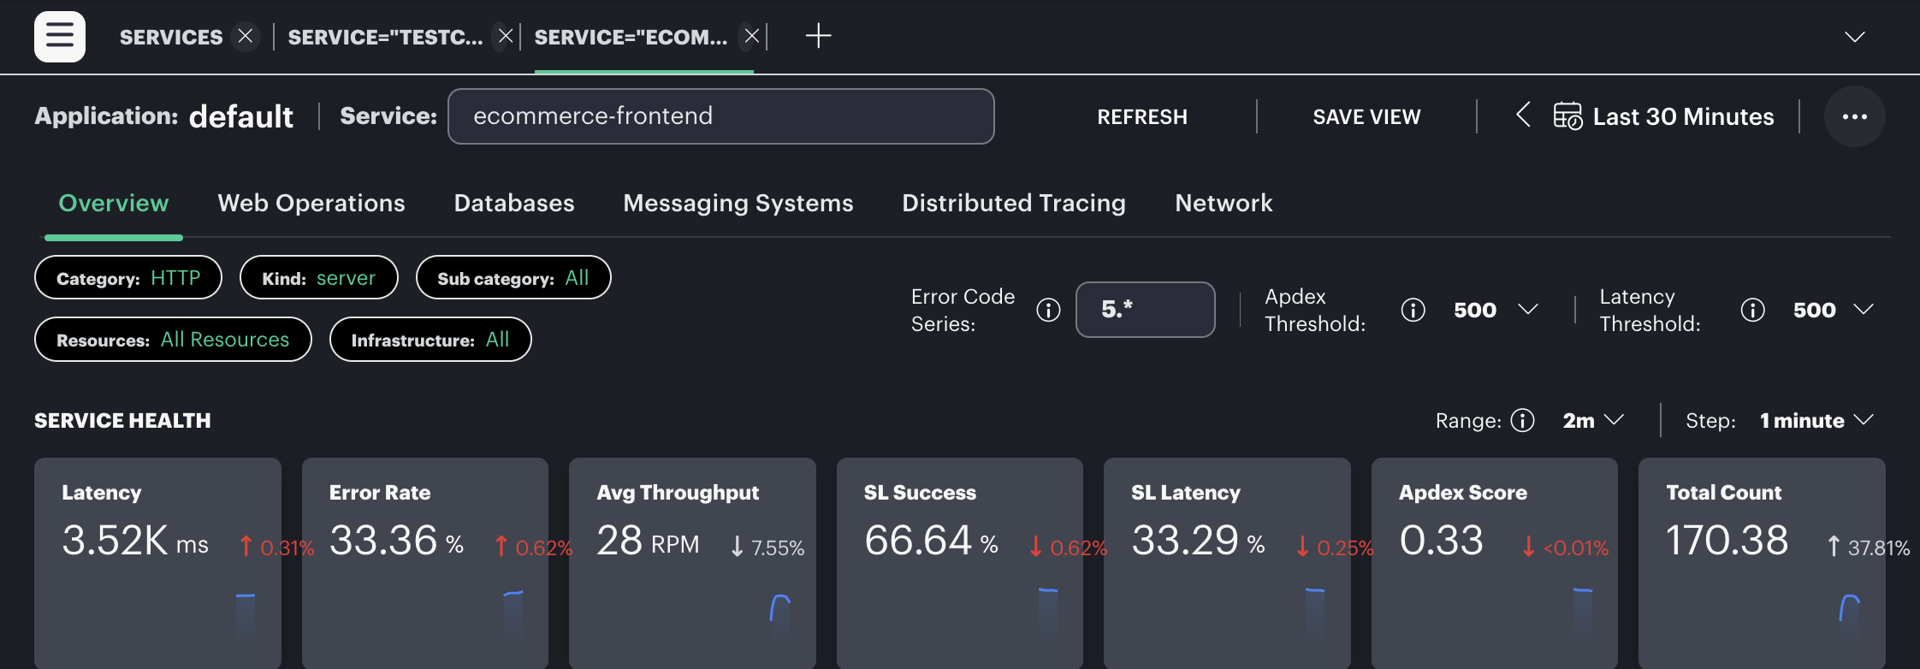
These are trace-derived insights, not a guarantee that every tenant has identical dashboards, thresholds, or metric export configuration. Open representative traces to inspect the spans behind an unusual metric, and confirm sampling has not removed the population needed for the question being asked.