Service map overview
Service maps organize services into a hierarchical structure that provides visibility into your services and dependent resources. A service can be an application or an infrastructure service. With service maps, you can:
- Analyze the impact of IT resource on a business service
- Manage application and infrastructure dependencies
- View the relationship between resources and services impacting your business
Service map nodes
Service maps contain nodes that represent a group of services or resources:
- Parent Node: A parent node is the service context (root) node that represents a service. For example, discovery or maintenance.
- Child Node: A child node is the service or resource context node that represents a service or monitored resource, such as switches, Linux servers, storage devices, or other services. Resources can only be added to a child node, not to a parent node.
Use cases
Track the health of a service
You might want to track Wi-Fi service availability, which has two components:
- Wireless Controllers
- Wireless Access Points
You want to know:
- Is the service available?
- If the service goes down, which component is causing the fault?
- How much of the service downtime can be attributed to each component?
Solution:
- Create a service map with node Wi-Fi service as the service type and the other nodes as the network resource types.
- Indicate the availability of a Wi-Fi service by defining the availability on Wireless controller and Wireless access points.
- Formulate their health to the overall availability of Wi-Fi service.
When a Wi-Fi service experiences a degradation, it indicates that the components are unavailable.
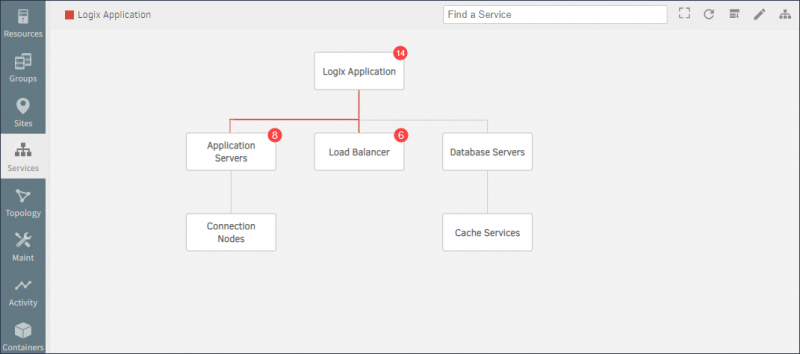
Identify users impacted by an IT service
For a web application with three components, load balancer, application servers, and database servers, which components impact the web application when the component fails.
Solution:
- Create a node (service group).
- Enter the name of the web application,
- Create another three nodes representing each application component.
- Add resources or services to the nodes.
- Define the availability monitor on the three nodes.
The web application node experiences degradation when any of the three components become unavailable.
Topology explorer overview
Topology explorer is a visual representation of the infrastructure and its connections that displays the health of the infrastructure.
Topology explorer applies only to resources discovered by an agent or gateway, which automatically discover resources and their connections. After collecting the data of each element, topology combines resource information to generate a map that represents your infrastructure. Data collection mechanisms include:
Application, Kubernetes, and KVM resource data are collected by the agent.
Network resources data is collected by the gateway using the following protocols:
- Cisco Discovery Protocol (CDP)
- Link Layer Discovery Protocol (LLDP)
- Open Shortest Path First (OSPF),
- Border Gateway Protocol (BGP)
Dynamic changes in the topology detected by the gateway. These changes are identified by periodically scanning the network.
Key concepts
Topology explorer shows resources and connected resource dependencies. Topology aggregates related resources into a hierarchical structure and each resource, itself, has a hierarchical structure of its elements.
Vertex (node)
A vertex represents a resource that can directly communicate with other resources over a network, such as a VM instance or an AWS cloud instance. The base, or root, resource is represented as a circular node in the topology explorer and outlined in red.
If you select a resource, the connection between the base resource and the selected resource is highlighted and the other connections fade out. The selected resource is outlined in green.
Edges (connections)
Topology represents connections between nodes using lines. Topology connects nodes even if only one side of the connection is communicating.
Neighbor node discovery
When you select the CDP, LLDP option in the discovery profile, the gateway identifies the device make and model using the provided SNMP credentials. After successful resource discovery, the gateway looks for the CDP or LLDP tables to identify neighbors. Neighbor discovery is performed for each IP address discovered during the scan process. For example, if Device A is connected to both Device B and Device C when the gateway discovers the first device (Device A):
- The gateway looks for neighbors using CDP or LLDP MIB information.
- The gateway identifies Device B and Device C.
CDP table
The gateway uses the following CDP data to identify the neighboring nodes:
- The
cdpGlobaltable to identify whether CDP is enabled on the device. - The
cdpCacheEntrytable to identify the resource ID, port, address, cache platform, and capabilities.
LLDP table
The gateway uses the following LLDP data to identify neighboring nodes:
- The
lldpLocalSystemDatatable to identify local chassis ID, local chassis subtype, local system capabilities, and local port description. - The
lldpRemoteSystemsDatato identify remote port description, remote system name, and remote management address.
By querying the OIDs from the CDP or LLDP tables, the gateway identifies the neighbors for one device at a time. Based on the results it repeats the process to fetch the neighbors of the other device. The discovery process ends when the gateway identifies a terminal leaf node or discovery reaches the specified depth.
Data collection and retention
If resources are added or deleted from the network, the resource is not automatically displayed on the map. Topology is displayed according to the scan configured in the Discovery Profile dialog:
- If a periodical scan is configured, resources are displayed at the scheduled time.
- If a manual scan is configured, the network is scanned to add the resources to the map.
The topology explorer UI
You can view resources in the topology explorer UI. Use the map to explore existing configurations and for troubleshooting.
Select any node or connection to display the attributes of that entity.
To expand a node to view the resources represented by the node, double-click the + symbol at the upper-right of the node.
The following sections describe the available functions for viewing the topology map.
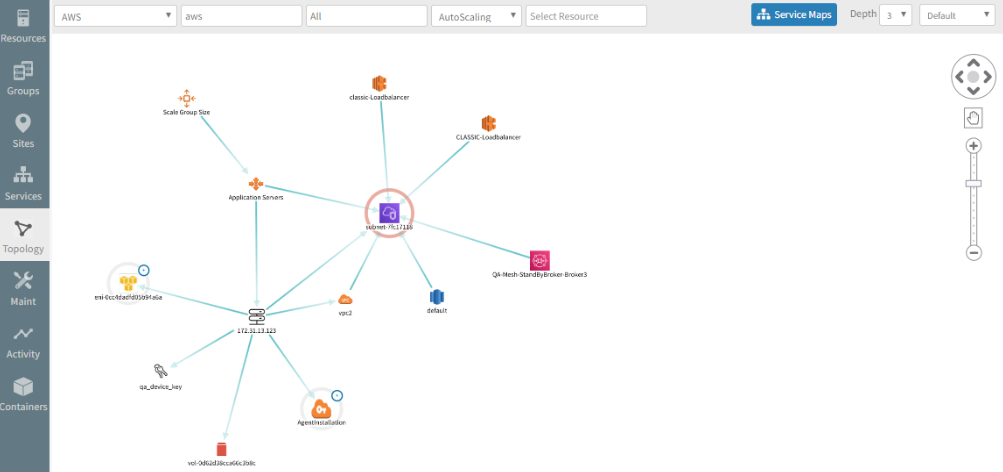
Filter
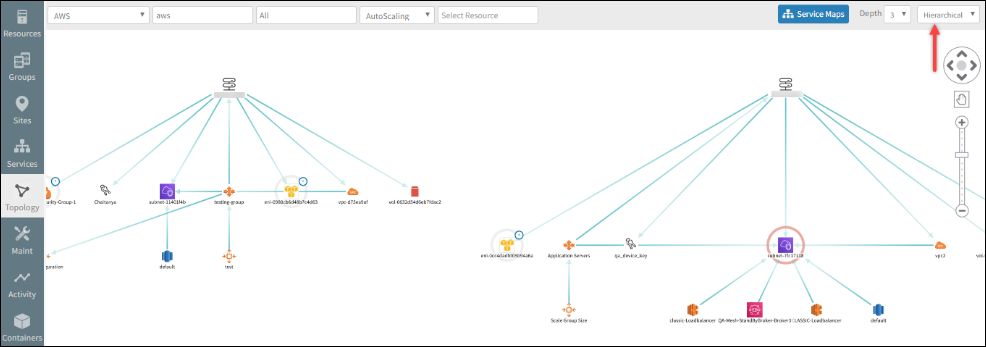
Filters help you search for and focus on specific resources, filtering by site or resource type. Topology explorer shows the filtered resources and connections. For example, you can select the resource type as AWS, select the region, and select the AWS type as Auto Scaling to see the AWS instance and the Auto Scaling resources connected to it in that region.
Depth
Depth refers to the level of topology you want to view. When you have a large number of resources across multiple levels, displaying all resources is impractical. Select the level of topology you want to view for a more comprehensible view. When you first view the topology, all base resources at the hierarchical top-level, Depth 1, are displayed. You can specify view levels up to Depth 5.
Topology layout
Layout refers to resource arrangement with two viewing options available:
The default view provides a radial or hub-and-spoke view of connected resources. This option is preferred for vertices and edges that may not express a direct parent-child hierarchy or strict dependency relationship.
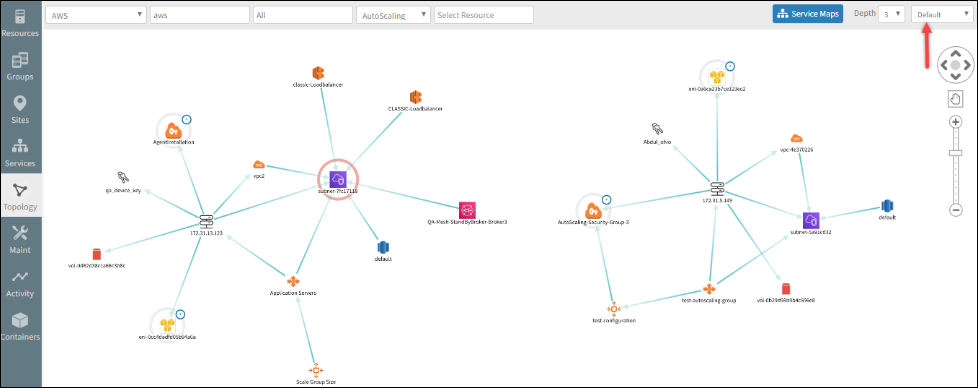
The hierarchical view presents a top-down or parent-child view of resources. This option is best for a strict dependency structure, such as a switch and connected hosts or a router and connected endpoints.
Zoom
You can zoom in and out of the topology map to change the scope of the visualization. When a map is viewed at a low zoom resolution, icons are displayed with a reduced size, the edges are thinner and the label names appear hidden. Labels are displayed when the reduced size of the node is clicked. When a map is viewed at a high zoom resolution, icons are displayed in a larger size, the edges are thicker and label names are displayed. At the default zoom level, icons are displayed at normal resolution, the edges are thicker, and label names are displayed.
Navigate topology explorer
The vertical and horizontal navigation arrows scroll the topology explorer vertically:
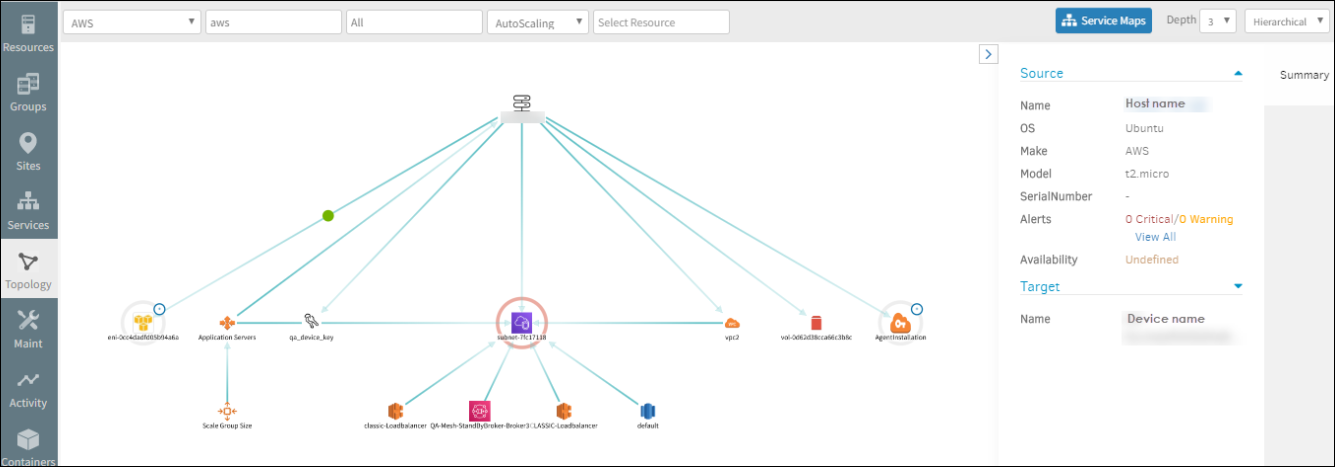
View host and target resources
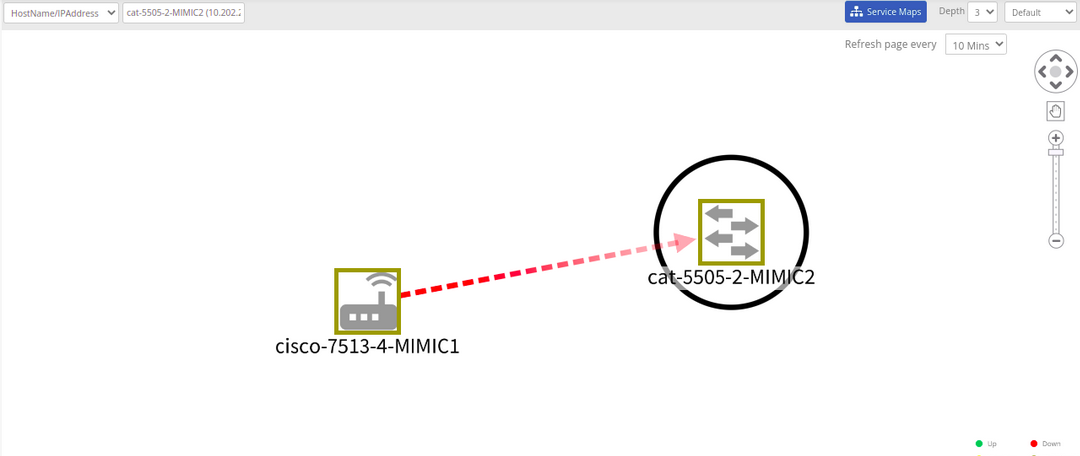
Host and target resources are connected with an edge line. When you select the line, a green dot is displayed indicating the edge was selected. Source and target resource details are also displayed in the Summary panel:
Integrate topology explorer with service maps
Creating a service map requires accurate knowledge of application dependency structures. You may often rely on tribal knowledge of application topology to create service maps when most of the dependency structures are captured by topology itself. To eliminate this problem, a solution is provided where you can create Service Maps directly from the Topology explorer page. Creating Service Maps directly from the Topology explorer page reduces the time in configuring multiple filters to create a Service Map and also enables better alert correlation, more logical resource grouping and assignment of maintenance mode.
You can create Service Maps for entities like HostName/IP Address, AWS, Azure, Google, Hypervisor environment and Kubernetes directly from the respective Topology explorer page. However, you cannot create a Service Map from Application topology.
Link Status on Topology Map
The link availability status depends on discovery and monitoring information of the interfaces.
Broken link: Operational status is down and Admin status is Up on an interface link.
Availability: Availability of a resource is defined as the responsiveness of a resource within a user accepted/agreed response time.
In the Topology Map view, based on availability the Link status is displayed, but broken link information is collected through Discovery. The near real-time link status will be derived and shown in the topology map based on discovery and monitoring data.
Prerequisite for this feature to show Network Link status
- Required Interface Monitoring template should be applied.
- Discovery profile should be created with CDP and LLDP protocols enabled.
For all monitored links, the discovered link status will be updated at the monitoring time as needed.
Below are the possible scenarios for the broken link status:
Use Cases:
Case 1: Link detected as broken at discovery time will be updated at monitoring time if it becomes Up.
- Limitation: If a link is monitored in OpsRamp and if there are no alerts on the monitor, then it will still show as “Up”.
- Limitation: If a link is monitored in OpsRamp and if there are no alerts on the monitor, then it will still show as “Up”.
Case 2: Link detected as broken at discovery time will be updated at monitoring time, if it becomes Administratively Down.
Case 3: The broken link is not corrected during monitoring time when monitoring is not enabled.