Introduction
The infrastructure workspace provides a comprehensive view of all resources available in your managed environment.
The Resource details screen displays real-time monitoring of your entire infrastructure, including network devices, cloud services, dedicated hosts, and containers in orchestrated environments.
The Resources tab shows you a complete inventory of resources in your environment. You can also view a graphical representation of your resources in dashboards. For more information about inventory widgets, see Dashboards.
The Resources page includes the following sections:
- Menu: Lists available options in the Infrastructure Workspace.
- Resource Categories: Shows resource categories, discovered resources, and unmanaged resources. Numbers indicate the total count for each category.
- Availability Status Bar: Displays the availability status of resources.
- Search Bar: Provides search options.
- Settings: Allows you to add, delete, or assign monitoring templates for resource categories and individual resources.
- Resource Display: Shows resource details.
View resource details
The Resources page displays the resource category, number of resources belonging to each category and the general attributes of the resources.
Follow these steps to view details for a resource type:
- Click the resource type name.
A list of all resources in that category appears. By default, the display includes Name, IP Address, Operating System, Resource Type, Associated Alert, Associated Incident, Associated Groups, Last Updated, and topology traits. - Click the settings icon in the top right corner to add or remove attribute columns.
- Click the number next to the resource type to view further categorization of resources. The resource attributes appear.
- Click the name, IP address, or any other clickable attribute to view resource details.
The resource category page displays the resource properties.
Resource properties
The resource category pane displays various resource properties. The following properties are common across most resource types, but properties can vary based on the resource type selected.
| Property | Description |
|---|---|
| Overview | Shows overall performance and availability of the resource. |
| Attributes | Shows basic information such as Name, Resource Type, Make, Model, and Resource UUID. Other attributes include Custom Attributes, SKUs, and Hardware information. |
| Virtual Machine | Shows the status of virtual machines. |
| Monitors | Shows monitors and monitoring templates assigned to the resource. You can assign or unassign templates, assign or unassign monitors, and assign availability rules. |
| Metrics | Displays a graphical representation of metric performance. |
| Credentials | Shows credentials associated with the resource. |
| Notes | Shows important information about the resource. |
| Impacted Resources | Shows resources that are dependent on or depend on the displayed resource. You can add or change impacted resources. |
| Inventory | Shows physical components and software modules in the network. |
| Interfaces | Shows all interface components in the network. |
| Neighbors | Shows the VLAN number, neighboring device, MAC address, neighboring interface, and bandwidth of network interfaces. |
Monitored resource data
OpsRamp displays monitored data for resources across various locations. Data collected within the past week shows the most recent timestamps and values.
The Infrastructure → Resources → Overview screen displays the last monitored time.
The resource overview screen displays values based on the following scenarios:
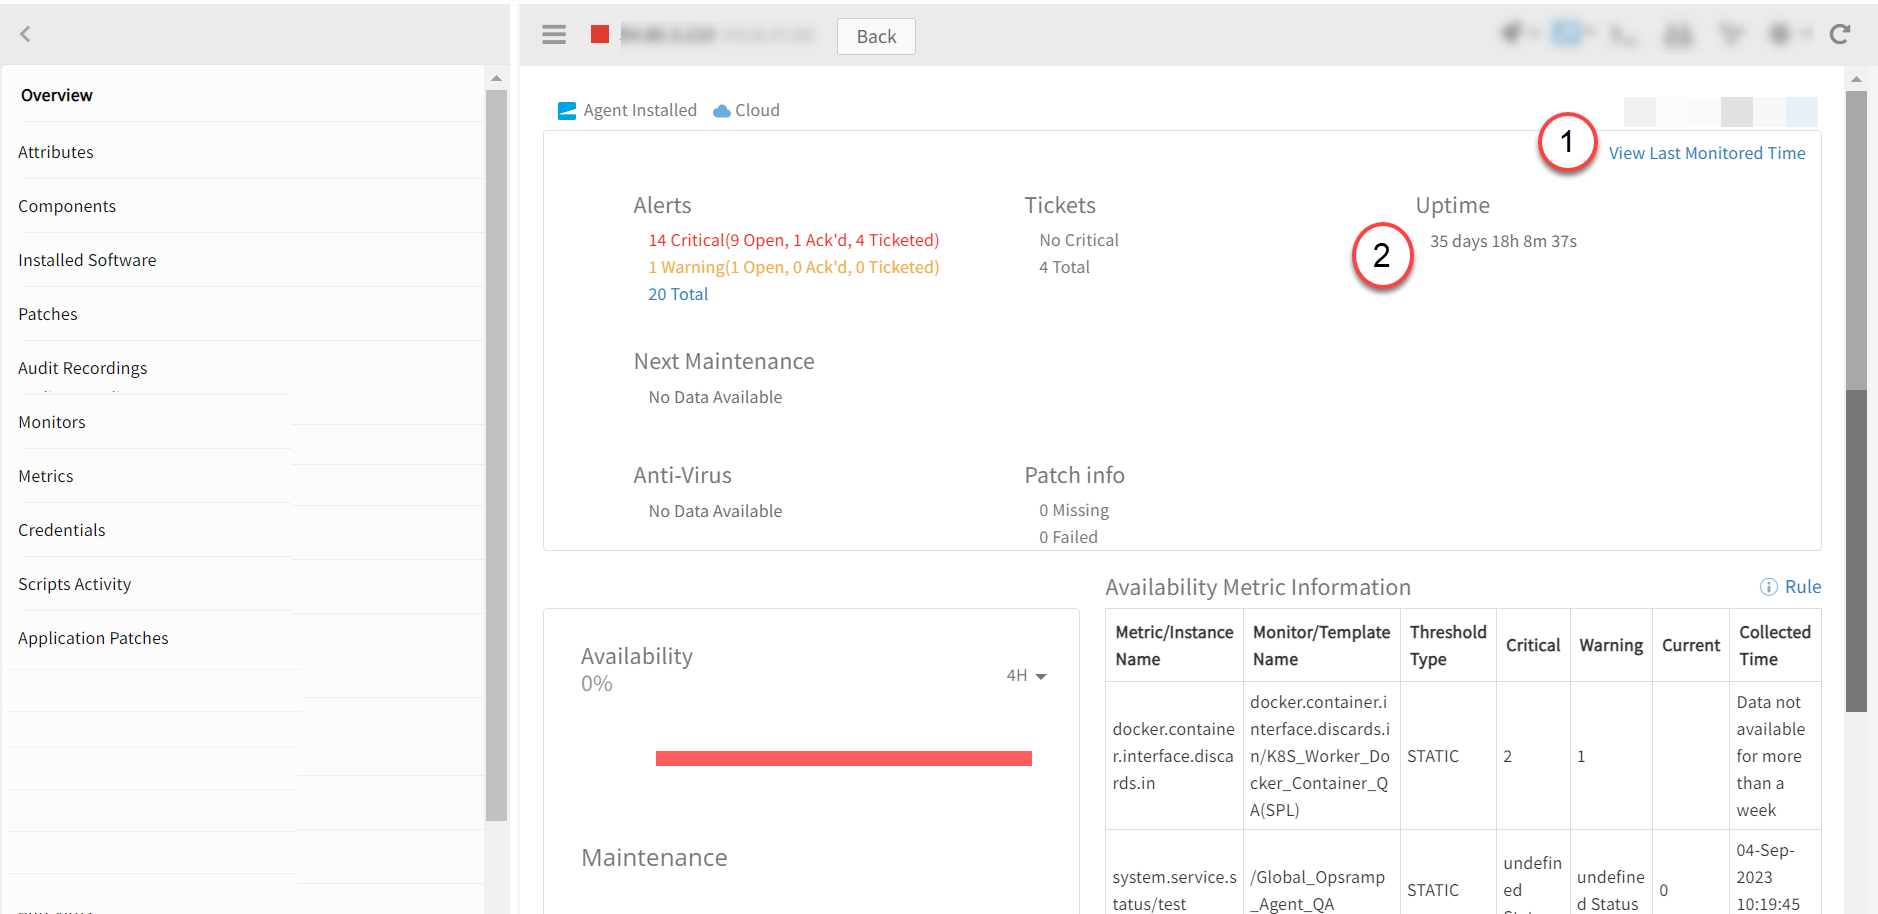
View Last Monitored Time
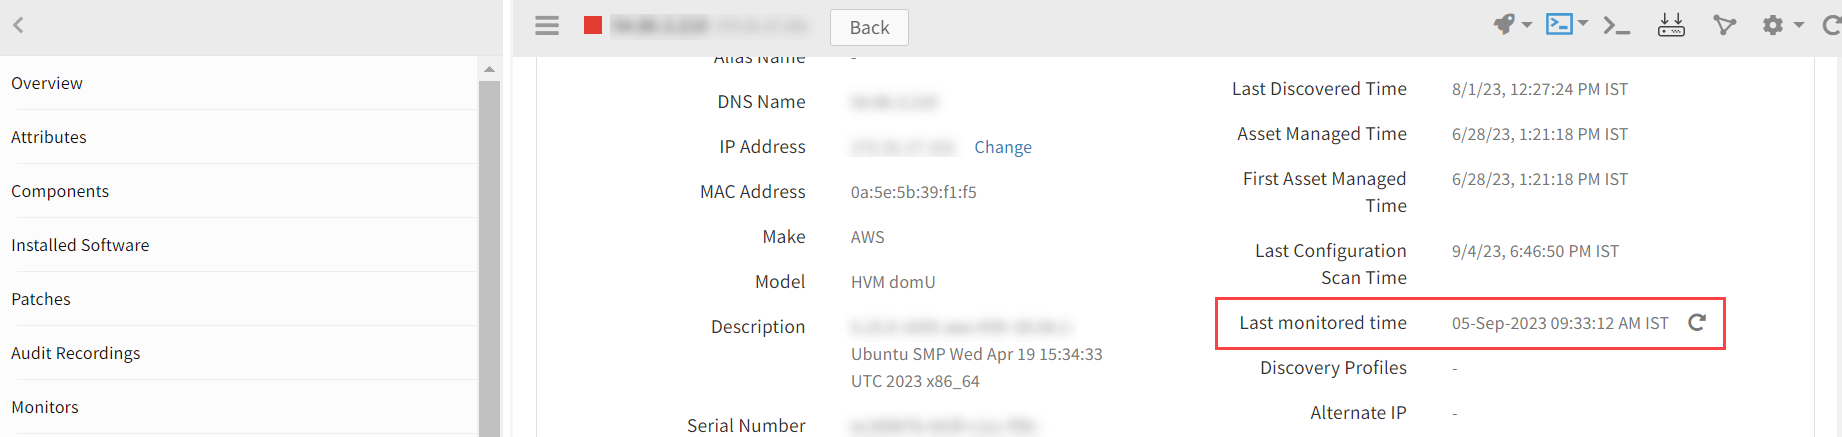
The last monitored time displays only data from the past one week.
| Callout | Scenario/Description | Value |
|---|---|---|
| 1 | Resource created within the past one week and monitored successfully. | Last updated value (date and time) |
| Resource created more than one week ago and monitored successfully. | Last updated value (date and time) | |
| Resource created within the past one week but not monitored. | Empty | |
| Resource created more than one week ago and not monitored. | Data not available for more than one week |
The last monitored time also appears in these locations:
- Resources → Attributes screen: Navigate to Infrastructure → Resources → Attributes.
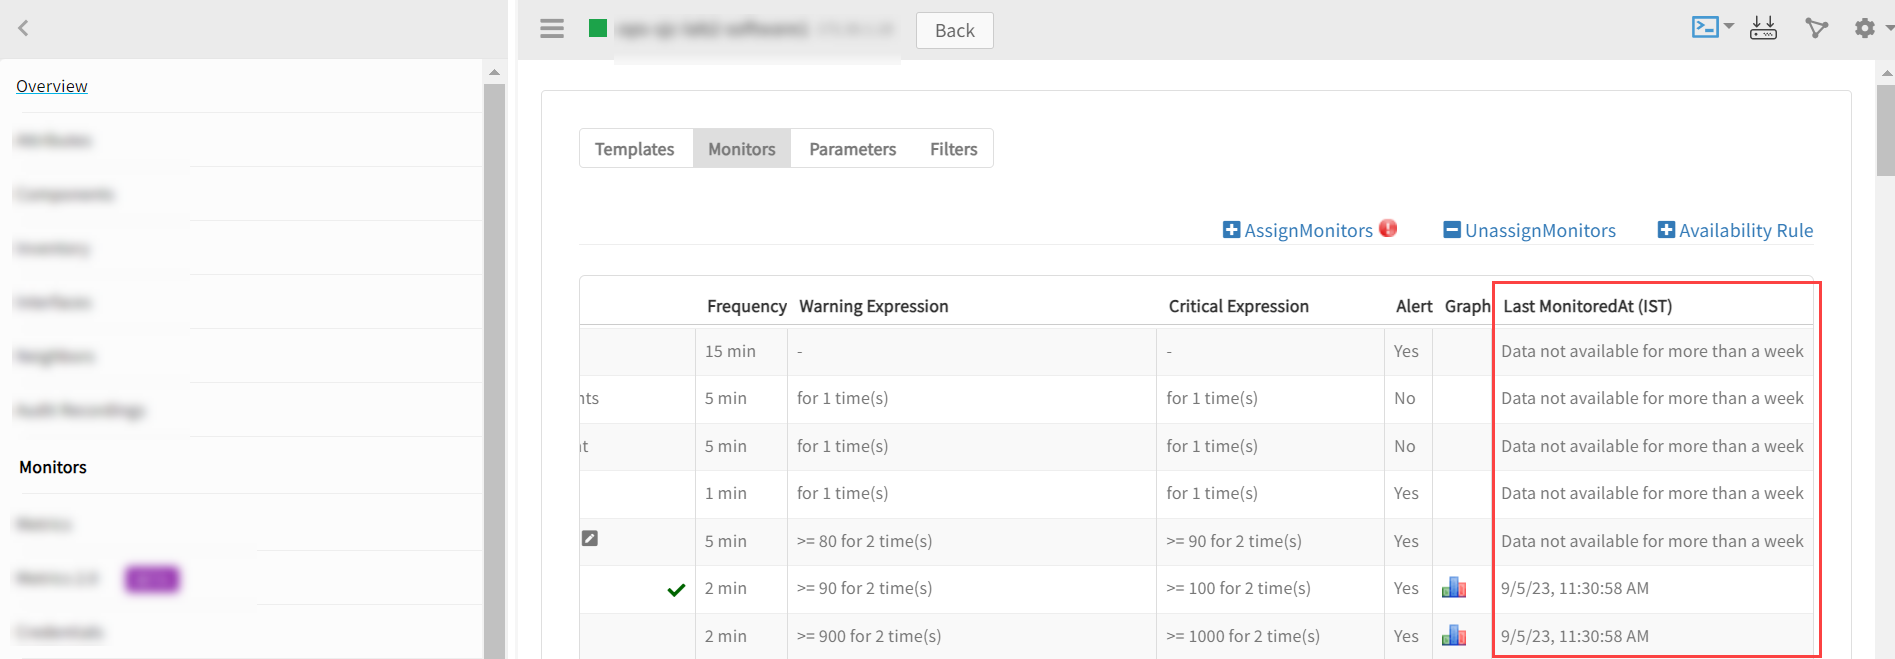
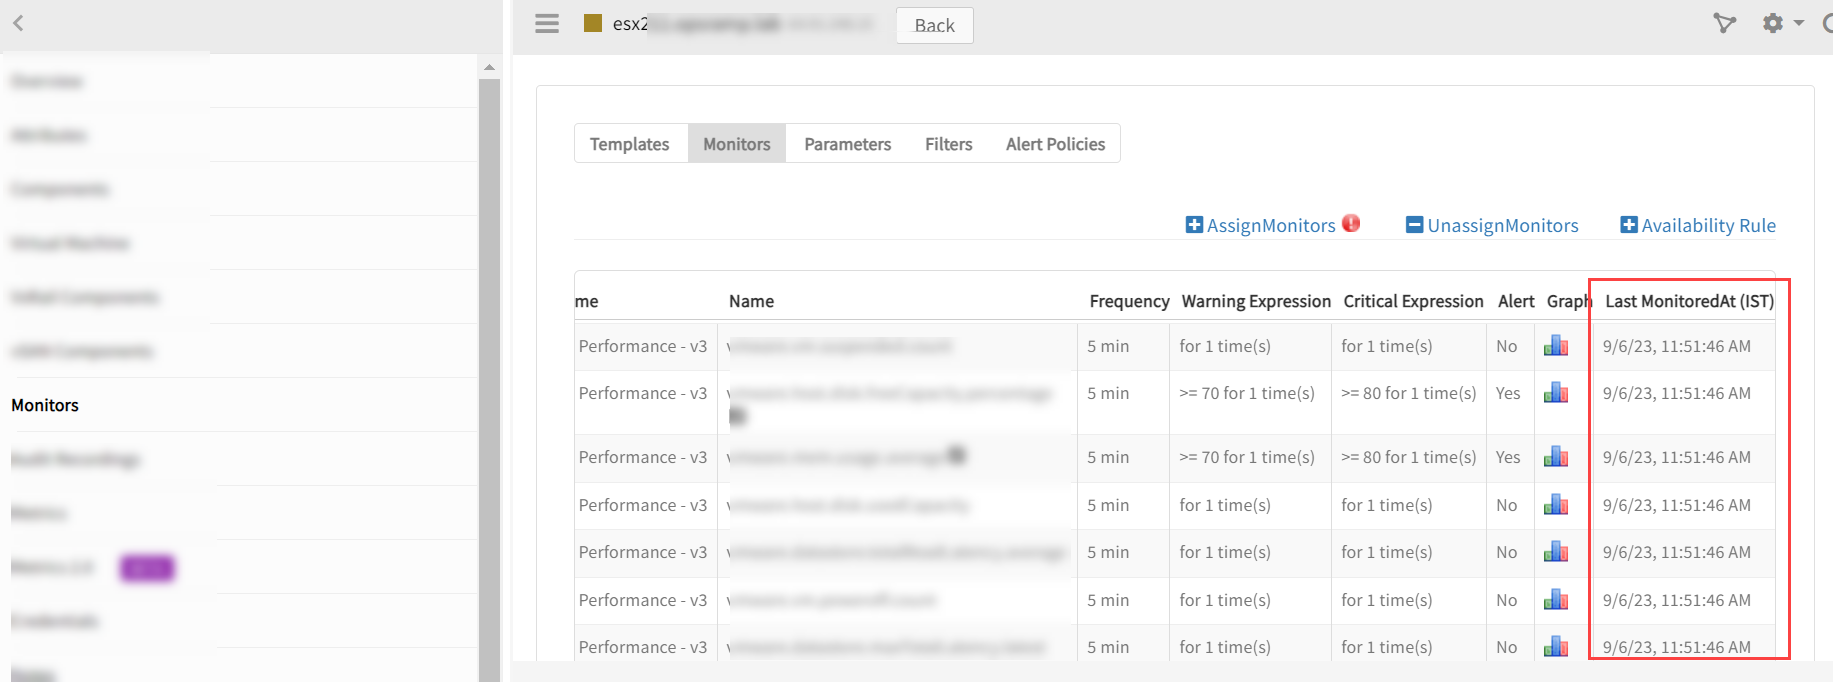
Resources → Monitors → Monitors tab: Navigate to Infrastructure → Resources → Monitors → Monitors tab to view Last Monitored At (IST) values.
VMware resources: Navigate to Infrastructure → VMware → vCenter → Compute → Datacenter → Cluster → Host → Monitors → Monitors tab to view the last monitored time for the VMware host.
Uptime
When an Uptime monitor is applied to a resource, the system.uptime metric data from the past one week is retrieved.
The resource overview screen displays values based on the following scenarios:
| Callout | Scenario/Description | Value |
|---|---|---|
| 2 | Data exists within the past one week. | The value displays in Days, Hours, Minutes, and Seconds format. Example: 151 days 6h 49m 55s |
| Data does not exist. | Data not available for more than one week | |
| Resource does not have an UPTIME monitor applied. | No data available |
Monitored components
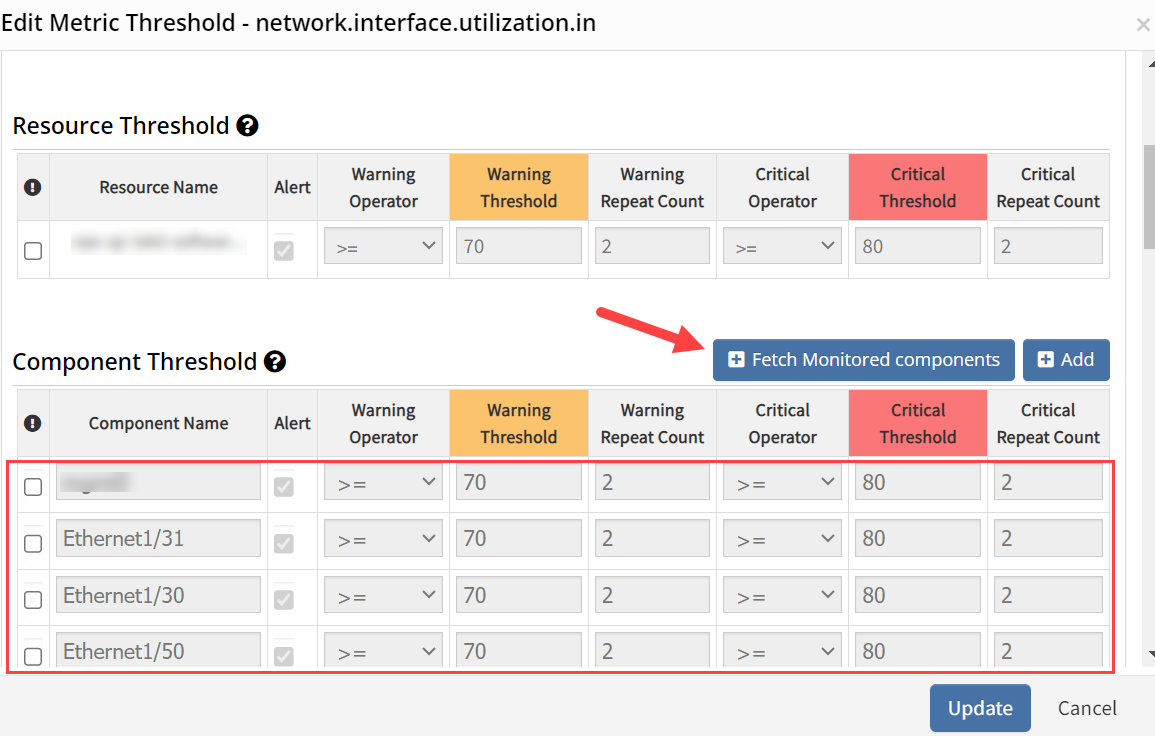
To retrieve live monitored components for the past one week, navigate to Infrastructure → Resources → Monitors → Monitors tab, then select Edit Metric Custom Notifications and Thresholds. In the Component Threshold category, click Fetch Monitored Components.
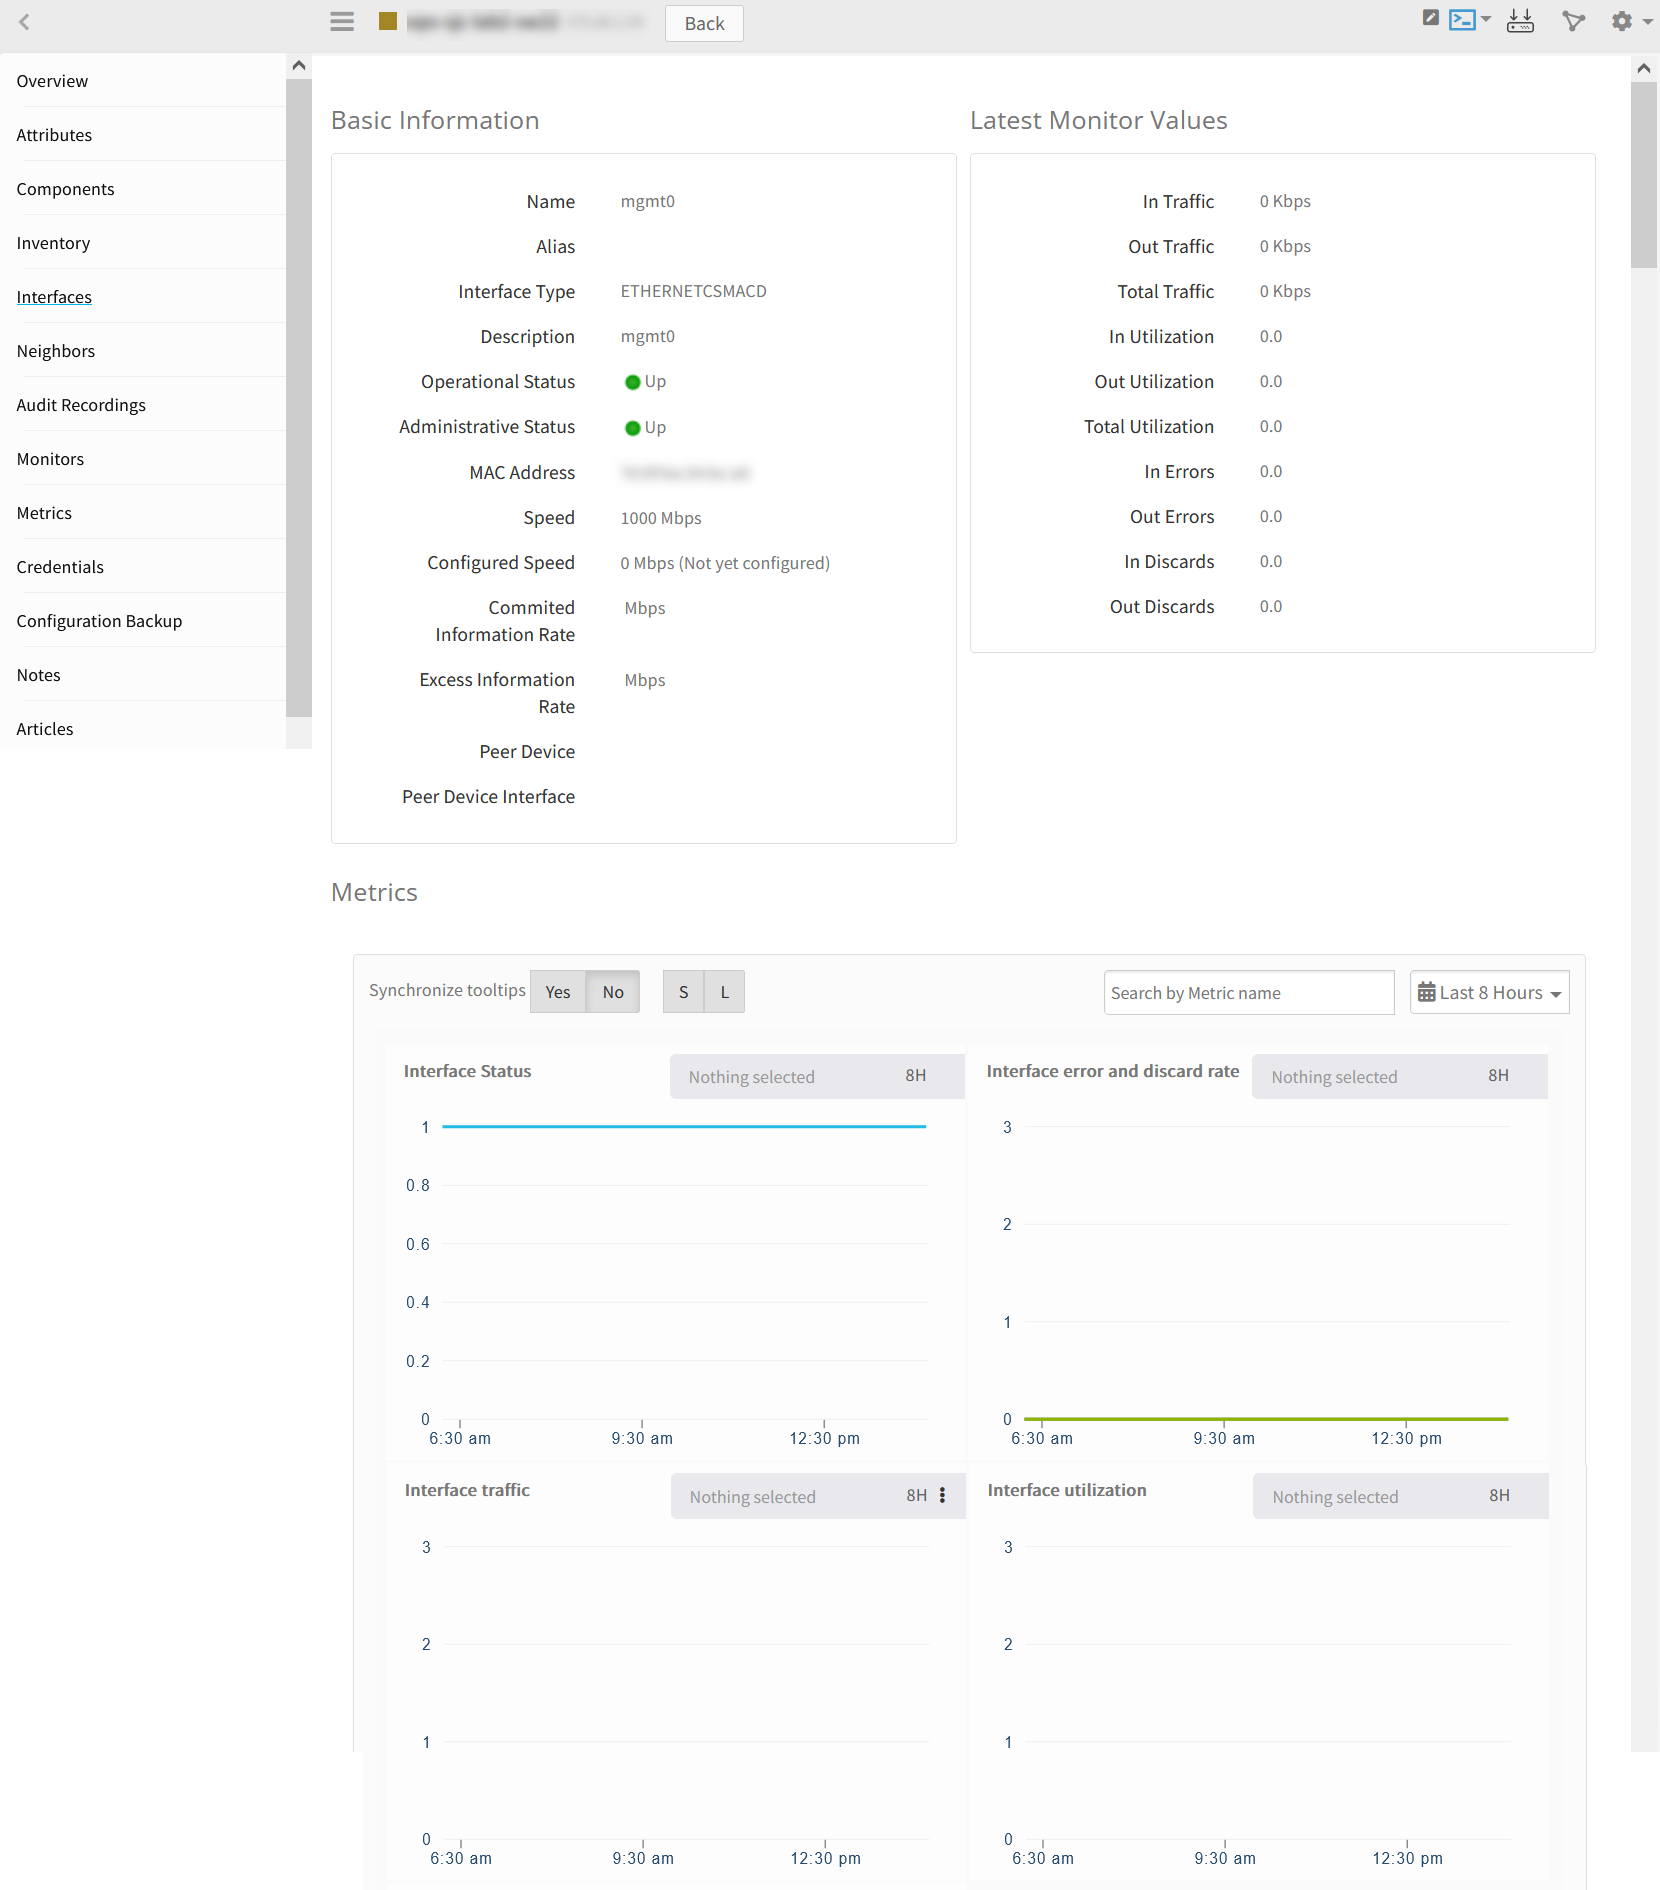
Interface graphs
Interface graphs display component metric data from the past one week only.
Navigate to Infrastructure → Network Device → Interfaces → interface name.