Using Custom Reports, you can:
- Design spreadsheet-style reports for Inventory, Metrics, Alerts, and Cloud Cost.
- Schedule reports at a specific time.
- Share reports with others in the organization.
- Organize reports easily in a folder.
- Provide various graphical representations of the data.
Create a custom report
Before you create a custom report, create a folder. You can store and organize your custom reports in a folder.
Step 1: Create a folder
- From the left pane of Reports, click Custom > Created by me.
- Click +.
- Click Add Folder.
- From Create New Folder, enter the name for the folder in the Name field and click Submit. A new folder is created under Created by me section.
After creating a folder, you can manage the folder by using the edit and delete options.
- Created by me - View the reports created by you in a folder.
- Shared with me - View the reports shared with you by other users.
Step 2: Setup your rules
When creating a custom report, the folder and report type must be specifed.
Prerequisite: Create a folder to store the reports before creating a custom report.
To select the folder and resource type:
Go to Reports > Custom, select a folder to store the reports.
Click NEW.
From the Custom Rules page, enter:
Name: (Required) Unique name for the current report.
Shared: Select the checkbox if you want to share the folder information with other users.
Folder: (Required) Folder to store the report.
Report Type: Following schedule options to generate the report.
- On Demand Only: A report is generated when you want.
- On Demand and on Recurring Schedule: A report is generated when you want and also according to the time schedule you define.
If you have selected On Demand and on Recurring Schedule, provide details for the following parameters:
Starts At (in Hours and Minutes): Time in hours and minutes to schedule and generate the reports.
Repeats: One of the following three options to schedule recurring generation of reports:
- Daily: Generate a report after 24 hours.
- Weekly – Generate a report every week.
- Monthly – Generate a report once after a month.
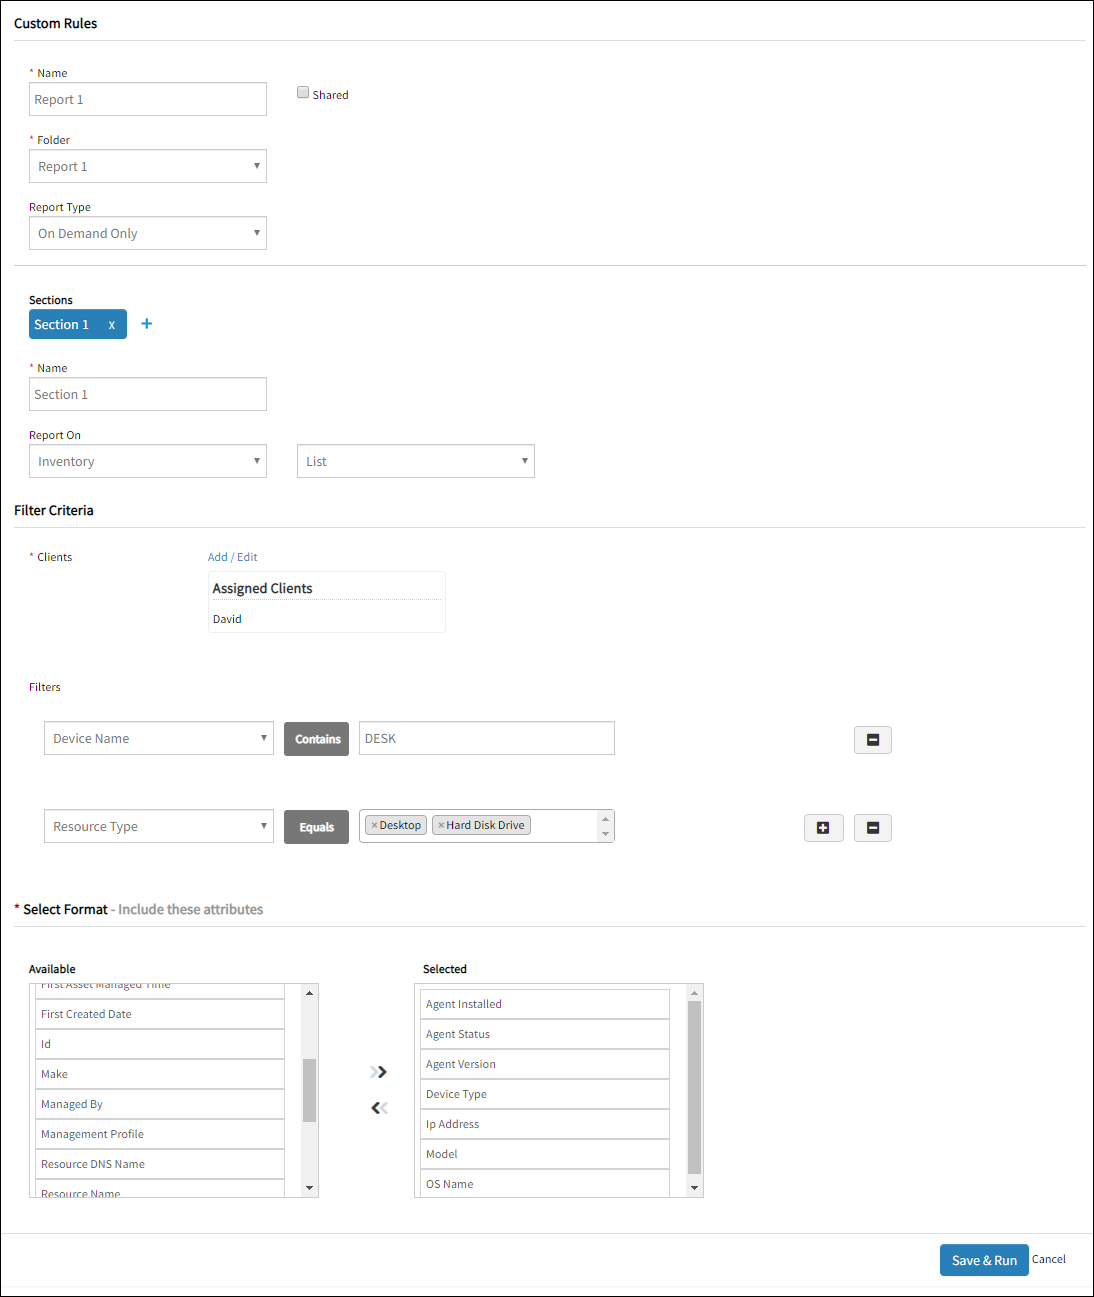
Create an inventory report
The inventory report displays resource details, including resource name and resource type, for a selected client.
After selecting the Folder and Report Type, provide details for the following parameters and click Save & Run.
Go to Reports > Custom, select a folder to store the reports.
- You can segregate the data for each type of report into sections in a single report.
- Click + to add more sections.
Click NEW, provide folder and report type.
In the Sections area, provide details for the following parameters:
Name: (Required) Section name of the current report.
Report On: Select Inventory from the drop-down menu.
From the options in the drop-down menu, select a display format (list or break down).
- List: Details displayed in a spreadsheet as a list.
- Break Down: Details displayed in a spreadsheet as a graphical format. Now, enter details for Filter Criteria. You can filter the data displayed for each section in the report corresponding to the clients and devices in the Filter Criteria.
From the Filter Criteria, provide details for the following parameters:
For Clients (Required), click Add/Edit.
From Select Clients, select the number of clients from the Available Clients section. The Assigned Clients section displays the selected clients.
Click Submit. Assigned Clients appear in the Clients section.
From the options in the Filters drop-down menu, select the filters.
- Click + to add more filters.
- Click – to remove filters. Now, you need to select a format. You can select the format to display the contents in the report, corresponding to the data selected in Select Format.
From the Select Format, provide details for the following step:
If you have selected List as an option to view, from the Available section, select the available device properties. For example, if you select Web Services Type as attribute, in generated report, when the Resource Type column displays Web Services, the Web Services Type column displays the related Synthetic resource types (such as HTTP, URL, DNS, Eaiml, Imap, Ipop).
If you have selected Break Down as an option to view, do the following steps:
a. From the options in the Breakdown Column drop-down menu, select the device properties for a device. b. From the Visualization section, select the graph to display the attributes selected in the Breakdown Column, in a report. You can choose one of the following visualizations available for Inventory custom report:
  - Bar Chart with Table
  - Column Chart with Table
  - Table Only
  - Pie Chart with Table
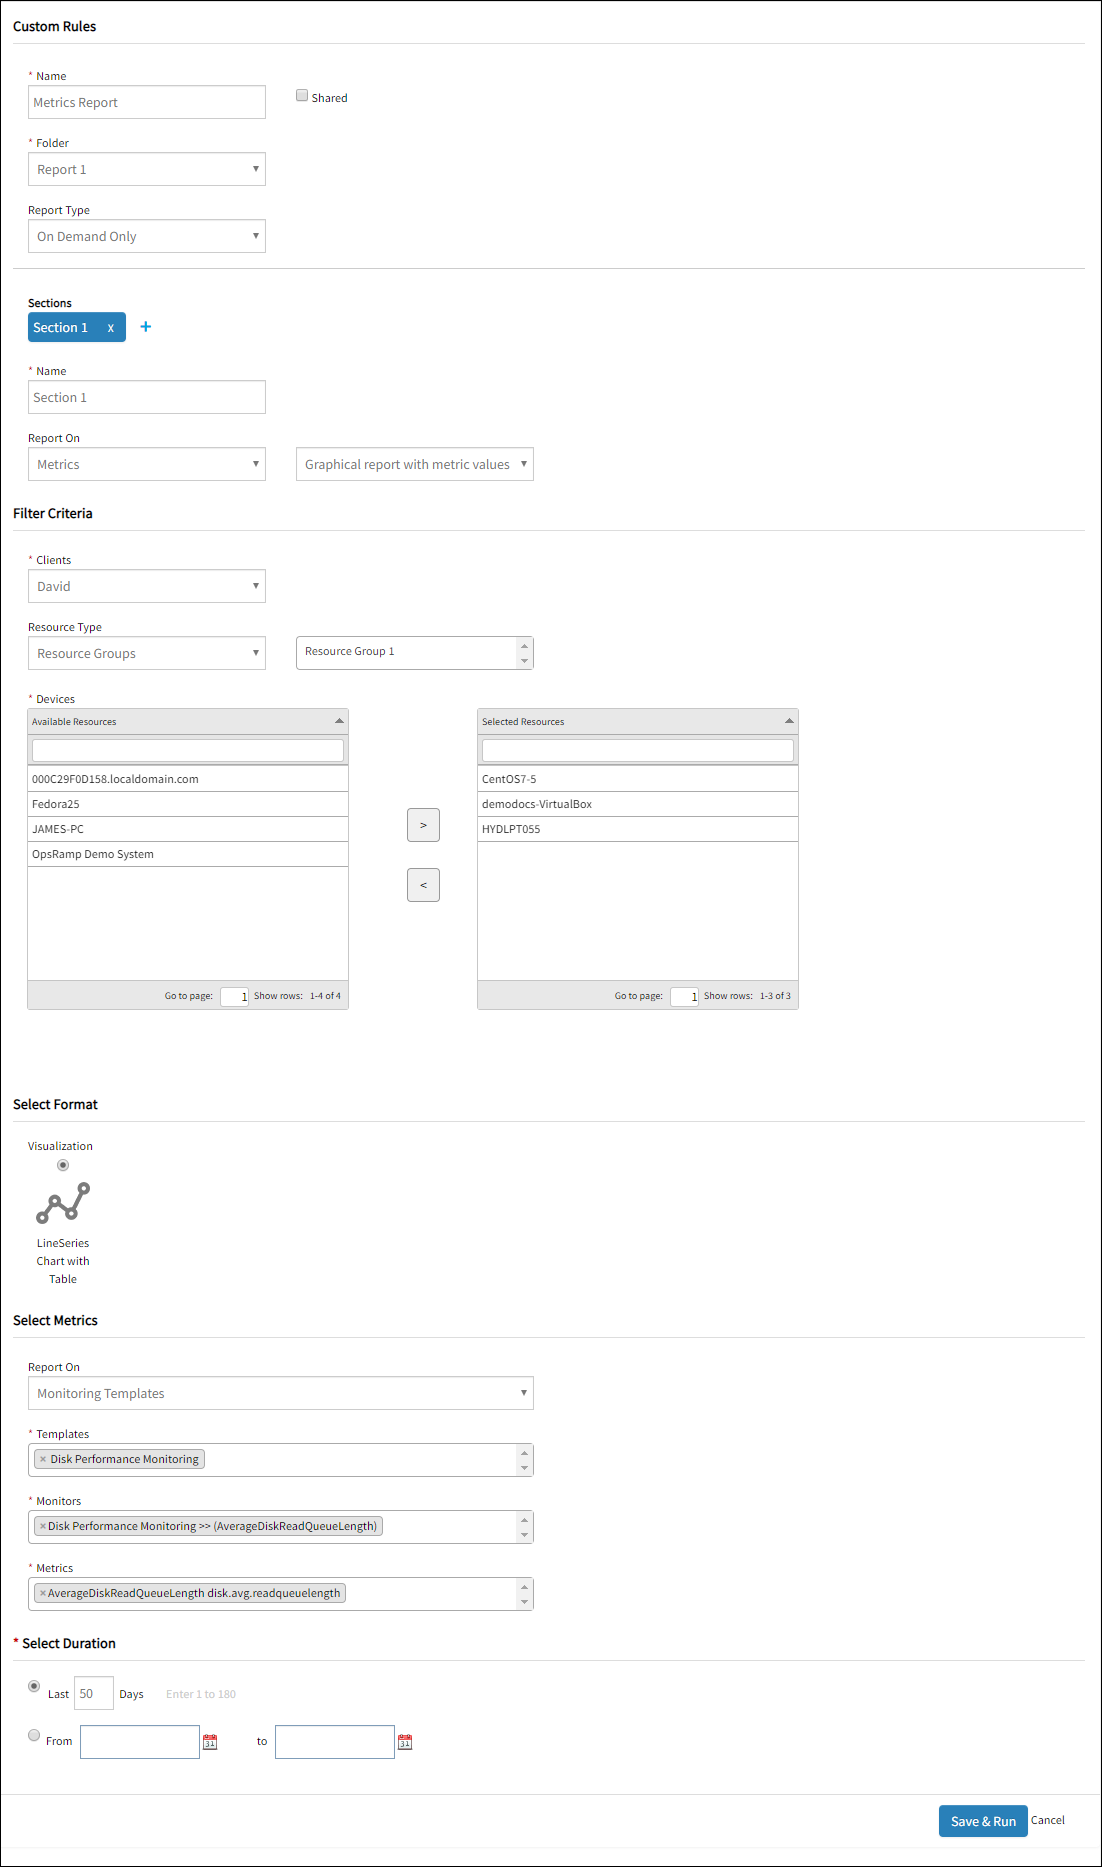
Create a metrics report
The metrics report displays the available and applied metrics for any device depending on the resource name and device type. At the same time, you can view the recent data posted by a device for a specific metric.
After selecting the Folder and Report Type, provide details for the following parameters and click Save & Run.
Go to Reports > Custom, select a folder to store the reports.
- You can segregate the data for each type of report into sections in a single report.
- Click + to add more sections.
Click NEW, provide folder and report type and in the Sections area, enter:
Name: (Required) Section name of the current report.
Report On: Select Metric from the drop-down menu.
From the options in the drop-down menu, select one of the options:
- Metric Values only: Displays details in a spreadsheet as a list.
- Graphical report with metric values: Displays details in a spreadsheet as a graphical format.
After providing the details in the Sections, navigate to Filter Criteria.
- You can filter the data displayed for each section of the report corresponding to the clients and resource types in Filter Criteria.
- The options displayed in Filter Criteria varies for the option selected to display the details in the spreadsheet.
From Filter Criteria, provide details for the following parameters:
From the options in Clients drop-down menu, select the client.
From the options displayed, select one of the following options:
- By Resources
- By Filters
If you have selected By Resources, provide details for the following parameters:
From the options in the Resource Type drop-down menu, select one of the following options:
- Device Type: Available device types.
- Resource Groups: List of available resource groups.
- Site: List of devices configured in the Site section.
From the Devices section, select Available Resources.
If you have selected By Filters, enter the filter details.
- Click + to add more filters.
- Click – to remove filters.
After providing the details in the Filter Criteria, navigate to Select Format.
From Select Format, select LineSeries Chart with Table in Visualization.
After providing details in Select Format, navigate to Select Metrics.
From Select Metrics, provide details for the following parameters:
- If you have selected Metric Values only, you can select up to five Template, Monitor and Metric values.
- If you have selected Graphical Report with metric values, you can select only one Template, one Monitor and one Metric.
From the options in the Report On the drop-down menu, select one of the following options:
- Monitoring Templates
- Monitors
- Web Services
If you have selected Monitoring Templates, provide details for the following parameters:
- Templates: Displays the list of templates corresponding to the selected client.
- Monitors: Displays the list of monitors corresponding to the selected Templates.
- Metrics: Displays the metrics corresponding to the selected monitors.
If you have selected Monitors, provide details for the following parameters:
- Monitors: Displays the list of monitors applied on the devices.
- Metrics: Displays the metrics corresponding to the selected monitors.
If you have selected Web Services, provide details for the following parameters:
- Monitors: Displays the list of monitors applied to web services.
- Metrics: Displays the metrics corresponding to the selected web service monitors.
After selecting the attributes in Select Metrics, navigate to Select Duration.
From Select Duration, select one of the options:
- Last Days Enter a value between 1 and 180. You can generate a report according to the value mentioned in the Last Days.
- From and To You can generate a report in a time frame after specifying the From and To date and time.
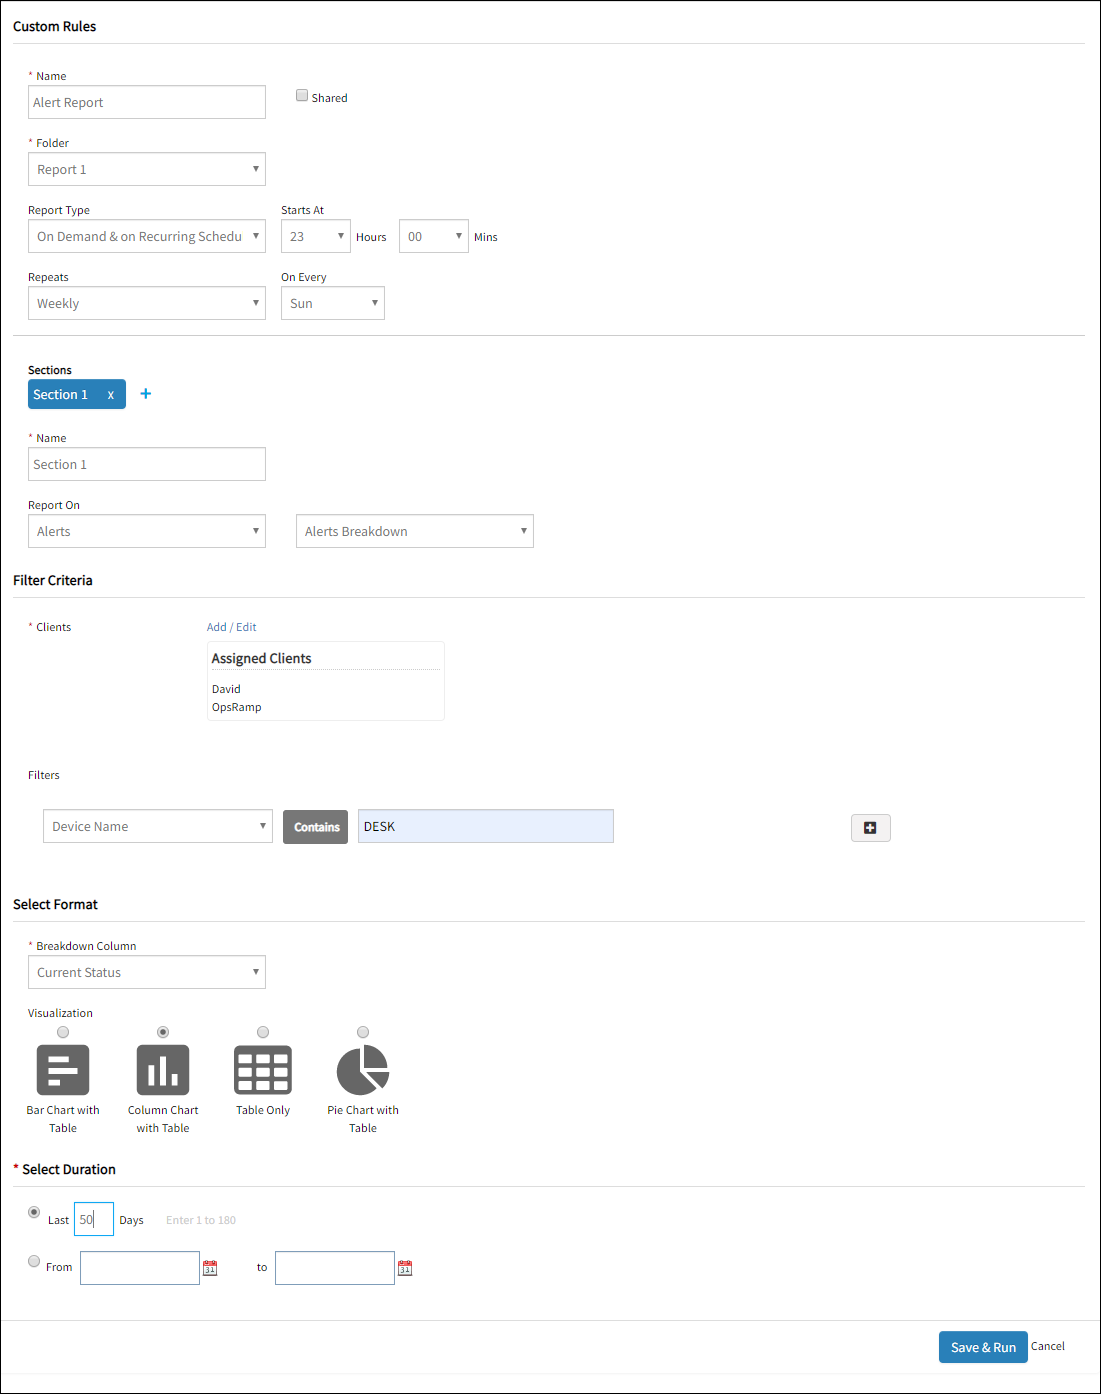
Create an alert report
The alerts report displays the details regarding the alerts generated in the application.
After selecting the Folder and Report Type, provide details for the following parameters and click Save & Run.
Go to Reports > Custom, select a folder to store the reports.
- You can segregate the data for each type of report into sections in a single report.
- Click + to add more sections.
Click NEW, provide folder and report type and in the Sections area, enter:
Name: (Required) Section name of the current report.
Report On: Select Alerts from the drop-down menu.
From the options in the drop-down menu, select one of the options:
- Alerts List: Lists all the details in an excel sheet.
- Alerts Breakdown: Data displayed in a graphical format in an excel sheet. You can determine the display format using the List and Break Down options.
After providing the details in the Sections, navigate to Filter Criteria. You can filter the data displayed for each section in the report corresponding to the clients, alerts, and devices in the Filter Criteria.
From the Filter Criteria, provide details for the following parameters:
For Clients (Required), click Add/Edit.
From Select Clients screen, select clients from Available Clients section.
Click Submit.
From the options in Filters drop-down menu, select the filters.
- Click + to add more filters.
- Click – to remove filters.
After providing the details in the Filter Criteria, navigate to Select Format. You can select the display format for the contents in the report corresponding to the data selected in Select Format.
From Select Format, provide details for the following parameters:
- If you have selected Alerts List as an option to view, do the following step:
From the Available section, select the available alert properties. Selected attributes appear in the Selected section. - If you have selected Alerts Breakdown as an option to view, do the following step:
From the options in the Breakdown Column drop-down menu, select the device properties for a device.
- If you have selected Alerts List as an option to view, do the following step:
After selecting attributes in Select Format, navigate to Select Duration.
From Select Duration, select one of the options:
- Last Days: Enter a value between 1 and 180. You can generate a report according to the value mentioned in the Last Days.
- From and To: You can generate a report in a time frame after specifying the From and To date and time.
From the Visualization section, select the graph to display the attributes selected in the Breakdown Column, in a report. You can choose one of the following visualizations available for Alerts custom report:
- Bar Chart with Table
- Column Chart with Table
- Table Only
- Pie Chart with Table
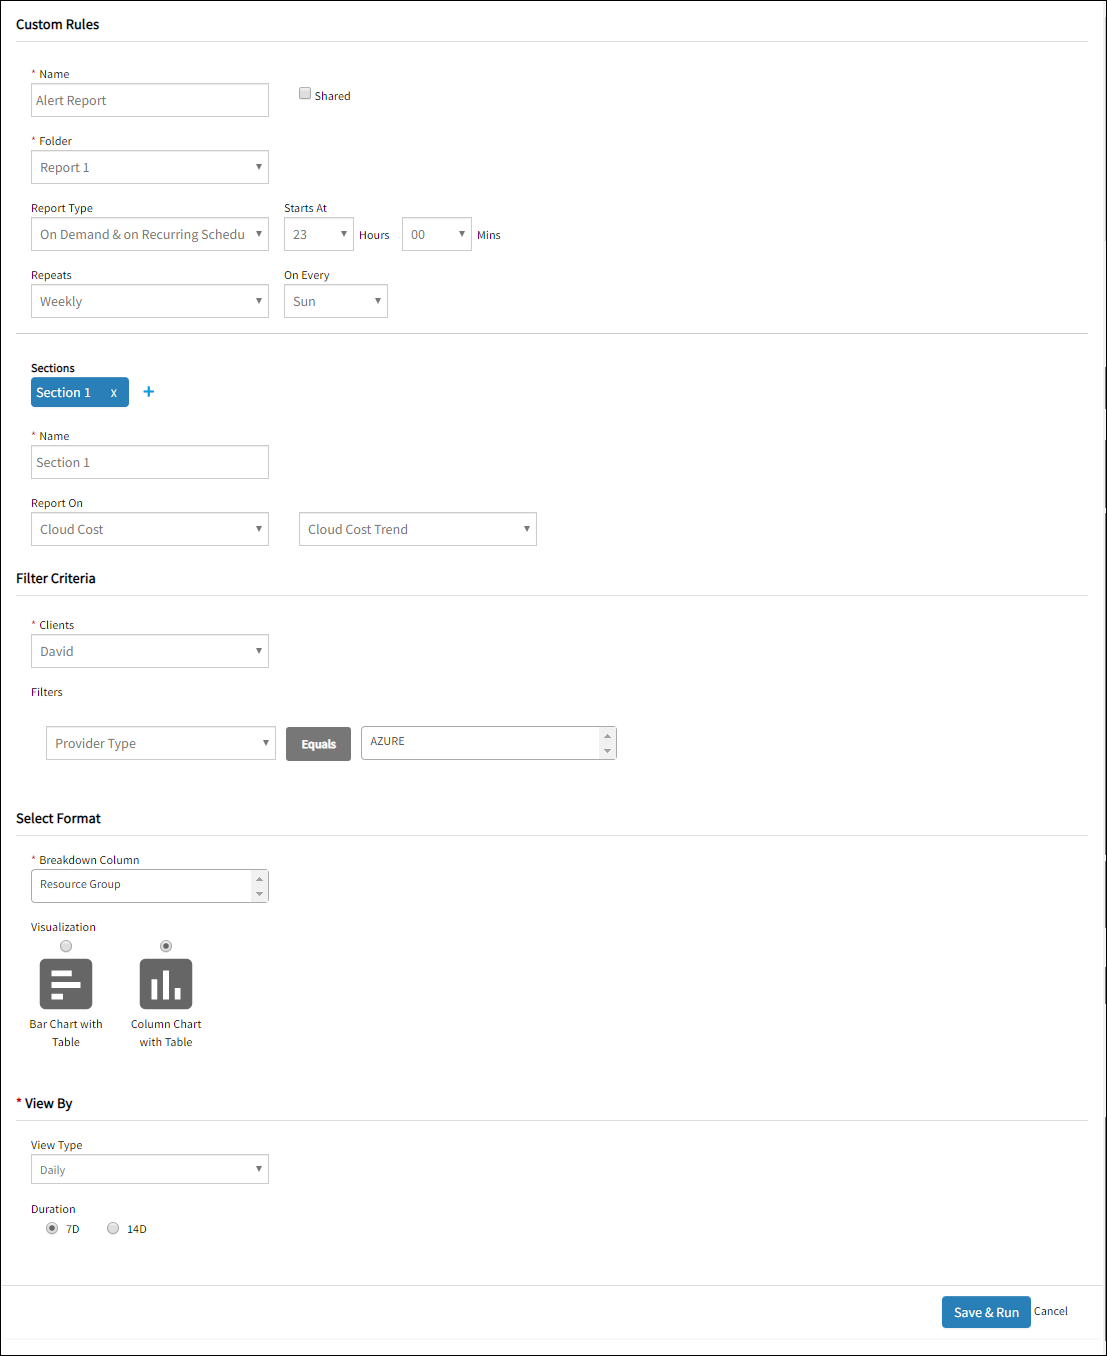
Create a cloud cost report
The Cloud cost report displays the details of the cost incurred for your usage of each cloud device and the trend of the cloud cost incurred.
After selecting the Folder and Report Type, provide details for the following parameters and click Save & Run.
Go to Reports > Custom, select a folder to store the reports.
- You can segregate the data for each type of report into sections in a single report.
- Click + to add more sections.
Click NEW, provide folder and report type and in the Sections area, enter:
Name: (Required) Enter the section name of the current report.
Report On: Select Cloud Cost from the drop-down menu.
From the options in the drop-down menu, select a cloud cost option. Cloud Cost Insights and Cloud Cost Trend allow you to choose the time frame in which you want to display the contents in the report.
- Cloud Cost Insights: Lists all the details in an excel sheet.
- Cloud Cost Trend: Displays data in a graphical format in an excel sheet.
After providing the details in the Sections, navigate to Filter Criteria. You can filter the data displayed for each section in the report corresponding to the Provider Type like Google, Azure, and AWS or Cloud Account.
From the Filter Criteria, provide details for the following parameters:
- From the options in the Clients (Required) drop-down menu, select the client.
- From the options in the Filters drop-down menu, select the filters.
After selecting the Filter Criteria, navigate to Select Format. You can select the display format for the contents in the report, corresponding to the data selected in Filter Criteria and Select Format. From the Select Format, provide details for the Breakdown Column. Select the device properties for a device.
If you have selected Cloud Cost Insights as an option to view, do the following step: From the options in Custom Duration drop-down, select the time frame.
If you have selected Cloud Cost Trend as an option to view, do the following step:
From the options in the View Type drop-down menu in View By section, select one of the following options.
- Daily – View reports on a daily basis.
- Monthly – View reports on a monthly basis.
- Yearly – View reports on a yearly basis.
From the options in the Duration menu, select one of the following options:
- 7D – Displays details for the past seven days to date.
- 14D – Displays details for the past 14 days to date.
From the Visualization section, select the type of design to display the attributes selected in the Breakdown Column, in a report. You can choose one of the following visualizations available for Cloud Cost custom report:
- Bar Chart with Table
- Column Chart with Table
View a custom report
You can view the created reports from Custom > All pages. The Custom Reports display the following information as displayed in the table below.
| Attribute | Description |
|---|---|
| Schedule Name | Name of the report. |
| Last Run | The time and date of the recently generated reports. |
| Created By | Author of the report. |
| Action | To generate a report. The Run Now action is available only for reports with On Demand Only option. |
| Status | Displays the status of the report. A report can appear in one of the below four states.
|
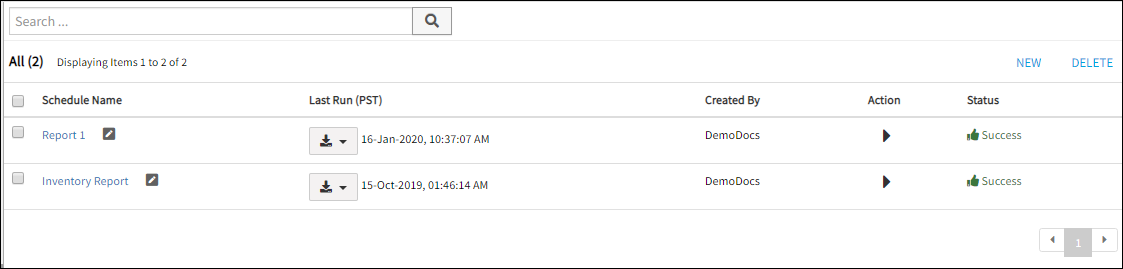
Click the download icon in the Last Run column to generate and access the latest report.
Click Run Now icon under Actions to generate the latest report with On Demand Only Report Type.
Edit a custom report
The edit functionality allows you to change the existing details of a custom report.
- From the left pane of Reports, click Custom. All configured custom reports are displayed.
- Click the Edit icon for a report in the Schedule Name column. The Custom Rules page for the selected custom report is displayed.
- Make the changes to the current details as needed.
- Click Save & Run.
Delete a custom report
You can remove existing custom reports from the Custom Reports page.
- From the left pane of Reports, click Custom. All configured custom reports are displayed.
- Select the report from the list of reports.
- Click DELETE. A confirmation message is displayed.
- Click Yes to continue.