Introduction
The Netflow Insights Reporting App provides valuable insights into network data trends and traffic patterns. It enables you to better understand your network’s behavior and make informed decisions to improve efficiency and resource allocation. It offers:
- Data Flow Visualization: Visualizes the flow of data between source and destination points, helping you understand network traffic patterns.
Configuration Parameters
- Client Selection: Select a single client from the dropdown list. Only data for the selected client will be included in the report.
- Select View Type: Determines the output type of the top trends, either in Bytes or Packets traffic.
- Select Category: Select a category of information to be displayed in the report. The report can support one category at a time. Selected Category data is only listed in the PDF or XLSX report.
- Select Device: Select a device from the dropdown.
- Select GroupBy: Organize the NetFlow Data by the selected grouping criteria.
- Supported Analysis Period: The time period over which your environment was analyzed. Supported analysis periods are: Last Hour, Last 4 Hours, Last 8 Hours, Last 24 Hours, Last 7 Days, Last 15 Days, and Last Month.
Note
The analysis period duration should not exceed one month in the last 365 days. - Supported Formats: Reports are generated in PDF or XLSX format.
Reports Output
| Section | Description |
|---|---|
| Summary | This section includes the configuration details of the app. |
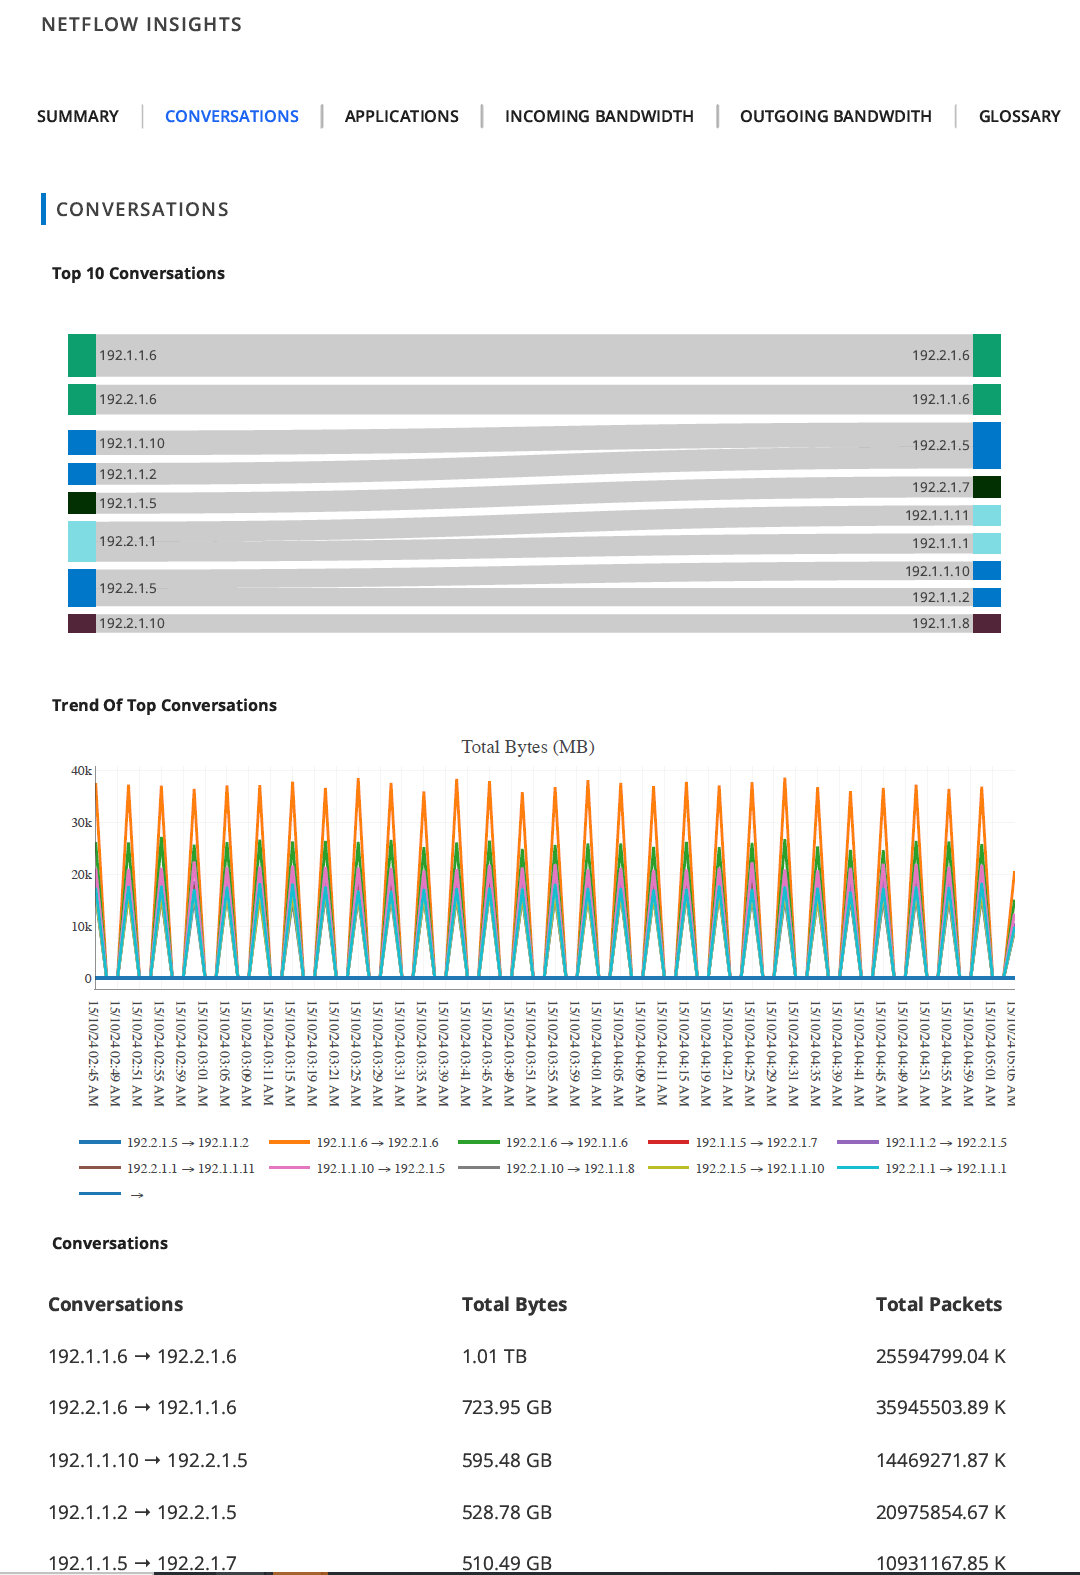
| Top 10 Conversations | Displays the top 10 conversations, detailing the total number of packets and bytes exchanged between source and destination endpoints. |
| Conversations | Details of the total number of packets and bytes exchanged between the source and destination endpoints for the top 10 conversations. |
| Trends of Top 10 Conversations | Visualizes the trends of top 10 conversations between source and destination end points over the period. |
| Top Daily Conversation | Details of the top daily conversation between source and destination endpoints, including total packets/bytes and the percentage of data exchanged. |
| Top 10 Applications | Visualizes the top 10 applications consuming the most network resources in a Sankey graph. |
| Trends of Top 10 Applications | Visualizes the trends of top 10 applications consuming the most network resources over the period. |
| Applications | Details of the total number of packets and bytes consumed by the top 10 applications. |
| Top 10 Incoming Bandwith Utilization | Visualizes the top 10 network incoming bandwidth utilization over the period. |
| Bottom 10 Incoming Bandwidth Utilization | Visualizes the bottom 10 network incoming bandwidth utilization over the period. |
| Top 10 Outgoing Bandwidth Utilization | Visualizes the top 10 network outgoing bandwidth utilization over the period. |
| Bottom 10 Outgoing Bandwidth Utilization | Visualizes the bottom 10 network outgoing bandwidth utilization over the period. |
| Top 10 Source End Points | Displays the source endpoints that generated the highest volume of network traffic during the selected reporting period. |
| Trends of Top 10 Source End Points | Visualizes the trends of top 10 source endpoints that generated the highest volume of network traffic during the selected reporting period. |
| Top 10 Destination End Points | Displays the destination endpoints that received the highest volume of network traffic during the selected reporting period. |
| Trends of Top 10 Destination End Points | Visualizes the trends of top 10 destination endpoints that received the highest volume of network traffic during the selected reporting period. |
| Top 10 Protocols | Displays the network protocols responsible for the highest percentage of traffic observed during the selected reporting period. |
| Trends of Top 10 Protocols | Visualizes the trends of top 10 network protocols responsible for the highest percentage of traffic observed during the selected reporting period. |
| Glossary | This section contains detailed explanations of each report section, helping you better understand the generated data and its significance. |
Sample of Netflow Insights app reports in PDF format: