Introduction
The Monitor Details app provides you an overview of monitoring configurations against the customer environment. At the resource level, users can view the configured metrics and monitoring threshold configurations.
Configuration Parameters
- Add Query: Use the query to select the entities that you wish to include in the report.
- Default query: The default query
( state = "active" AND monitorable = "true")will be populated by default when open monitor details app. Users are able to modify/delete the default query and run his specific query. - Using an OpsQL query, you can customize the report result. If users did not select
stateandmonitorableattributes in the query string, the user selection query would be appended by default withstateandmonitorableattributes.
For example, if a user only selects theagentInstalledattribute, the query will automatically appendstate = ‘active’ AND monitorable = true
The query will look like the following:(agentInstalled = "true") AND state = 'active' AND monitorable = true
- Default query: The default query
- Client Selection: You can select Single Client, Multi Clients, or All Clients from the dropdown list. Only selected client data will get into the report.
- The Select Clients dropdown allows you to choose up to 50 clients
- When Multi-Client is selected, the Share and Notifications settings on analysis will follow the same behavior as the All Clients option.
- Attributes Selection: Specify the attributes of the selected entities that you wish to include as columns in the report.
- Default attributes: The default attributes (Resource Id, IP Address, Resource Name, Template Name, Monitor Name, and Metric Name) will be populated by default. The user can modify/delete default attributes and select their required attributes, including custom attributes to view in the report.
- Only selected attributes related data will be included in the report. If no attributes are selected, the default attributes data will be included in the report. The user can select a maximum of 25 attributes.
- You can customize the default attributes selection order by using the drag and drop functionality.
- Supported Formats: Reports can be downloaded in XLSX and CSV formats.
Reports Output
- Summary: This section provides the configuration details.
- Details: This section provides you the list of resources along with their Monitoring details.
- Glossary: This section contains detailed information about each section present in the report tab, helping you to understand the generated data better.
Sample of Monitor Details app reports in XLSX format: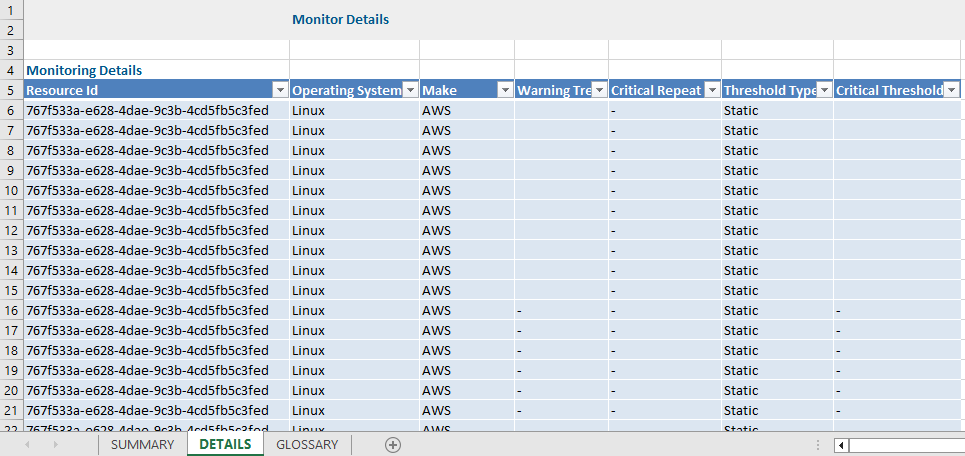
Monitor Details Report Vs Monitor Details
Click here to view the supported attributes
| Monitor Details Report | Monitor Details | |
|---|---|---|
| UI Atrributes Selection | Display Format In Report | |
| Alert | Alert | Alert |
| Client Name | Client Name | Client Name |
| Collector Type | Collector Type | Collector Type |
| Critical Threshold | Critical Threshold | Critical Threshold |
| Device ID | Resource Id | Resource Id |
| Device IP Address | IP Address | IP Address |
| Device Name | Resource Name | Resource Name |
| Device Path | Resource Type Path | Resource Type Path |
| Device Status | Availability State | Availability State |
| Device Type | Resource Type | Resource Type |
| Frequency | Frequency | Frequency |
| Instance Id | Instance Id | Instance Id |
| Make | Make | Make |
| Metric Name | Metric Name | Metric Name |
| Model | Model | Model |
| Monitor Name | Monitor Name | Monitor Name |
| Operating System Name | Os | Os |
| Scope | Scope | Scope |
| Status | State | State |
| Template Description | Template Description | Template Description |
| Template Name | Template Name | Template Name |
| Warning Threshold | Warning Threshold | Warning Threshold |
| Admin Status | Admin Status | Admin Status |
| Instance Name | Instance Name | Instance Name |
| Interface Alias Name | Interface Alias Name | Interface Alias Name |
| Interface Description | Interface Description | Interface Description |
| Interface Name | Interface Name | Interface Name |
| Last Response Time | Last Respponse Time | Last Respponse Time |
| Last Response Value | Last Respponse Value | Last Respponse Value |
| Network Name | N/A | N/A |
| Operational Status | Operational Status | Operational Status |
| Partner Name | Partner Name | Partner Name |
| Prerequisites | N/A | N/A |
| Profile Name | ProfileName | ProfileName |
| Profile Type | N/A | N/A |
| SMI-S Credential Set Name | N/A | N/A |
| SNMP Credential Set Name | N/A | N/A |
| System OID of Device | N/A | N/A |
| Uses Proxy | N/A | N/A |
| WMI Credential Set Name | N/A | N/A |
| N/A | Agent Installed | Agent Installed |
| N/A | Agent Version | Agent Version |
| N/A | Tag Name | Tag Name |
| N/A | Tag Value | Tag Value |
| N/A | Critical Repeat Count | Critical Repeat Count |
| N/A | Critical Operator | Critical Operator |
| N/A | Warning Operator | Warning Operator |
| N/A | Warning Repeat Count | Warning Repeat Count |
| N/A | Level Type | Level Type |
| N/A | Template Status | Template Status |
| N/A | Threshold Type | Threshold Type |
| N/A | Availability | Availability |
| N/A | Generation | Generation |
| N/A | Cloud Instance State | Cloud Instance State |
| N/A | Location | Resource Location |
| N/A | Device Groups Name | Device Groups Name (Resource Group) |
| N/A | Last Updated | Last Updated (Scan Date) |
| N/A | Created Source | Created Source |
| N/A | First Created Date | First Created Date |
| N/A | Log File Configurations | Log File Configurations |
| N/A | Service Names | Service Names |
| N/A | Process Names | Process Names |
| N/A | Proxy Name | Proxy Name |