Introduction
The Availability Details application will provide you with a summary of the availability or detailed outages of resources, service groups, and synthetics over a certain time period.
Configuration Parameters
- Query: Use the query to select the entities that you wish to include in the report.
- Default query: The default query
{state=active and monitorable=true}will be populated by default when an asset inventory app opens. The user can modify/delete the default query and run a custom query. - Using an OpsQL query, you can customize the report result. If users did not select
stateandmonitorableattributes in the query string, in that case the user selection query would be appended by default withstateandmonitorableattributes.
For example, if a user only selects theagentInstalledattribute, the query will automatically show asappend state = 'active' AND monitorable = true
The query will appear as follows:state = "active" AND monitorable = "true" AND (agentInstalled = "xxxxxx")
- Default query: The default query
- Client Selection: You can select Single Client, Multi Clients, or All Clients from the dropdown list. Only selected client data will get into the report.
- The Select Clients dropdown allows you to choose up to 50 clients
- When Multi-Client is selected, the Share and Notifications settings on analysis will follow the same behavior as the All Clients option.
- Availability By: Defines the availability to be presented by resource, service group, or synthetic script.
- Resource: View availability at the resource level.
- Inlcude Insights: Select this checkbox to include insights in the report. When this option is selected, Select Availability State will no longer be available
- Exclude Schedule Maintenance Time: Select this checkbox to exclude scheduled maintenance windows in the report. Selecting this option will recalculate the availability percentage without the duration of the scheduled maintenance.
- Include Deleted Resources: Select this checkbox to include deleted resources in the report.
- Service Group: View availability at the service group level.
- Synthetic Script Availability: Analyze the availability, breaches, and errors as a percentage for each transaction and location within synthetic resources.
- Resource: View availability at the resource level.
- Select Availability State: View availability based on the state. The options are Up, Down, Unknown, or Undefined. This selection is optional. If nothing is selected, it will default to Down time.
- Time Duration: Select the time period over which your environment down time was analyzed.
- Supported Analysis Period: Supported analysis periods are: Last 24 hours, 7 days, Last month, Last 3 months, and specific period.
- Included Hours: When analyzing data from Last 3 Days, Last 7 Days, or Last Month, users have the option to narrow down the analysis to specific hours. The options are 24 Hours Every Day, Same Time Every Day, Same Time Every Weekday, or Different Times Every Day. This selection is optional.
- Attributes Selection: Specify the attributes, including custom attribites, of the selected entities that you want to include as columns in the report. You can customize the order of default attribute by using drag and drop. You are allowed to select a maximum of 25 attributes.
- Supported Format: Reports are generated only in XLSX format.
Note
The Attributes and Tags fields will appear only when you choose Resource option in the Availability By field.Refer to the Resource Availability document to see how the Resource Availability State% works.
Excluding Scheduled Maintenance Time
When creating an Availability Report, a user may want to calculate resource availability by excluding a scheduled maintenance time from the availability calculation. In this mode, scheduled maintenance should not be counted as UP, DOWN, or UNKNOWN.
Instead, the maintenance duration should be removed from the denominator used to calculate availability percentages.
This allows the report to reflect only the effective service period — the time during which the resource was expected to be operational.
Excluding scheduled maintenance times enable customers to generate availability reports based only on in-scope operational time, so that planned maintenance does not improve or reduce the availability score.
This is useful for customers who define availability using net service time instead of total calendar time or total business time.
Note
When scheduled maintenance is excluded in reports, the report denominator changes. Because the UI availability bar continues to show the resource state over the full selected time range, the UI and report values may not match. In other words:
- UI Availability Bar: Shows availability across the full selected time range, based on the configured maintenance handling behavior.
- Availability Report With Maintenance Exclusion: Removes scheduled maintenance time from the calculation and recalculates percentages using only the remaining effective service time.
Example Calculation
Assume a 10-hour reporting window from 10:00 AM to 8:00 PM.
| Time Period | Duration | Resource State/Condition |
|---|---|---|
| 10:00 AM – 4:00 PM | 6 Hours | UP |
| 4:00 PM – 6:00 PM | 2 hours | DOWN |
| 6:00 PM – 7:00 PM | 1 Hour | UNKNOWN |
| 7:00 PM – 8:00 PM | 1 Hour | Scheduled Maintenance |
During the scheduled maintenance hour from 7:00 PM to 8:00 PM, the actual resource state is:
- 30 minutes UP
- 30 minutes DOWN
Scenario 1: Include Maintenance As-Is
Applicable Setting: Client-level maintenance setting: Default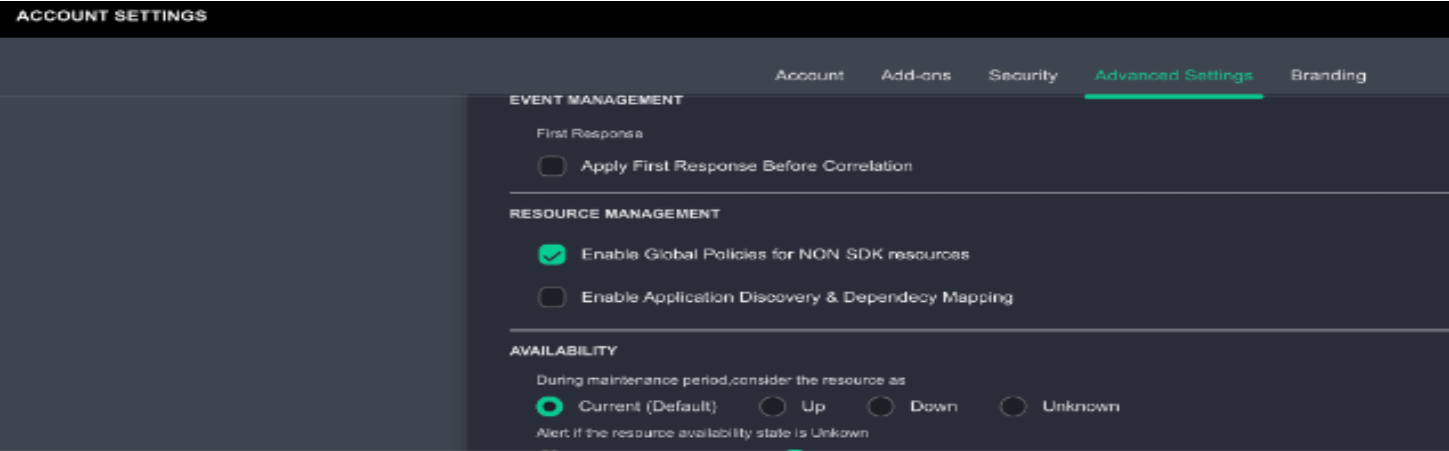
The maintenance hour is counted exactly as it occurred.
Therefore, the UP and DOWN states observed during the maintenance window are included in the calculation.
Denominator used for percentage calculation: 10 hours
| State | Calculation | Duration Used | Percentage |
|---|---|---|---|
| UP | 6 Hours + 30 Minutes | 6.5 Hours | 65.00% |
| DOWN | 2 hours + 30 Minutes | 2.5 Hours | 25.00% |
| UNKNOWN | 1 Hour | 1 Hour | 10.00% |
Result: UP = 65.00%, DOWN = 25.00%, UNKNOWN = 10.00%
UI/report behavior: UI and report values are expected to match when the report also includes maintenance as-is.
Scenario 2: Treat the Full Maintenance Window as UP
Applicable setting: Client-level maintenance setting: UP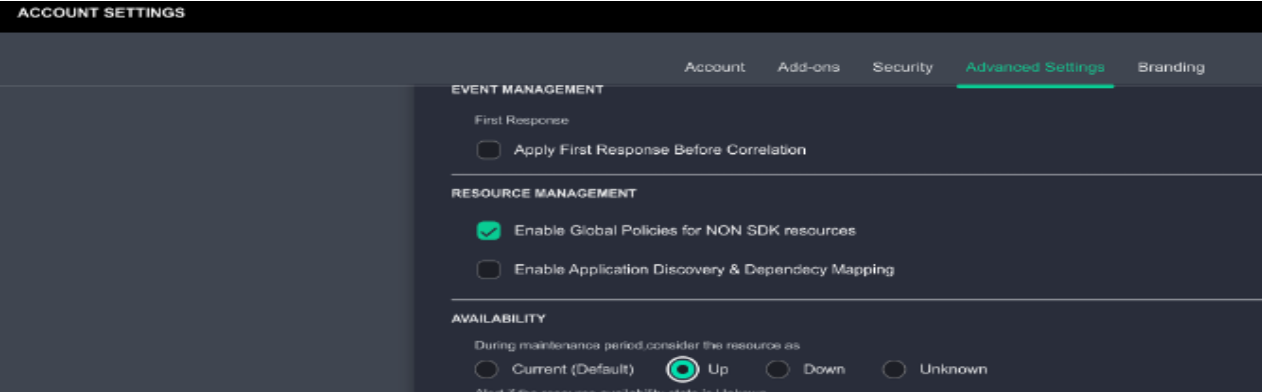
The entire scheduled maintenance hour is treated as UP, regardless of the actual resource state during that period.
Denominator used for percentage calculation: 10 hours
| State | Calculation | Duration Used | Percentage |
|---|---|---|---|
| UP | 6 Hours + 1 Hour | 7 Hours | 70.00% |
| DOWN | 2 Hours | 2 Hours | 20.00% |
| UNKNOWN | 1 Hour | 1 Hour | 10.00% |
Scenario 3: Exclude Scheduled Maintenance from the Report
Applicable setting: Report-level option: Exclude scheduled maintenance time.
The maintenance hour from 7:00 PM to 8:00 PM is removed from the calculation. The denominator changes from 10 hours to 9 hours.
Denominator used for percentage calculation: 9 hours
| State | Calculation | Duration Used | Percentage |
|---|---|---|---|
| UP | 6 Hours | 6 Hours | 66.67% |
| DOWN | 2 Hours | 2 Hours | 22.22% |
| UNKNOWN | 1 Hour | 1 Hour | 11.11% |
Result: UP = 66.67%, DOWN = 22.22%, UNKNOWN = 11.11%
UI/report behavior: The report values may not match the UI availability bar because the report excludes maintenance time, while the UI availability bar is based on the full selected time range and the client-level maintenance setting.
Final Results of Example
| Scenario | Maintenance Handling | Denominator | UP % | DOWN % | UNKNOWN % | Expected UI/Report Match? |
|---|---|---|---|---|---|---|
| Scenario 1 | Maintenance treated as-is. | 10 Hours | 65.00% | 25.00% | 10.00% | Yes, if report includes maintenance as-is. |
| Scenario 2 | Maintenance treated as UP. | 10 Hours | 70.00% | 20.00% | 10.00% | Yes, if report uses same behavior. |
| Scenario 3 | Maintenance excluded from report. | 9 Hours | 66.67% | 22.22% | 11.11% | No. Report denominator is different from UI. |
Scenario 1 Availability Bar

Scenario 2 Availability Bar

Scenario 3 Report

Why are the UI and Report Values Different?
OpsRamp continues to monitor resources during scheduled maintenance. Metrics can still be received by the platform, and alerts can still be processed depending on the configured behavior. As a result, the resource continues to have one of the standard availability states: UP, DOWN, or UNKNOWN.
The UI availability bar is used across the product, including resource overview pages, dashboards, service maps, and other areas that rely on the current or historical availability state of a resource. For this reason, scheduled maintenance is not shown as a separate availability state in the UI availability bar.
When a report excludes scheduled maintenance time, the report removes that duration from the calculation. This changes the denominator used to calculate UP, DOWN, and UNKNOWN percentages. Because the UI and the report are using different calculation scopes, the percentages can be different.
Note
The difference occurs because the UI availability bar represents the full selected time range using the configured resource availability behavior, while the report can optionally exclude scheduled maintenance time and recalculate availability using only the effective service period.When scheduled maintenance is excluded from the availability report, OpsRamp removes the maintenance duration from the report denominator and recalculates UP, DOWN, and UNKNOWN percentages only for the effective service period. The UI availability bar continues to represent the full selected time range based on the client-level maintenance handling setting. Therefore, report values may differ from the UI availability bar when maintenance exclusion is enabled in the report.
Reports Output
Once the report is generated, it will consist of the following sections:
- Summary: This section provides the configuration details.
- Availability Summary: This section provides a summary of the availability of your IT environment over a period of time.
- Detailed Outage Time: This section provides detailed outages of your IT environment over a period of time. If no selection is made for Select Availability State, this section will default to Down time.
- Location Availability: This refers to the availability of Synthetic Script resources for each configured location.
- Transaction Availability: This refers to the availability of resources for every action configured in the Synthetic Script resource.
- Deleted Resources Summary: This section includes availability details of deleted resources. It will appear when the user selects Resource in the Availability By option and enables the Include Deleted Resources checkbox in the parameters.
- Glossary: This section contains detailed information about each section present in the report tab, helping you to understand the generated data better.
Sample of reports in XLSX format: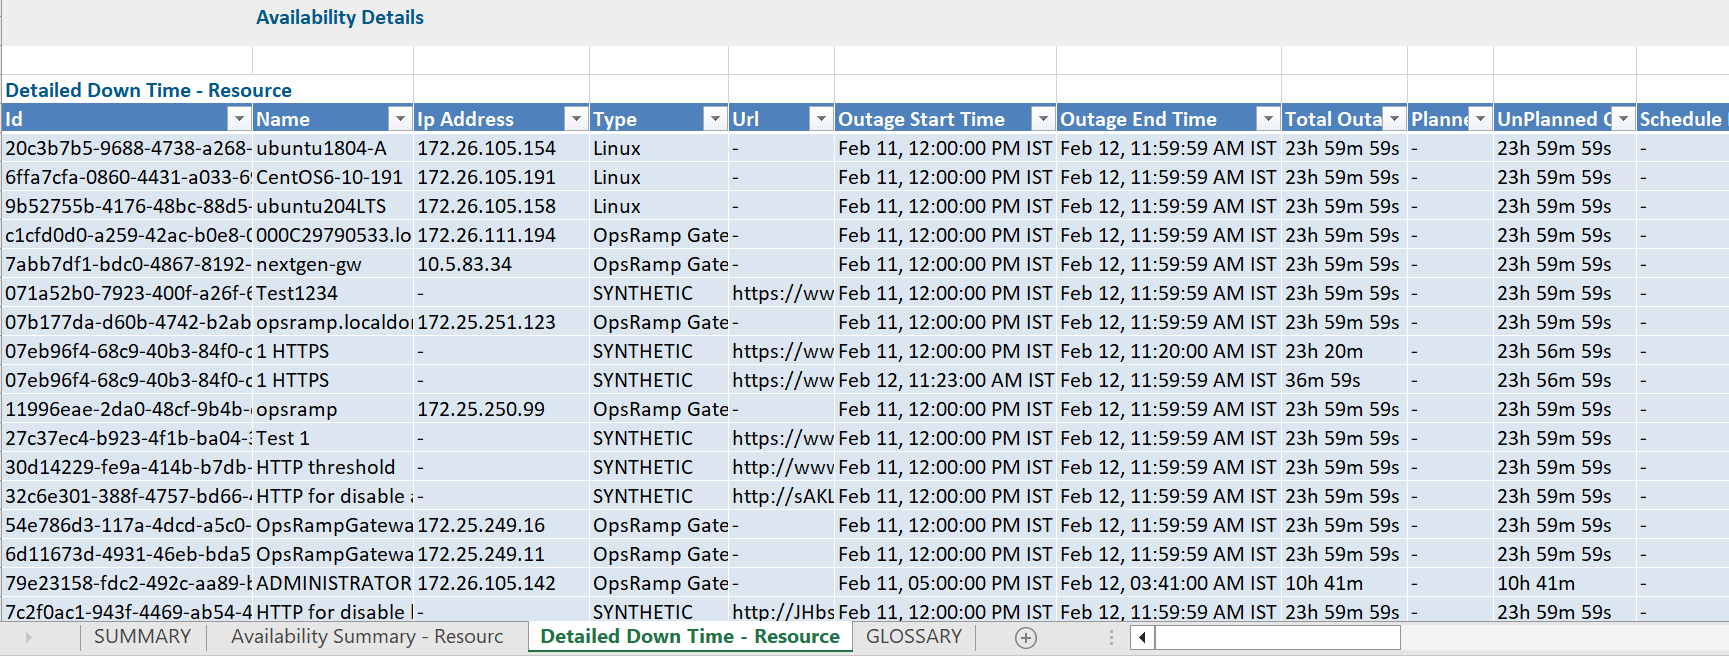
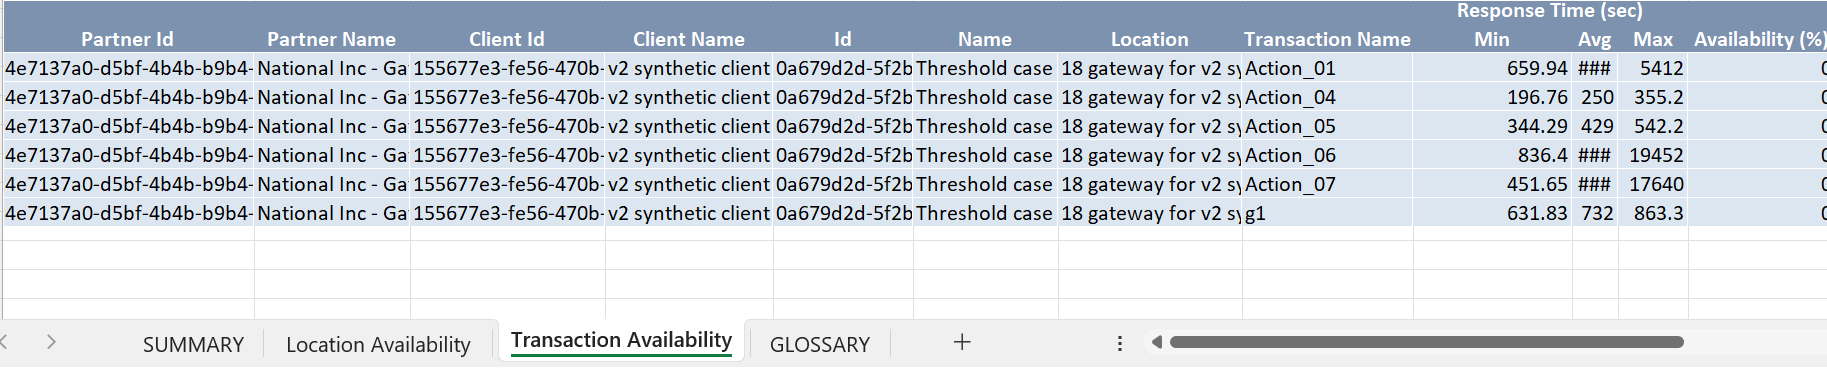
Availability Report Vs Availability Details
Click here to view the supported attributes
| Availability Report | Availability Details | |
|---|---|---|
| UI Atrributes Selection | Display Format In Report | |
| Device type | type | Type |
| Device name | resourceName | Resource Name |
| Device Id | id | Id |
| Site | location | Location |
| Outage start time (IST) | N/A | Outage Start Time |
| Outage | N/A | Total Outage |
| Ticket ID/Alert ID | N/A | Ticket Ids, Alert Ids |
| Device Group | N/A | DeviceGroups Name |
| Current Availability Status | N/A | Availability State |
| Availability(%) | N/A | Up(%), Down(%), Undefined(%), Unknown(%) |
| Downtime Duration | N/A | Total Down Time Duration |
| Scheduled Maintenance Duration(min) | N/A | Schedule Maintenance Duration |
| N/A | N/A | Schedule Maintenance Window Name |
| Avg. Latency (ms) | N/A | Avg. Latency (ms) |
| SSL Certificate Expiry (Days) | N/A | SSL Certificate Expiry (Days) |
| Managed Devices | N/A | N/A |
| Instance Id | N/A | N/A |
| Cloud Integration Name | N/A | N/A |
| N/A | agentConnectivity | Agent Connectivity |
| N/A | agentDeployTime | Agent Installation Time |
| N/A | agentInstalled | Agent Installed |
| N/A | agentLastConnected | Agent Last Connected |
| N/A | agentPlatform | Agent Platform |
| N/A | agentProxyName | Agent Proxy Name |
| N/A | agentVersion | Agent Version |
| N/A | aliasName | Alias Name |
| N/A | alternateIpAddress | Alternate Ip Address |
| N/A | availabilityState | Availability State |
| N/A | availableAppName | Available App Name |
| N/A | cloudInstanceState | Cloud Instance State |
| N/A | consoles.type | Consoles Type |
| N/A | cpu.numberOfCores | Number Of Cores |
| N/A | cpu.processor | Processor |
| N/A | cpu.processorName | Processor Name |
| N/A | created | Created |
| N/A | createdSource | Created Source |
| N/A | deviceGroups.name | DeviceGroups Name |
| N/A | deviceGroups.uniqueId | DeviceGroups UniqueId |
| N/A | discoveredAppName | Discovered App Name |
| N/A | discoveryProfileId | Discovery Profile Id |
| N/A | dnsName | Dns Name |
| N/A | entityType | Entity Type |
| N/A | firmwareVersion | Firmware Version |
| N/A | gatewayFirmwareVersion | Gateway Firmware Version |
| N/A | gatewayId | Gateway Id |
| N/A | gatewayLastRegRequestTime | Gateway Last Reg Request Time |
| N/A | gatewayModel | Gateway Model |
| N/A | gatewayName | Gateway Name |
| N/A | hasRelationship | Has Relationship |
| N/A | hostName | Host Name |
| N/A | identity | Identity |
| N/A | installedAppName | Installed App Name |
| N/A | internalId | Internal Id |
| N/A | ipAddress | Ip Address |
| N/A | lastDiscovered | Last Discovered |
| N/A | lastUpdated | Last Updated |
| N/A | logicalDiskDrive.driveCaption | Drive Caption |
| N/A | logicalDiskDrive.driveFreeSpace | Drive Free Space(GB) |
| N/A | logicalDiskDrive.driveName | Drive Name |
| N/A | logicalDiskDrive.driveTotalSpace | Drive Total Space(GB) |
| N/A | macAddress | Mac Address |
| N/A | make | Make |
| N/A | managementProfileId | Management Profile Id |
| N/A | managementProfileInternalId | Management Profile Internal Id |
| N/A | managementProfileName | Management Profile Name |
| N/A | managementProfileRegistered | Management Profile Registered |
| N/A | moId | Mo Id |
| N/A | model | Model |
| N/A | monitorable | Monitorable |
| N/A | name | Name |
| N/A | nativeType | Native Type |
| N/A | ncmPolicyName | Ncm Policy Name |
| N/A | ncmPolicyUniqueId | Ncm Policy Unique Id |
| N/A | networkCardDetails.adminStatus | NetworkCardDetails AdminStatus |
| N/A | networkCardDetails.ifAlias | NetworkCardDetails IfAlias |
| N/A | networkCardDetails.ifDescription | NetworkCardDetails IfDescription |
| N/A | networkCardDetails.ifName | NetworkCardDetails IfName |
| N/A | networkCardDetails.ipAddress | NetworkCardDetails IpAddress |
| N/A | networkCardDetails.macAddress | NetworkCardDetails MacAddress |
| N/A | networkCardDetails.operationalStatus | NetworkCardDetails OperationalStatus |
| N/A | networkCardDetails.speed | NetworkCardDetails Speed |
| N/A | os | Os |
| N/A | osType | Os Type |
| N/A | parentResourceType | Parent Resource Type |
| N/A | physicalMemory | Physical Memory |
| N/A | resourceType | Resource Type |
| N/A | resourceTypeDisplayName | Resource Type Display Name |
| N/A | resourceTypePath | Resource Type Path |
| N/A | rootLocation | Root Location |
| N/A | serialNumber | Serial Number |
| N/A | serviceGroups.name | ServiceGroups Name |
| N/A | serviceGroups.uniqueId | ServiceGroups Unique Id |
| N/A | snmpSupported | Snmp Supported |
| N/A | softwareVersion | Software Version |
| N/A | state | State |
| N/A | syntheticType | Synthetic Type |
| N/A | timezone | Timezone |
| N/A | url | Url |
| N/A | wmiSupported | Wmi Supported |
| N/A | N/A | Ticket Ids |
| N/A | N/A | Ext Ticket Ids |