Introduction
The MetricsQL is a PrometheusQL compatible query language to query metrics from OpsRamp. With MetricsQL, you can express queries using the same syntax as PromQL. This document describes the functionality, terminology, and also usage of MetricsQL with examples.
The MetricsQL collects and stores monitoring data, and displays the same data visually in the form of time series graphs.
Features
- Supports querying on multiple devices using multiple metrics in a single graph/widget.
- Enables visualization of various types of metrics. For example, resource metrics or any custom integration.
- Supports aggregation operators and functions that can be used to query and get the desired results.
- Provides dynamically populated drop-downs with metrics, tags, aggregates, and functions with the Basic Query feature. The user can choose from the list to build a query.
Metrics
Metrics provide an overall picture of the health and performance of your system.
Metrics are the basic values used to:
- Understand historical trends.
- Compare various factors.
- Identify patterns and anomalies.
- Find errors and problems.
For instance, you can quickly visualize the average memory usage of your servers, CPU utilization, or free virtual memory.
Once the problem is identified, you can troubleshoot and fix it.
Metrics help an organization save time, effort, money and improve performance.
Terminology
| Attribute/Name | Description | ||||||||||||
|---|---|---|---|---|---|---|---|---|---|---|---|---|---|
| Metric Name ( For example: system_memory_usage_usedspace ) | Allowed Regex for Metric names: uppercase and lowercase characters, numbers, special characters such as ":", "_", "-", "*", "[", "]" | ||||||||||||
| Labels |
Following are the accepted values for Labels: Metric data point | A metric data point is made up of: | Time series | Combinations of metric name, labels, and sets of data points collected over a period are called Time series. | Instant vector | A set of time series containing a single sample for each time series, all sharing the same timestamp is called an Instant vector. | Range Vector | A set of time series containing a range of data points over a time for each time series is called a Range Vector. | Time Range/Duration | Time durations are specified as a number, followed immediately by one of the following units: | Step Value | |
MetricsQL
MetricsQL provides the flexibility to query using metrics, functions, operators and labels. The results of the query can be shown in the form of graphs, viewed as tabular data, or consumed via API.
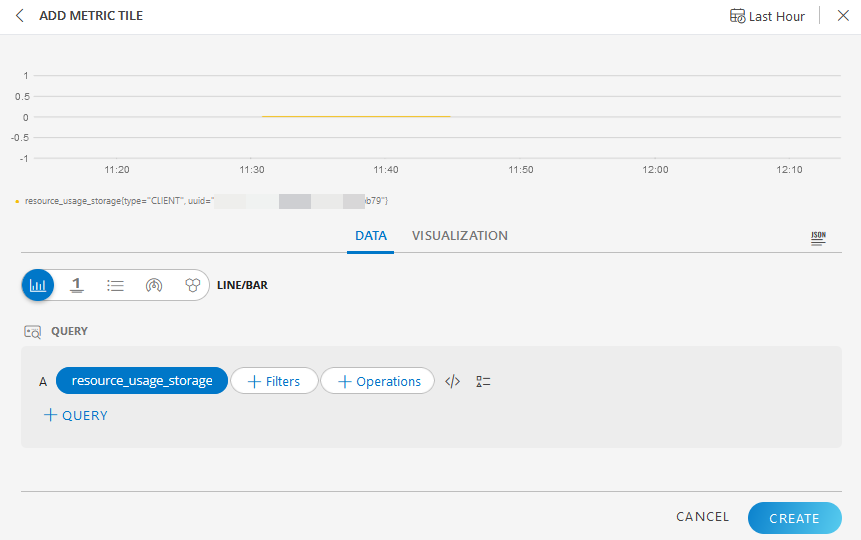
Visualization of metrics using queries in Dashboard 2.0:
- Create a metric tile in Dashboard 2.0
- Specify the MetricsQL expression
Retrieve data using the MetricsQL API:
- Specify the MetricsQL expression and the duration of the timestamp in the API.
- Click here for API reference.
Metrics Page (Beta) shows all the metrics graphs related to a resource
(navigation: Infrastructure > Resources).- Contains options to render graphs for: 1H/2H/4H/8h/1 Week/1 Month/1 year/Month-to-Date/Year-to-Date/Custom Range duration.
- Up to 1 week duration: The graph shows raw samples based on default step value: 1min.
- Example: If the metrics are collected with a configured frequency of 5 min and default step value of 1 min(60 sec), the same value is rendered from T to T+4m (example 8:00 AM to 8:04 AM). This is the default behavior in MetricsQL. It will show the same value from 8:00 AM till 8:05 AM.
- Graphs are displayed with a uniform frequency of 1 min by default, irrespective of the configured frequency, to support multiple metrics in one graph.
- MetricsQL (PromQL) has a frequency, that is, resolution step (example: 1 min) independent of the underlying details of metrics configured frequency.
- This helps to query with multiple metrics and resources in one request and plot in the same graph to compare the performance across different parameters (metrics/resources).
- 1 week to 3 months: The graph shows 1 hour Average/Maximum/Minimum values based on selection.
- More than 3 months: The graph shows 1 day Average/Maximum/Minimum values based on selection.
- Up to 1 week duration: The graph shows raw samples based on default step value: 1min.
- Contains options to render graphs for: 1H/2H/4H/8h/1 Week/1 Month/1 year/Month-to-Date/Year-to-Date/Custom Range duration.
The following basic steps help you to write MetricsQL expressions that can be used either in Dashboard 2.0 or API:
Example 1: Querying with CPU metric for a resource:
- Type the metric name in the PromQL query box:
“system_cpu_usage_utilization” – This shows the CPU usage at the client level.
- Type the metric name in the PromQL query box:
Step value calculation
Default step value in the query is 60 sec.
Example: Consider sending samples every 10 min, you can view 10 samples. For 24 hours, it will be 24X60=1440 samples. For a month, this will be 1440X30=43200. The API response will have more data. Consider the recommended step size.
Step value limits the number of returned points per time-series based on step value resolution. Step is interval in terms of seconds. Metric engine time series data, by default, can give up to 11,000 data points only.
Example: If you are querying data for the last 10 days with step value as 60 sec, you will get the below exception:- Exceeded maximum resolution of 11,000 points per time series. Try decreasing the query resolution (?step=XX)
- Exceeded maximum resolution of 11,000 points per time series. Try decreasing the query resolution (?step=XX)
Sample calculation at the metric engine for 10 days duration based on the step value is as below:
- start = 1634629345
- end = 1635493345
- step = 60(60 sec)
- Formula ((end-start / step)>11000)
- (1635493345-1634629345)/60 = 14400, that is, result greater than 11000. This is more than the support limit.
- Formula ((end-start / step)>11000)
- Example calculations based on the above limitation up to 11000 data points for best practice.
- For 11000 points up to one week, use step value as 60 sec
- For 11000 points up to one year, use step value as 1hr (3600 sec)
Recommended step size, time interval and default sizing
| Time Interval | Step Size |
|---|---|
| up to 1 week | 60 sec |
| > 1 week and < 1 month | 250 sec |
| > 1 month and < 3 months | 730 sec |
| > 3 months and < 6 months | 1450 sec |
| > 6 months and < 1 year | 2875 sec |
Example: Custom scenario to get 12 months metric data
- Create the step size as per requirement, say for each day/week with 90 sec interval step size. This should be within 16 MB data size and 11,000 data points.
- Get the metric for each day/week to complete the 12-month period.
- Collect metric data for each day with the set step-size.
Example: Split the entire duration into multiple durations. So, slice the 12 months data into 4 parts, that is, every 3 months.https://<server.com>/metricsql/api/v3/tenants/<tenantId>/metrics?query=synthetic_response_time%7Binstance%3D%7E%22MonitoringChannel%7CTest+old+binary%22%7D%26step%3D90&start=1630454400&end=1630540800
Max data size supported
- 16 MB per endpoint call
Max MetricsQL length
- 8K Characters
Limitations in MetricsQL query
Query response below 5 MB data is advised for faster response.
Example 1: Querying metrics with longer duration and shorter step size:
system_cpu_utilization{name=”host1”}[15m], Duration:May to Jul
Solution: Query with a shorter time period.Example 2: Query contains multiple interface details as instances.
network_interface_traffic_in{name=”switch1”}[15M],
Duration:Oct 1st to Oct 15thSolution: Filtering with instance names gives faster response. Response data size will decrease when you query with multiple labels.
network_interface_traffic_in{name="switch1",instance=~"eth0|eth1|if12"}[15M], Duration:Oct 1st to Oct 15thMax Response data using queries should not exceed the 16 MB limit.
Example:
system_cpu_utilization, Duration:1 hour
This will fetch cpu utilization for the entire client. A client has many resources and the CPU metric is applied on all of them. If you query for all the resources, the response data will be huge.Solution: Filtering with resource names, labels, instances, or any other filter.
Expect slow response time/browser loading time, if the query response is between
5MBand16MB.- Create Multiple dashboard metric tiles to avoid slow response time.
- Create multiple API queries with lesser duration time range and filtered with labels. That is, if you want to create the API query for a one-month time range, then you can slice the time period into 3 parts. So, in this case it will be 10 days per query. Similarly, if you want to fetch data for 10 devices, you can use two separate queries; one query for 5 devices and another query for 5 devices.
Maximum TimeSeries data up to 11000 data points only.
Exception: Data Limits exceeded message pops up when this limitation is breached.Step value and duration limits the number of returned data points.
See Step value recommendation
Data Retention Policy
- The maximum retention period of the metric data is 12 months
- Based on the TTL configuration, more than 12 months data will be deleted.
Examples of queries
| Query Use Case for Time Series Data | PromQL Query | Data Type | ResultType | Description |
|---|---|---|---|---|
| On Metric Level(__name__) | system_cpu_utilization | Range Vector | Matrix | Querying data using Metric Name(__name__) label |
| On Metric +multiple label Combination | system_cpu_utilization{type="RESOURCE",uuid="4530d51c-3b32-4a91-ae2e-160f50f50d94"} | Range Vector | Matrix | Querying data using metric name , Resource Type and Resource Unique_id combination |
| On Resource Type and Resource Unique Id combination without Metric Name | {type="RESOURCE",uuid="4530d51c-3b32-4a91-ae2e-160f50f50d94"} | Range Vector | Matrix | Querying data with the Combination of Resource type and Unique Id without Metric Name. |
| Multiple label values selection using Regex | system_cpu_utilization{instance=~"CPU"} | Range Vector | Matrix | Querying data on Multiple instance values selection using Regex |
| Multiple Metric Name Selection using Regex | {__name__=~"system_cpu_utilization|system_ping_pl"} | Range Vector | Matrix | Querying data on Multiple Metric Names |
| Based on Text Match Regex | {__name__=~".*ping_.*"} | Range Vector | Matrix | Querying data on Regex Matching |
| Count By Instance based on Metric Name | count by (instance) (system_cpu_utilization) | Range Vector | Matrix | Querying data by instances |
| Predicts the data based on last samples | predict_linear(demo_disk_usage_bytes[4h], 3600) | Predicts a value in 1 hour, based on the last 4 hours |