Introduction
Syslog events are messages generated by devices, applications, or systems, which are then captured and sent to a syslog server for storage, monitoring, and analysis. These events provide valuable information about system operation and status, essential for troubleshooting and security analysis.
Prerequisites
The gateway server must be installed in the managed environment.
Tip
If you are unfamiliar with regex, free websites provide regex reference materials, tutorials, and development tools to fine-tune the regex expressions you might need to define rules.Monitor syslog events through OpsRamp tool
User should create rules and configuration profiles to monitor required syslog events through the OpsRamp tool. Then, the OpsRamp tool generates alerts for the required syslog events as per rules and configuration profiles.
What is Syslog monitoring rule?
The syslog monitoring rule filters syslog events based on a regex pattern and generates alerts in the OpsRamp UI according to user-specified metric names, component names, alert subjects, alert descriptions, and alert severities.
Users can define the metric, component, alert subject, and alert description in two ways:
- Static approach
In a static approach, users define fixed values for the metric name, component name, alert subject, and alert description based on syslog events.
Example
If a user wants to generate an alert when a syslog message contains the term invalid_user, they would create a rule specifying regex as invalid_user.
Whenever a syslog event matches regex, OpsRamp tool generates an alert using the predefined metric name, component name, alert description, and alert subject.
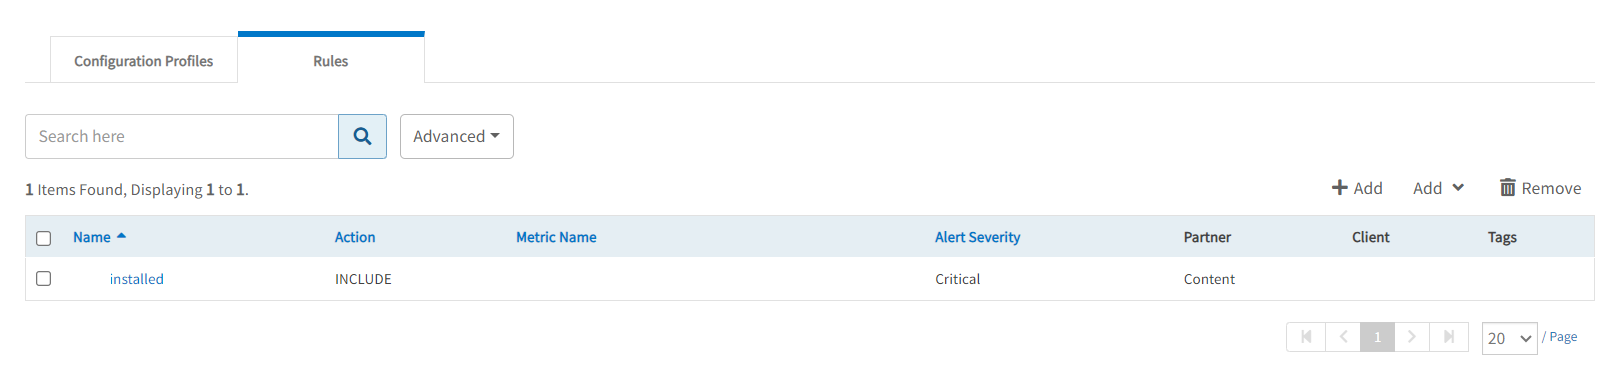
The screenshot below illustrates this setup.
Sample Syslog Event: “Jun 17 12:45:02 localhost sshd[1234]: Failed password for invalid_user from 192.168.1.200 port 5678 ssh2”

- Dynamic approach
With this approach, you can dynamically derive the metric name, component name, description, and subject from syslog event using the grouping concept in regex. Additionally, it supports predefined macros that can be used when defining rules.
Sample Syslog Event: "devname="abcserver" devid="F22004743" eventtime=1714470971124258725 tz="+0200" logid="0100040704" type="event" subtype="system" level="notice" vd="root" logdesc="System performance statistics" action="perf-stats" msg=Performance statistics: average CPU: 0, memory: 4, concurrent sessions: 20517, setup-rate: 1"
For example, if a user wants to go with dynamic approach to generate an alert and derive the metric name, component name, description, and subject from the syslog message and the user wants to see the logdesc value as the metric name, the devname value as the component, the msg=Performance statistics value as the subject, and the entire syslog event message as the description. When the user receives the above syslog event, we have to define the regex as mentioned below:
Regex pattern: "(devname=(.*)devid.*(logdesc=(.*)(action=(.*)(msg=(.*(Performance statistics).*)))))"
AlertDetails in OpsRamp: Then details coming in the alert as below and rule have to define as mentioned in the screenshot.
Metric name: system performance statistics Component name: abcserver Subject: Performance statistics: average CPU: 0, memory: 4, concurrent sessions: 20517, setup-rate: 1 Description: devname=“abcserver” devid=“F22004743” eventtime=1714470971124258725 tz="+0200" logid=“0100040704” type=“event” subtype=“system” level=“notice” vd=“root” logdesc=“System performance statistics” action=“perf-stats” msg=Performance statistics: average CPU: 0, memory: 4, concurrent sessions: 20517, setup-rate: 1

- Supporting Macros
- ${received.syslog.message} : It provides a description of the event or message. In a syslog event message, the description typically provides specific details about what occurred or what was detected by the system or application.
- ${timestamp} : It shows the timestamp of the event when it was received at the gateway in Unix Time
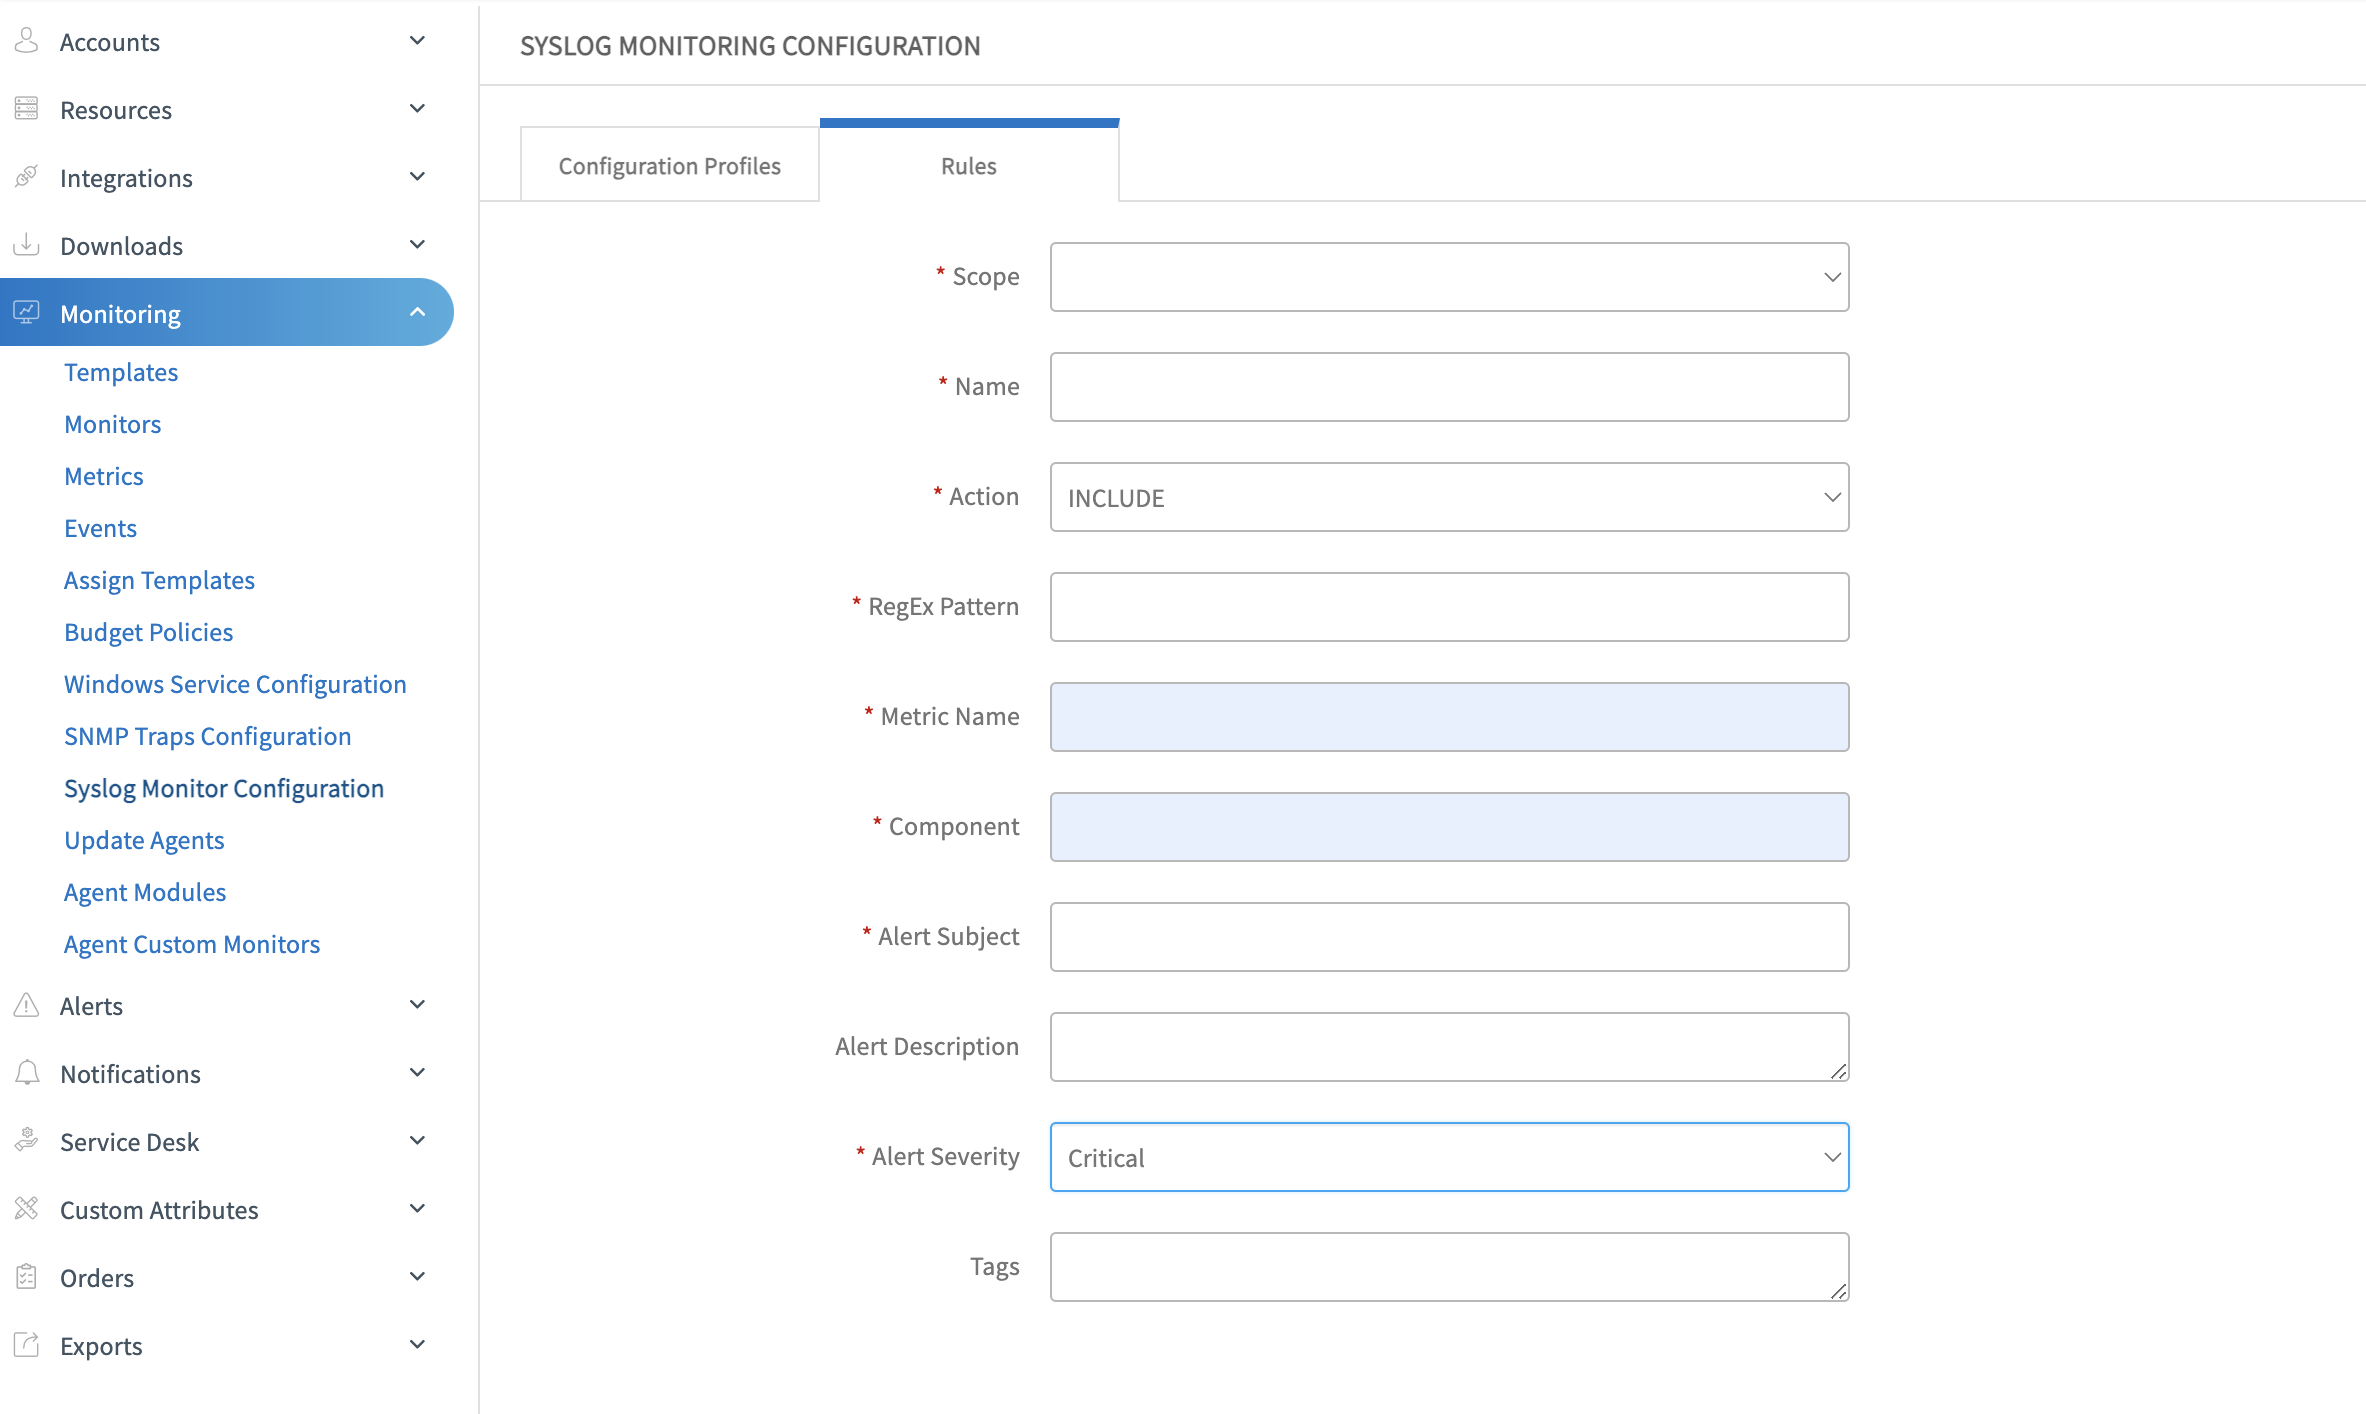
Steps to creating a syslog monitoring rule
- Select Setup > Monitoring > Syslog Monitoring Configuration.
- Click the Rules tab.
- Click Create New.
- Enter the following information:
| Property | Description |
|---|---|
| Scope | (required) Scope to which the rule is applied:
|
| Client | (required) If Client-specific Rule scope is selected, select from drop-down client list. |
| Name | (required) Rule name. |
| Action | (required) Action to apply to messages that match this rule:
|
| RegEx Pattern | (required) Regex pattern to apply for matching messages. |
| Metric Name | (required) User-defined metric name, which can be specified using regex. |
| Component | (required) User-defined component name. |
| Alert Subject | (required) User-defined alert subject. |
| Alert Description | User-defined alert description. |
| Alert Severity | (required) Alert severity level:
|
| Tags | User-defined tag name. |

- Click Submit.
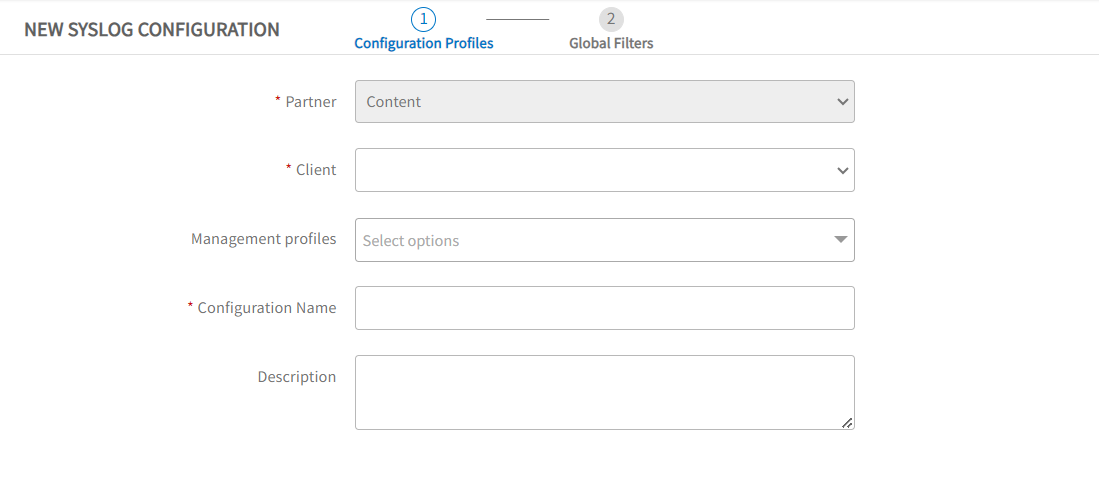
Add a syslog configuration profile
The Syslog Monitor Configuration functionality is used to filter messages and generate alerts from the messages. For example, to stop receiving alerts for mail system messages, the system can be “trained” to not monitor those messages.
- Select Setup > Monitoring > Syslog Monitoring Configuration.
- Click the Configuration Profiles tab.
- Click Create New.
- Enter the following information:
| Property | Description |
|---|---|
| Partner | (required) The partner scope is prepopulated. |
| Client | (required) Client scope. Prepopulated if already selected. |
| Management profiles | List of management profiles configured in Resources > Management Profiles |
| Configuration Name | (required) Name of this configuration profile. |
| Description | Description of this profile. |
- Click Next.
- In the Global Filters page, enter the following configuration profile properties:
| Property | Description |
|---|---|
| Severity | (required) Message severity level drop-down list from RFC 5424. |
| Facility | (required) Type of message to monitor drop-down list from RFC 5424. |
| Resource Filter 1 |
|
|
- (optional) To define a new rule and add it to the resource filter, click the + New Rule button, enter the rule properties as described in Add a syslog monitoring rule, and click Save.
- Click Save to apply the profile configuration and list the defined configurations.
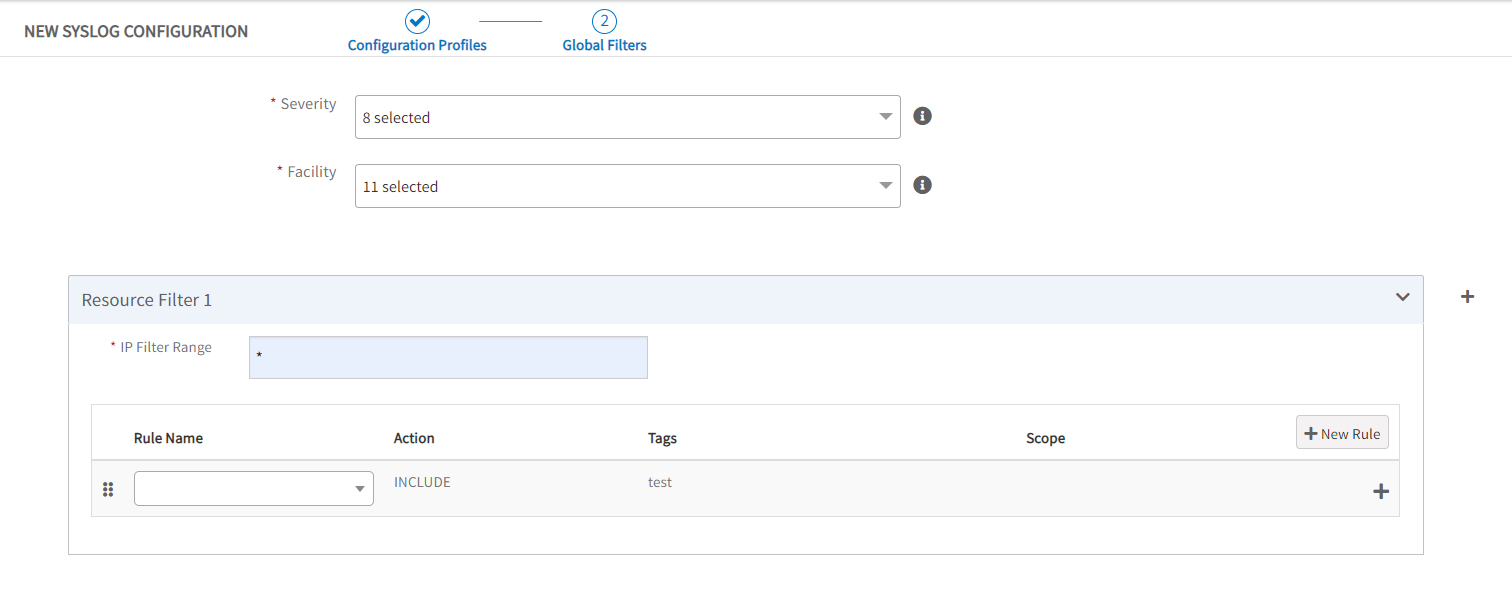
- Click + Add to define another profile.
Add a syslog monitoring rule
- Select Setup > Monitoring > Syslog Monitoring Configuration.
- Click the Rules tab.
- Click Create New.
- Enter the following information:
| Property | Description |
|---|---|
| Scope | (required) Scope to which the rule is applied:
|
| Client | (required) If Client-specific Rule scope is selected, select from drop-down client list. |
| Name | (required) Rule name. |
| Action | (required) Action to apply to messages that match this rule:
|
| RegEx Pattern | (required) Regex pattern to apply for matching messages. Matching groups can be used as parameters, such as ${1}, in generating alert messages. |
| Metric Name | (required) User-defined metric name, which can be specified using regex. |
| Component | (required) User-defined component name. |
| Alert Subject | (required) User-defined alert subject. |
| Alert Description | Alert description. |
| Alert Severity | (required) Alert severity level:
|
| Tags | User-defined tag name. |
- Click Submit.
View and edit configuration profile
- View the defined configuration profiles in the Setup > Monitoring > Syslog Monitoring Configuration > Configuration Profiles tab:
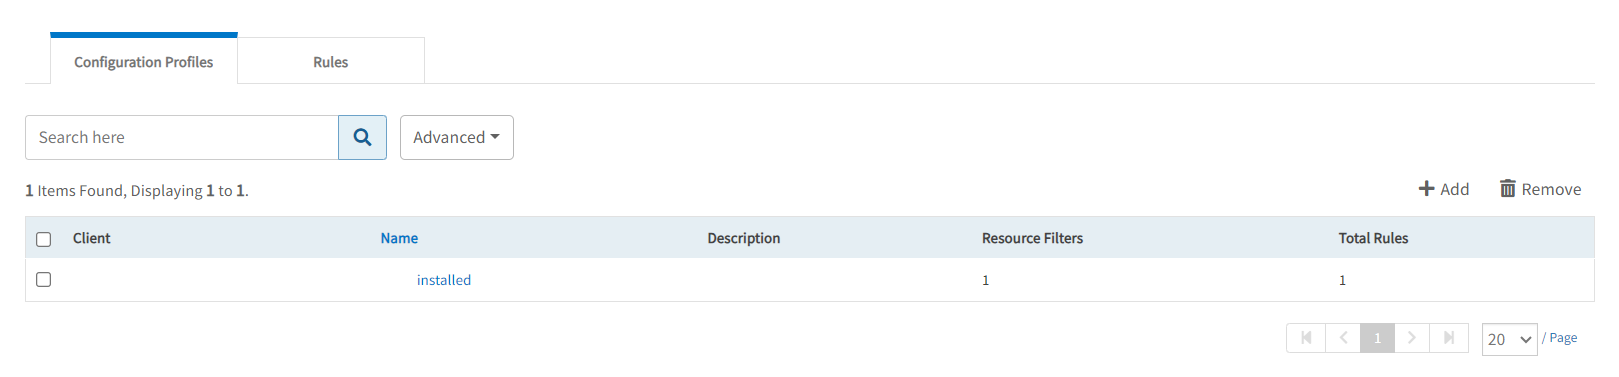
- Click the configuration profile name to see the detailed profile information.
- (optional) You can change profile properties as needed. When complete, click Next.
- (optional) Change existing rule properties or add new rules as described in Add a syslog monitoring rule.
- Click Save.
View rules
- View rule details in the Setup > Monitoring > Syslog Monitoring Configuration > Rules tab.
- Change existing rule properties or add new rules as described in Add a syslog monitoring rule.
- Click Save.
Search profiles and rules
The following Syslog Monitoring Configuration search options are available.
Search profiles and rules
Use the configuration name and rule name to find a configuration profile and rules using.
Advanced search
To search for specific criteria, use the Advanced search option.
Advanced configuration profile search
To search profiles using specific criteria:
Click Advanced.
In ADVANCED SEARCH, enter :
- Client
- Configuration Name
Click Search.
The Configuration Profile screen displays search results.
Advanced rules search
To search rules using specific criteria:
Click Advanced.
In ADVANCED SEARCH, enter the following information:
- Client
- Action
- Tags
Click Search.
The Rules screen displays search results.
Delete profiles and rules
Use the Remove option to delete existing configuration profiles and rules.
To delete a Syslog configuration from a single gateway management profile, remove the managed profile from the respective Syslog configuration.
How to process the received syslog event message
If any syslog event is received to the gateway, it first checks the event severity against the criteria specified in the first profile that is sorted alphabetically. If the severity matches, it then proceeds to check the facility. If the facility also matches, it proceeds to evaluate the rules within that profile. If a rule is matched, the process stops; otherwise, it moves on to the next profile and repeats the same sequence of checks.
Examples
- Let us consider three configuration profiles, P1, P2, and P3, and event E1 is received to the gateway, the gateway first checks the event against the P1 profile. If event E1 matches the severity specified in profile P1, then the gateway checks the facility in profile P1. If it matches, then it proceeds to check the rules one by one in the P1 profile. If any of the rules in P1 do not match, the gateway moves on to profile P2 and checks the severity specified in the profile P2, it matches then checks the facility. If the facility matches the selected facility of the profile P2 then check the rules in the profile P2. If any of the rules matches, the alert will be generated, and it will not check other profiles.
- If Event E2 is received to the gateway, it checks against profile P1. If the severity of the event matches, then check the facility in profile P2. If it matches, then check the rules in the profile P1. If any of the rules does not match in profile P1 then move to profile P2. If it checks the severity of the profile P2 it matches, checks the facility it is also matched then checks the rules. If the rules do not match, then move to the profile P3. If the severity of the profile P3 does not match, the gateway will drop the event.
- If Event E3 is received to the gateway, it checks the severity in profile P1. If it matches, then it proceeds to check the facility in profile P1 and checks the rules in P1 one by one. If any rule matches in any profile, an alert is generated.
- If Event E4 is received to the gateway, it first verifies the severity in profile P1. If it does not match, the gateway will drop the event.
- If Event E5 is received to the gateway, it initially verifies the severity in profile P1. If it matches, then it proceeds to check the facility in profile P1. If the facility does not match, the gateway will drop the event.
Troubleshooting Steps
Step 1: Verify whether syslog events coming to OpsRamp gateway from syslog server by enable the flags
- Login to the gateway
- Execute gcli command
- Execute below command to enable flags for print additional logs
flag add syslog.log on 40loglevel set com.vistara.gateway.syslog.SyslogEventProcessor DEBUG 60loglevel set com.vistara.gateway.syslog.SyslogMessageHandler DEBUG 60 - Execute exit command to exit from gcli`
- Replace the syslog server ip address and execute below command
tail -100f /var/log/app/vprobe.log | grep “UDP : Ip : <Ipaddress>” - Send the syslog event to the gateway and verify whether the log message appears in the gateway after the above command.
- If you do not find any log messages, refer step 2 and capture the packets.
Step 2: Verify whether syslog events are coming to the OpsRamp gateway from the syslog server by capturing the packets
- Launch another gateway console execute the below tcpdump
tcpdump -i any "udp port 514" -s 3000 -w /tmp/syslog.pcap - Send the syslog event to the gateway and verify whether the packet count increased.
- If the packet count increases, then press Ctrl+C to stop capturing packets.
- Download the packets to your machine and open them in Wireshark to verify the details.
- If no packets are captured, or if the required packets are not captured, it is necessary to check the configurations on the syslog server.
- If required packets are captured then go the step3 and verify syslog configuration in the gateway side.
Step 3: Verify Syslog Configuration Pushed to the OpsRamp Gateway
- Execute the gcli command.
- Execute the syslogcache print command.
Sample Output: Syslog Cache Collection is written to file:/var/log/app/tmp/syslogcache-1720088523726.json - Execute the exit command to exit from gcli.
- Display the output file using the following command:
cat /var/log/app/tmp/syslogcache-1720088523726.json - Verify that the configured rules and configurations are present in the file.Specifically, check IP address, severity, facility of the event and regex pattern in the rules. If incorrect, create or update the configuration profile/rules accordingly.
Step 4: Verify whether any rule dropping the event
- Login to the gateway
- Execute gcli command
- Execute below command to enable flags for print additional logs
flag add syslog.log on 40loglevel set com.vistara.gateway.syslog.SyslogEventProcessor DEBUG 60loglevel set com.vistara.gateway.syslog.SyslogMessageHandler DEBUG 60 - Execute exit command to exit from gcli
- Execute below command
tail -100f /var/log/app/vprobe.log - If you find the following messages in the log, it indicates events are reaching the gateway but are being skipped.If alerts are needed for these events, create or update the configuration profile accordingly.
SyslogEventProcessor#96: Skipped:Severities. IP : 10.212.0.7, severity: 5, Profile: ABC Test syslog profile
Step 5: Check Gateway Alert Throttling
- Understand that OpsRamp Gateways apply alert throttling to reduce alert noise and optimize processing.
- By default, the Gateway limits 4 alerts per 10 minutes for each unique combination of:
- Device IP
- Metric name
- Component name
(Collectively referred to asdeviceip_metric_componentkey)
- Once the threshold is reached:
- Additional alerts for that key are not sent to the OpsRamp cloud until the 10-minute interval resets.
- After the interval resets, the next alert will be:
- Appended with “Attenuated Alert:" in the alert subject
- Marked as CRITICAL
- In addition to gateway-side throttling, the OpsRamp cloud processes only one alert per key per minute. If multiple alerts are received within the same minute, only one is retained.
- If your SysLog events are not appearing as alerts in the platform:
- Review
/var/log/app/vprobe.logto determine if throttling messages are logged. - Confirm whether multiple alerts were generated for the same key within a short duration.
- Review
- If needed, you can customize the SysLog monitor rule to define unique
metricandcomponentvalues, which helps distribute alerts across different keys and avoid hitting the throttling limit. - There are no specific prerequisites to customizing these fields, and such changes do not affect the throttling behavior unless explicitly reconfigured with Support assistance.
- If behavior persists or seems abnormal, capture Gateway logs and contact OpsRamp Support.
Additional Information
Syslog events can be categorized into 8 types of events based on severity: Emergency, Alert, Critical, Error, Warning, Notice, Informational, and Debug. OpsRamp can generate Critical, Warning, OK, and Info alerts. These alerts are generated based on rules defined in the OpsRamp UI.
If you want an OK alert, they must define a specific rule for it. If the OK alert needs to be appended to an existing critical/warning alert, the OpsRamp tool allows it, but it requires the Metric name, component name, and resource to remain the same; otherwise, it generates a separate alert.
The Priority value is calculated by first multiplying the Facility number by 8 and then adding the numerical value of the Severity.