A List chart displays metric values in a two column list.
Create a List chart
- From Dashboard, click + and select METRIC tile, and select List as the chart type.
- In the Query A, enter the PromQL query for the required metric.
For example:
system_disk_used_space - Click Add Query to create another query field.
- In the Query B, enter the PromQL query for the required metric.
For example:
system_disk_free_space - In the optional Label fields, provide label names. If you do not provide a name, by default, the labels will appear as Query A and Query B.
- Sort the fields by ascending or descending order. Customize your charts using the options in the Visualization tab.
- Click Create.
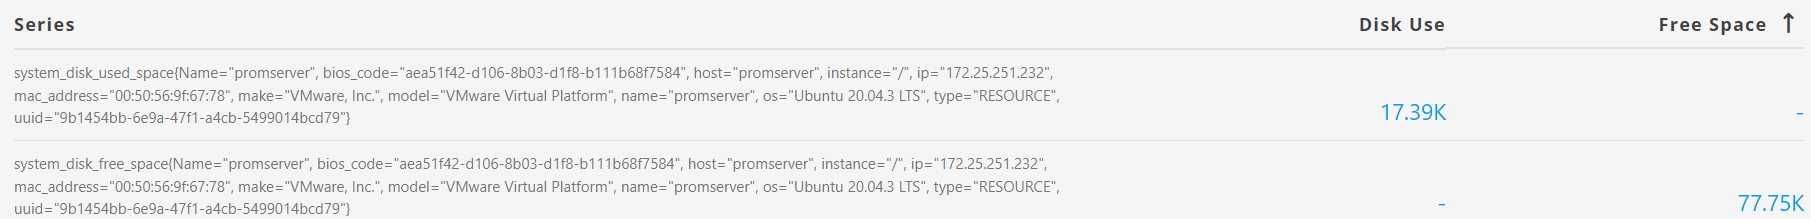
The metric values are displayed in a two column list. The list provides information about different resources that match the query.
Example:
To view two different metric values for the same resource side by side, configure the common attributes such as name and operating system information in the Legend field.
Example:
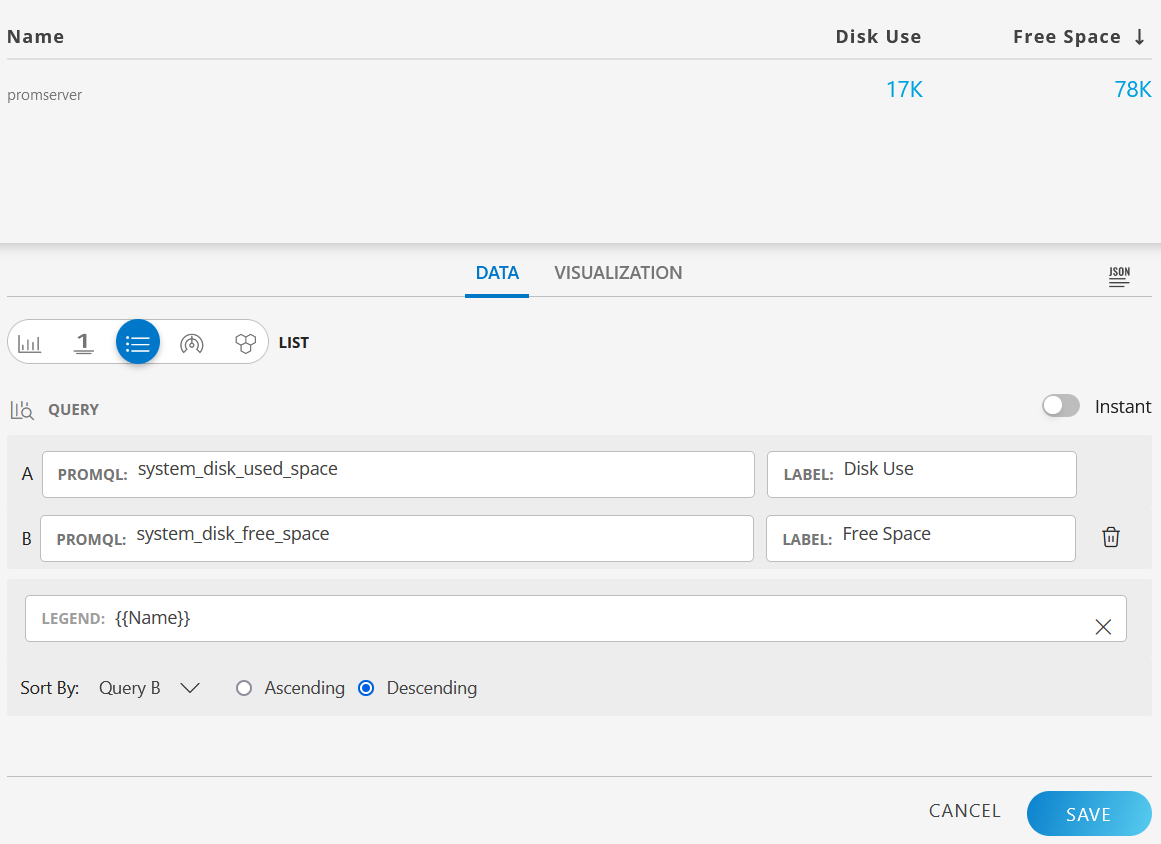


Click the Legend field to redirect the visualization to the detailed view of the specific resource.