More than a dozen widgets are available to monitor the status of the resources in your managed environment. Widgets are graphical elements visible in the dashboard layout that can display information as a list, pie chart, donut chart, column chart, or the count.
Create a service desk widget
The Service Desk widget helps to track issues according to the settings in Manual View and Service Desk View to facilitate easy tracking of issues based on metrics, such as Clients, Group, Priority, and Status. The widget helps to view request types, such as Service Requests, Tasks, Incidents, Problems, Change Requests, and Time-bound requests.
- Select Dashboard.
- Select a client from the All Clients list.
- Click + Add Widget and go to the MOST USED WIDGET section.
- Select Service Desk > Create Widget.
- Select one of the following options:
- Manual View
- Service Desk View
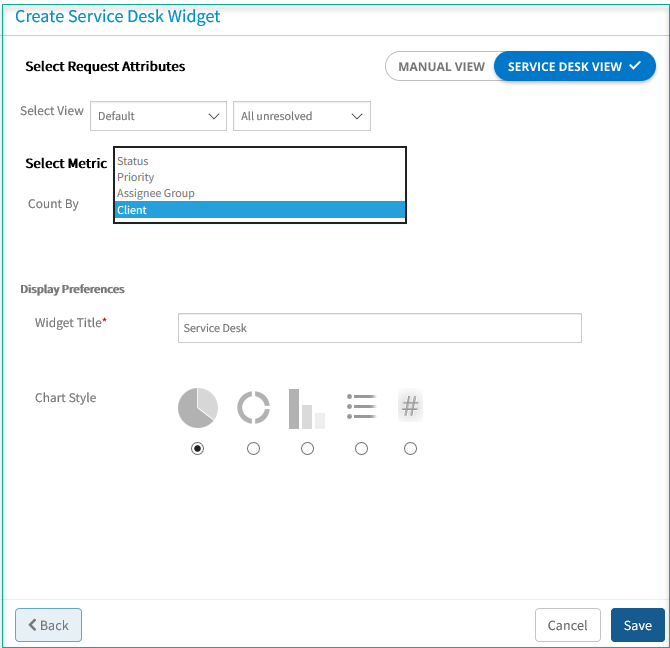
- For Service Desk View, enter the following information and click Save:
- Select Request Attributes: Select one of the options from Select View and select status of issue from the drop-down menu.
- Select Metric: Select one of the following metrics for Count By:
- Clients
- Assignee Group
- Priority
- Status
- Display Preferences: Enter a name for Widget Title and select Chart Style.
- For Manual View, enter the following information and click Save:
- Select Request Attributes: Select one of the options from Request Type, select a Source, and select Source Policy Type from the drop-down menu.
- Select Metric: Select options for Metric, Count By, and Duration.
- Display Preferences: Enter a name for Widget Title and select Chart Style.
Create an alert stats widget
The alert stats widget displays the total number of events, correlated alerts, inference alerts, ticketed, and suppressed alerts over a specific period of time.
- Select Dashboard.
- You can create an alert stats widget at the partner level or select a client from the All Clients list.
- Click + Add Widget and go to the MOST USED WIDGET section.
- Select Alert Stats > Create Widget, enter the following information and Save:
- Show: Data displayed in the selected time frame.
Example: Last 8 Hours. - Inference Stats: Type of alert data in the widget displayed according to Enabled policies only.
- Widget Title: Name of the widget.
- Show: Data displayed in the selected time frame.
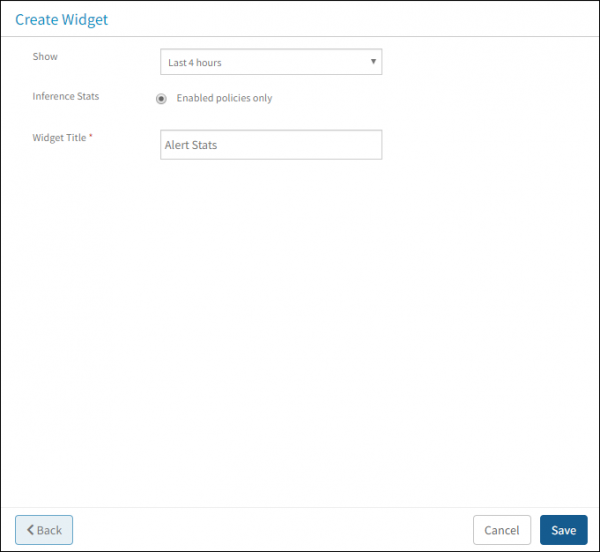
- Click Save.The following Alert Stats widget screen is displayed.
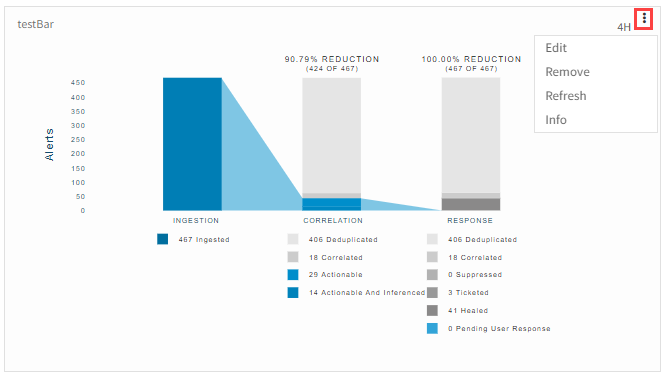
Below information is displayed in the alert stats screen:
- INGESTION: Total number of alerts ingested.
- CORRELATION: Displays below information:
- Total number of deduplicated alerts.
- Number of alerts correlated.
- Actionable alerts.
- Total number of actionable and inferenced alerts. The count of the inference alerts are adjusted from the correlated alerts to show the correct data and change in values across time.
- Response: Displays below information:
- Total number of deduplicated alerts.
- Number of alerts correlated.
- Number of alerts suppressed. The suppressed alerts that are ticketed will not be considered in the suppressed alerts count, as the alert was already considered in ticketed count.
- Number of alerts ticketed. Once you change the status of the ticketed alerts to suppressed, the count in the widget will not be changed as the widget considers the original state of the alert.
- Number of alerts healed. The healed alerts will not be considered as ticketed/suppressed/correlated, because the ticketed, suppressed and correlated alerts were already counted in their respective action counts.
- Total number of alerts which needs action to be taken in the system.
Create a top metric utilization widget
The top metric utilization widget displays the latest or last six hours aggregate values of the top resources for CPU, Disk, Memory, Interfaces, WANLink Utilization.
- Select Dashboard.
- Select a client from the All Clients list.
- Select + Add Widget > OTHER PREDEFINED WIDGET section.
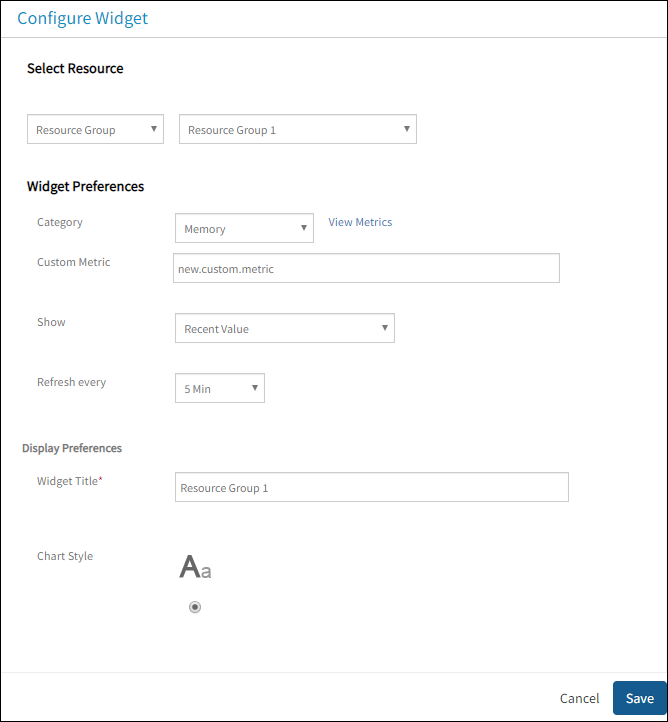
- Select Top Metric Utilization, enter the following information, and Save:
- Select Resource to select one of the following:
- All Resources
- Resource Group
- Service Group
- Site
- Kubernetes
- Docker
- Widget Preferences to enter the following information:
- Category: Type of metric that you want to display in the Dashboard. Click View Metrics for metrics information associated with the selected category.
- Custom Metric: Metric that you can provide apart from the values displayed in View Metrics.
- Show: Data displayed in the selected time frame.
Example: Recent Value. - Refresh every: Time available to update the data displayed in the Dashboard.
- Display Preferences to enter the following information:
- Widget Title: Name that you want to display as the widget title in the dashboard.
- Chart Style: HTML format to display data.
- Select Resource to select one of the following:
Create an alert trend widget
The alert trend widget displays the total non-acknowledged critical and warning alerts over a specific time duration.
- Select Dashboards > Classic Dashboard.
- Select a client from the All Clients list.
- Click + Add Widget and go to the MOST USED WIDGET section.
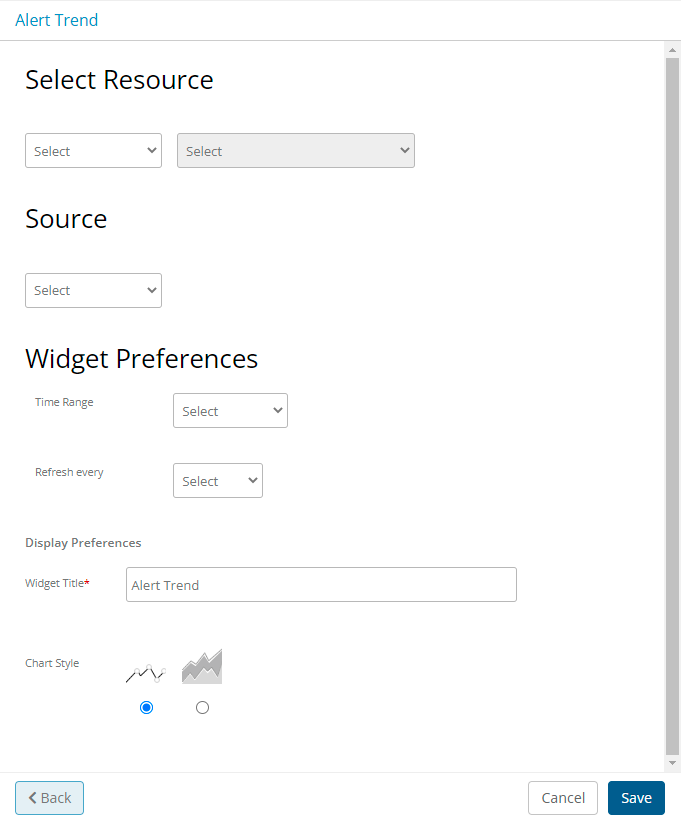
- Select Alert Trend, enter the following information, and Save:
- Select Resources to select the resource.
- Source to select the source.
- Widget Preferences to enter the following information:
- Time Range: Data displayed in the selected time frame. For example, Last 1 day.
- Refresh every: Time available to update the data displayed in the Dashboard.
- Display Preferences to enter the following information:
- Widget Title: Name that you want to display as the widget title in the dashboard.
- Chart Style: One of the following formats to display data.
- LINE CHART
- AREA CHART
Create a patch compliance widget
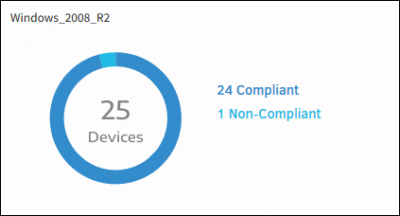
The patch compliance widget displays the compliance status for a set of devices at a specific baseline. The widget provides the compliance status of a group of devices using the latest compliance data available.
The Patch Compliance widget provides the following types of data:
- Number of non-compliant devices
- Number of compliant devices
For example, in a resource group Application Server of 25 devices and a baseline with a group of patches, the compliance is calculated for the baseline against the 25 devices and the compliance data is populated accordingly.
- Select Dashboard.
- Select a client from the All Clients list.
- Select + Add Widget > OTHER PREDEFINED WIDGET section.
- Select Patch Compliance, enter the following information, and Save.
- Resource Group: Name of the selected resource group.
- Baseline: Selected baseline.
- Widget Preferences, select time available to update the data displayed in the Dashboard.
- Display Preferences to enter the following information:
- Widget Title: Name that you want to display as the widget title in the dashboard.
- Chart Style: One of the following formats to display data.
- DONUT CHART
- PIE CHART
- COLUMN CHART
To show the number compliant and non-compliant resources, select a baseline. For example:
- Resource Group: Application Server
- Baseline: Windows_2008_R2
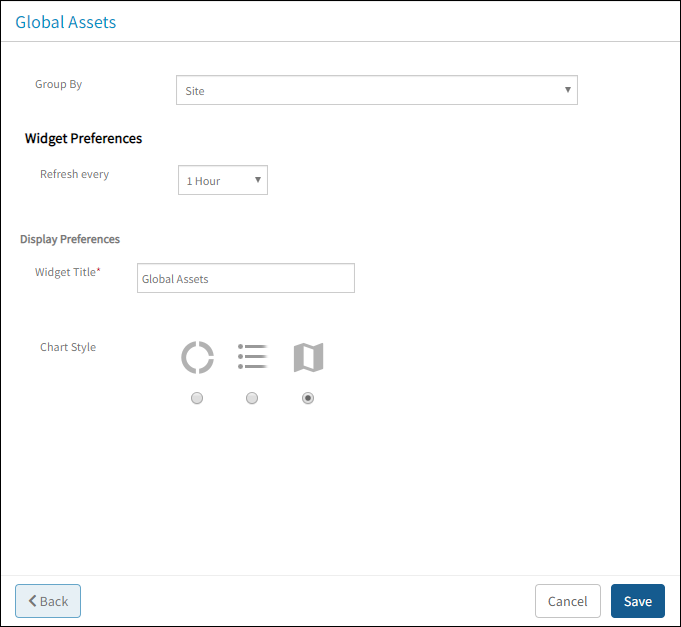
Create a global assets widget
Global assets widget shows the geographical distribution of your IT assets that includes assets in your data center and in the cloud.
To find your data center on the geographical map, adding a site is required.
- Go to Infrastructure > Site to add a site location.
- (Required) City, State, and Country fields are required when adding a site location
with the
Global Assetswidget.
- Select Dashboard.
- Select a client from the All Clients list.
- Select + Add Widget > OTHER PREDEFINED WIDGET section.
- Go to Global Assets, enter the following information, and Save:
- Group By drop-down, select one of the following options:
- Region
- Cloud Account
- Tags
- Provider Type
- Site
- Resource Type
- Device Type
- Widget Preferences to configure the Refresh time.
- Display Preferences to enter the following information:
- Widget Title: Name that you want to display as the widget title in the dashboard.
- Chart Style: One of the following charts:
- DONUT CHART
- LINE CHART
- GEO CHART
- Group By drop-down, select one of the following options:
View a cloud cost widgets
Cloud Cost Insights widget
The cloud cost insights widget shows Months-to-Date spends of the public cloud by default. Choose a different timeline to show total spending for a specific time period. View a breakdown of spending by cloud account or by custom attributes. Example: Business units and other attributes.
Cloud Cost Trend widget
The cloud cost trend widget shows a trend of spending on public clouds over a period of time. You can view the trend by resource type, custom attributes, and other attributes.