Introduction
Meraki provides networking solutions for cloud-controlled WiFi, routing, and security.
Retrieve Host Name and Secret Key
To install the Meraki integration in OpsRamp, you need to retrieve the host name and API key from the Meraki dashboard.
- Cisco Meraki has announced a change to its Dashboard API base URLs, effective November 17, 2025.To ensure uninterrupted connectivity between OpsRamp and Meraki, customers must update their integration settings with the correct hostname based on their region.
| Region | Base URI (Hostname) |
|---|---|
| Global | api.meraki.com |
| Canada | api.meraki.ca |
| China | api.meraki.cn |
| India | api.meraki.in |
| U.S. (FedRAMP) | api.gov-meraki.com |
To verify base URI, refer to the Getting Started.
See Support for Cisco Meraki Dashboard API Base URL Update for more details.
Navigate to My Profile.
Scroll down to find the option to Generate new API Key.

Click Generate new API Key to generate a new API key.Save the generated API key to use as the key during OpsRamp integration.
Configure and install the integration
- From All Clients, select a client.
- Navigate to Setup > Account.
- Select the Integrations and Apps tab.
- The Installed Integrations page, where all the installed applications are displayed. If there are no installed applications, it will navigate to the Available Integrations and Apps page.
- Click + ADD on the Installed Integrations page. The Available Integrations and Apps page displays all the available applications along with the newly created application with the version.
- Search for the application using the search option available. Alternatively, use the All Categories option to search.
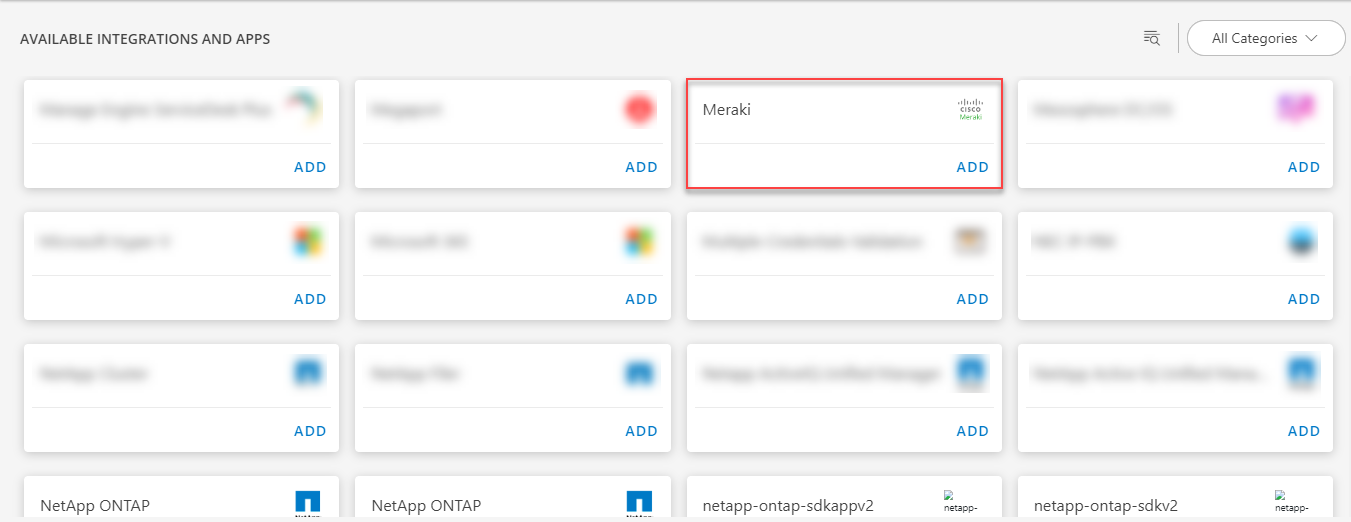
- Click ADD in the Meraki application.
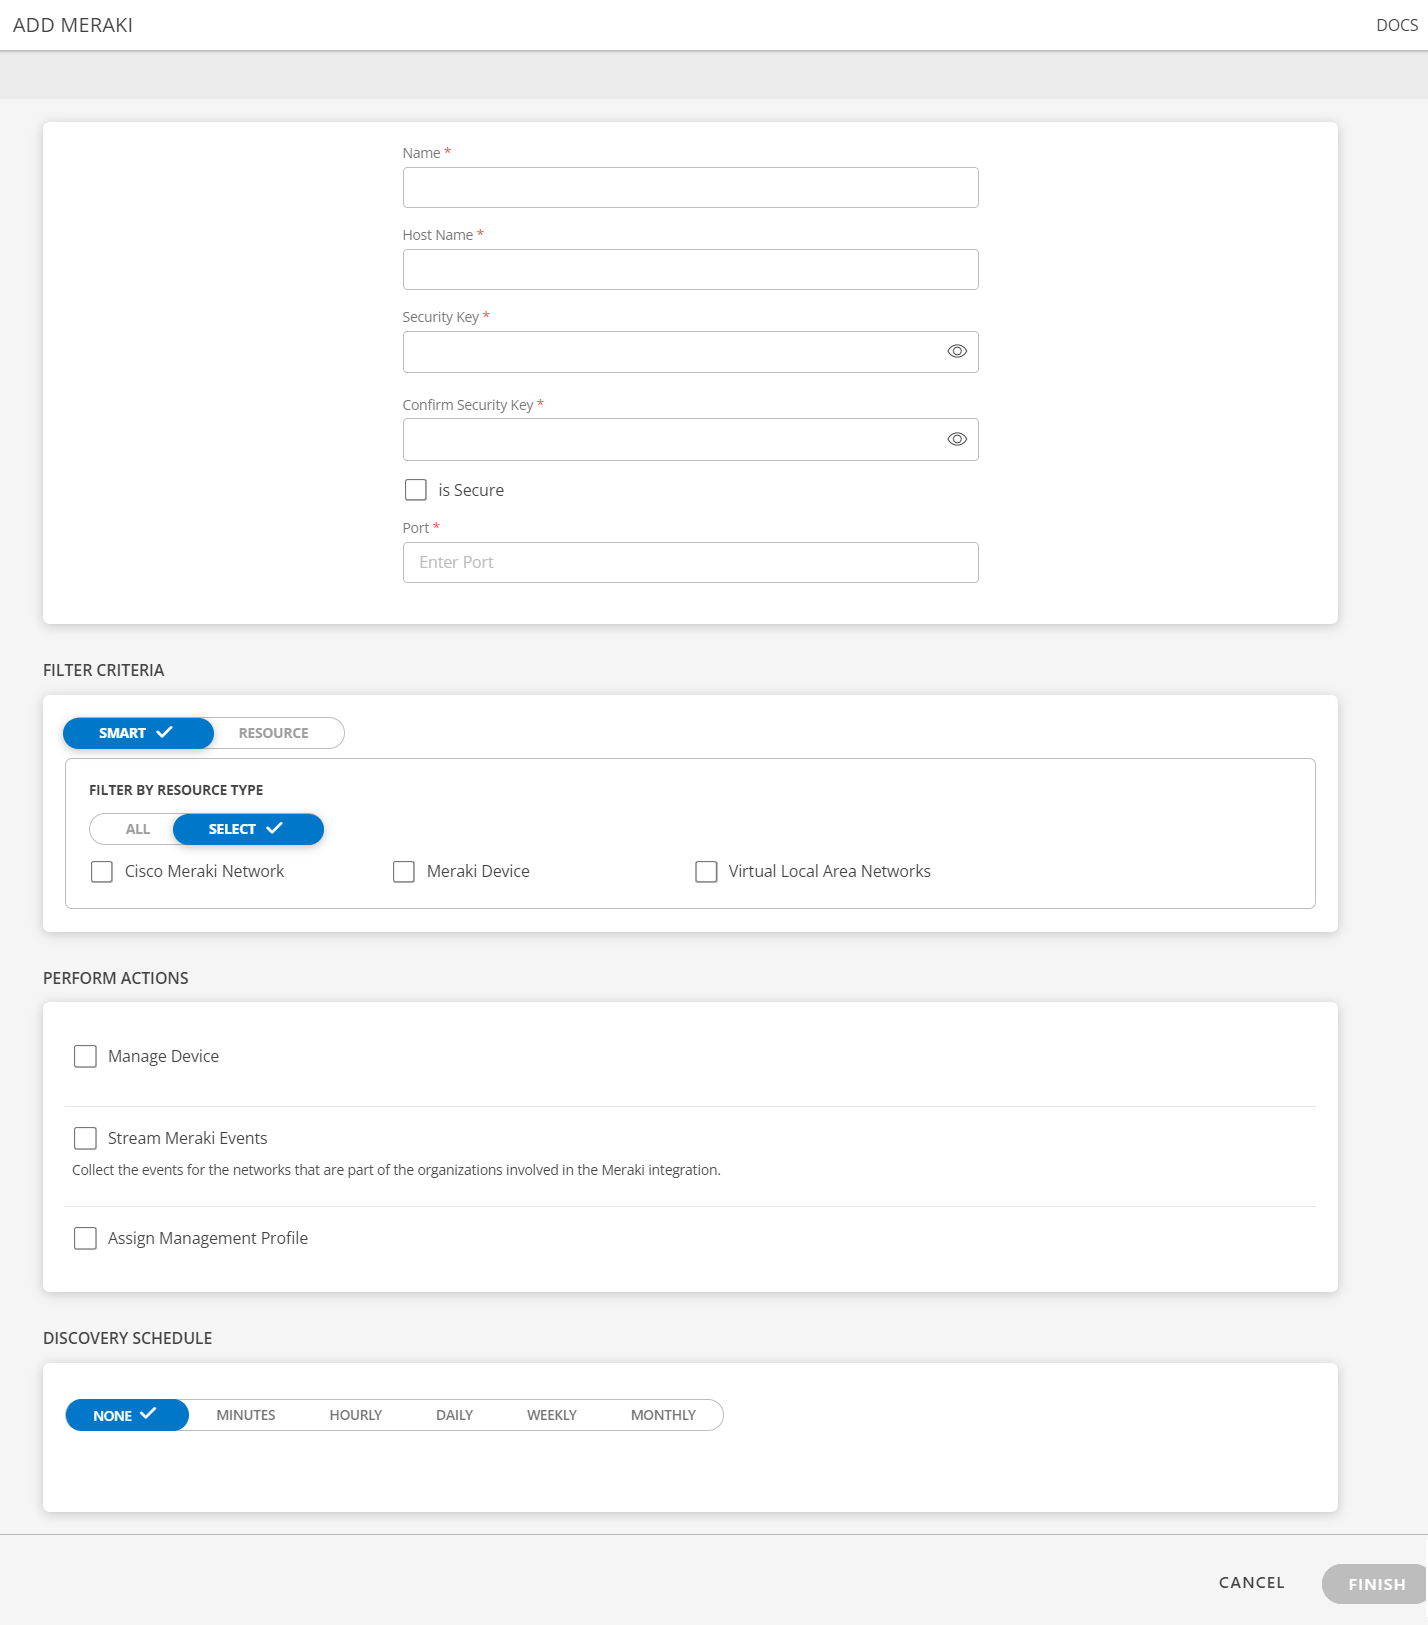
- In the Configuration page, enter the below information:
| Functionality | Description |
|---|---|
| Name | Enter the name for the configuration. |
| Host Name | The domain name of the Meraki server.Use the host name generated from Meraki dashboard. See Retrieve Host Name and Secret Key for more details. |
| Security Key | Enter the security key.Use the API key generated from Meraki dashboard. See See Retrieve Host Name and Secret Key for more details. |
| Confirm Security Key | Enter the security key again. |
| is Secure | (Optional), Select the is Secure checkbox. |
| Port | In the port box, type or select the port details. The default port is 443. |
- From the FILTER CRITERIA section, select:
- SMART: Use to filter resources based on the resource type.
- RESOURCE: Use to filter resources based on certain resource attributes.
- In the FILTER BY RESOURCE TYPE section, select:
- ALL: All the existing and future resources will be discovered.
- SELECT: You can select one or multiple resources to be discovered.
- Enter the Key, Operator, and Value information.
- From the Perform Actions section, choose Manage Device to set the resources as managed.
- In the DISCOVERY SCHEDULE section, select recurrence pattern to add one of the following patterns:
- Minutes
- Hourly
- Daily
- Weekly
- Monthly
- Click FINISH.
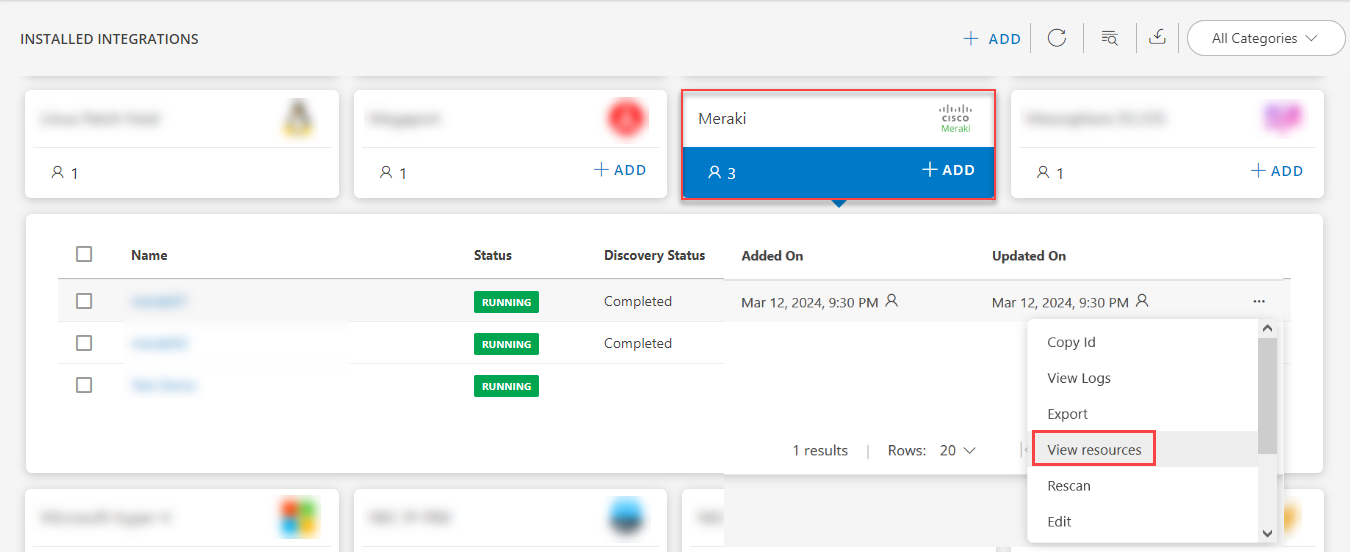
The application is now installed and displayed on the INSTALLED INTEGRATIONS page. Use the search field to find the installed application.
- (Optional), Select the Meraki Integration.
- (Optional), Click the menu (three dots) icon and choose the View resources option.
View the Meraki details
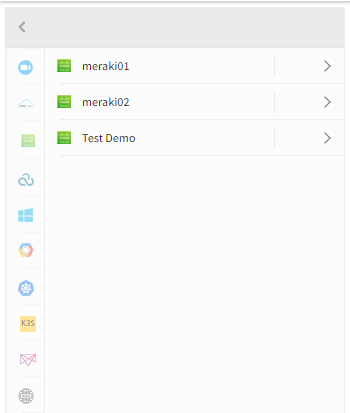
- The Meraki integration is displayed in the Infrastructure > Resources > Meraki.
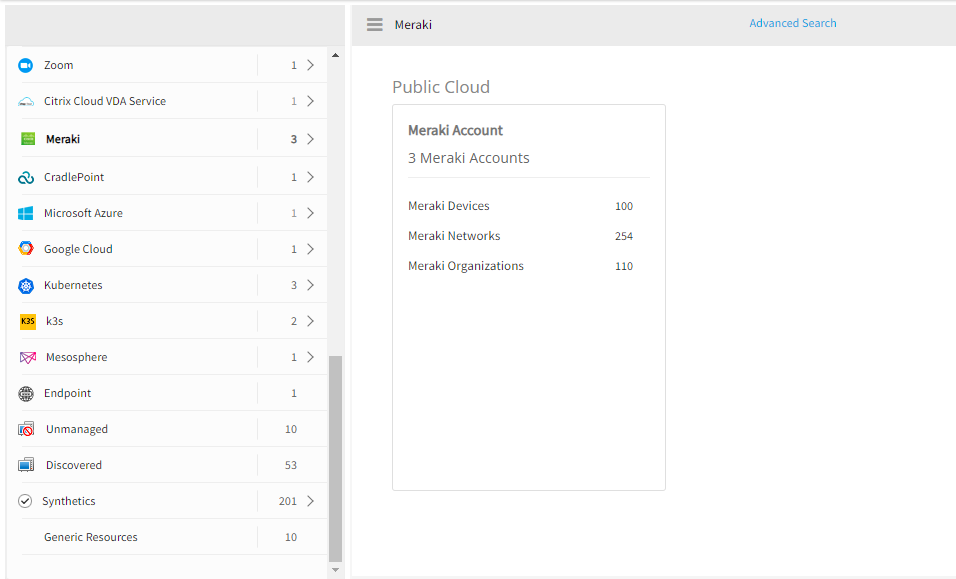
Expand Meraki to view the available integrations as shown below:
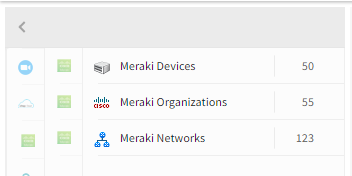
You can further expand the integration to view the available resources as shown below:
After the discovery profile is created, you can assign monitoring templates to the resource.
View Meraki Audit Logs
To view the audit logs of Meraki:
- From All Clients, select a client.
- Navigate to Setup > Account.
- Select the Integrations and Apps tab.
- From the Installed Integrations page, where all the installed applications are displayed, search for Meraki App.
- Select the Meraki App and click on the menu (three dots) icon.
- Select View Logs.
- Select Inbound or Outbound from the dropdown accordingly.
Notes:- By default Outbound is selected.
- Inbound: Incoming calls which come from a third party to OpsRamp.
- Outbound: Outgoing calls which go to third parties from OpsRamp.
- Use the Filter option to filter the logs by Created Time, Status (Canceled, Completed, Failed), Resource Id.
Meraki Events
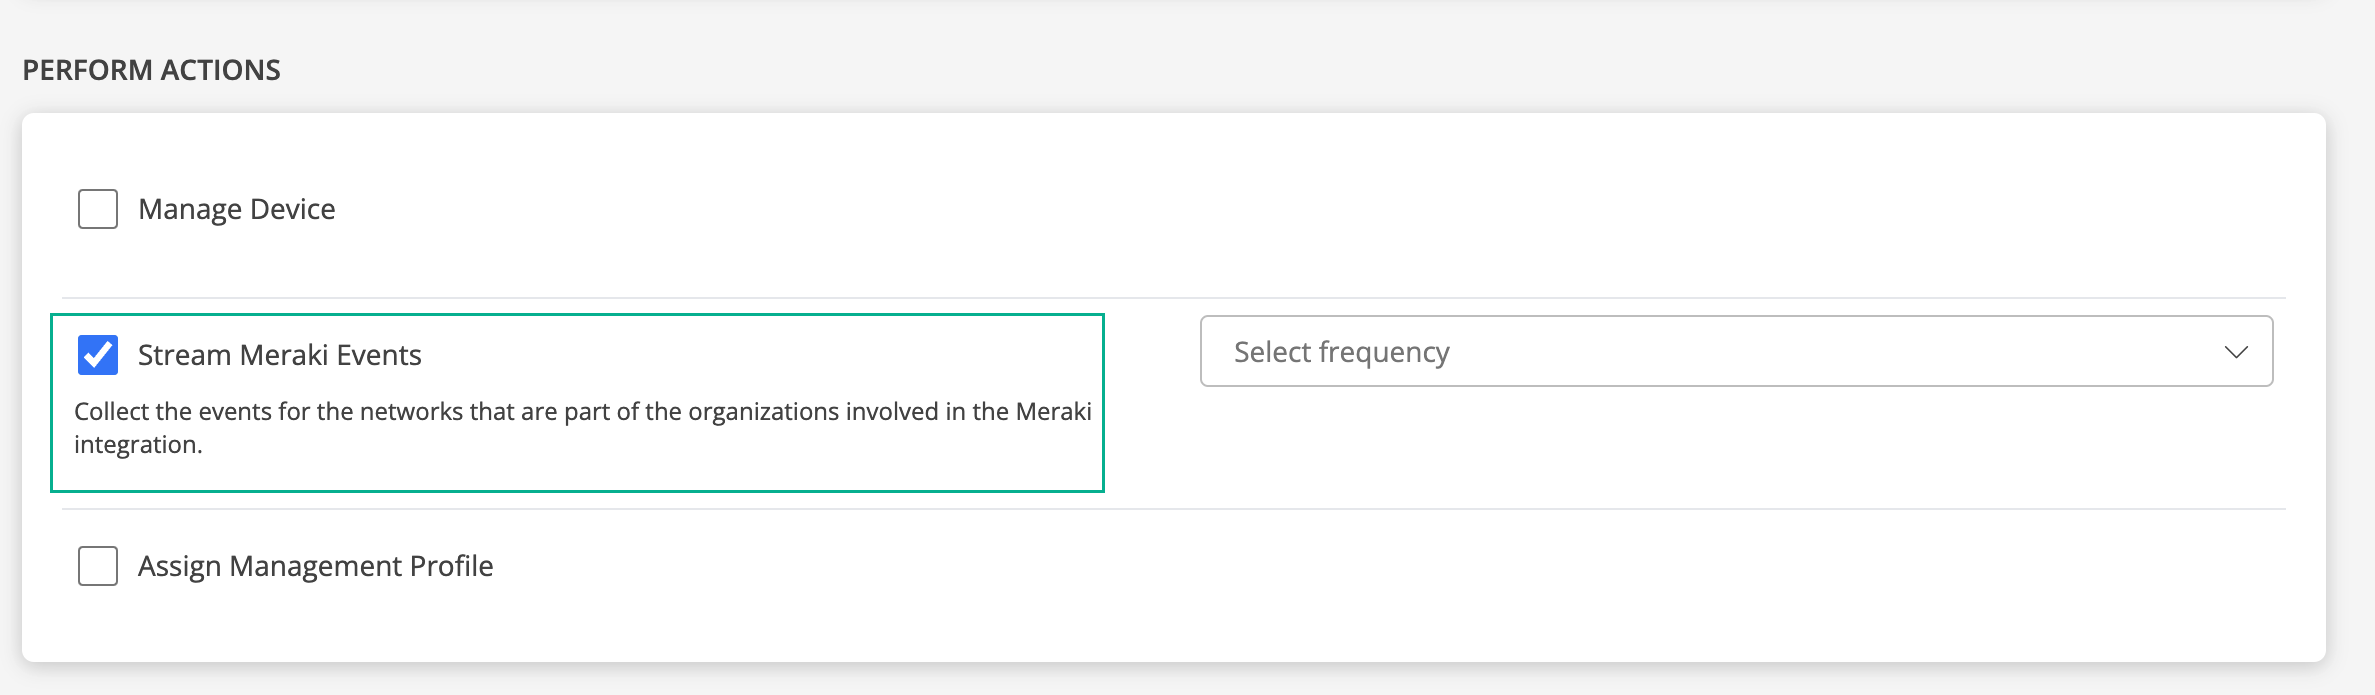
Meraki events can be collected by enabling the Stream Meraki Events option during integration setup. During setup, you can choose the frequency for streaming events, with options such as 15 minutes, 30 minutes, 1 hour, 6 hours, or 1 day. Events will then be collected across all networks linked to the integration based on the selected frequency, and alerts will be generated as required.
For more details on the API used to retrieve Meraki events for each network and the processing of events and alerts, see Get Network Events.
Supported metrics
| Component | Metric/Group Name | Metric Display Name | Units |
|---|---|---|---|
| network | meraki_network_TotalNumOfClientsConnected Total number of clients connected to the network | Meraki Network Number of Clients Connected | count |
| meraki_network_ClientStatus Status of number of clients: 0 = offline, 1 = online | Meraki Network Client Status | null | |
| meraki_network_WirelessConnectionStats_Success Aggregated connectivity information for this network | Meraki Network Wireless Connection Stats Success | count | |
| meraki_network_WirelessLatencyStats_BackgroundTrafficAvg Aggregated latency information of background traffic for this network | Meraki Network Wireless Latency Stats background Traffic | bytes | |
| meraki_network_WirelessLatencyStats_BesteffortTrafficAvg Aggregated latency information of best-effort traffic for this network | Meraki Network Wireless Latency Stats bestEffort Traffic | bytes | |
| meraki_network_WirelessLatencyStats_VideoTrafficAvg Aggregated latency information of video traffic for this network | Meraki Network Wireless Latency Stats video Traffic | bytes | |
| meraki_network_WirelessLatencyStats_VoiceTrafficAvg Aggregated latency information of voice traffic for this network | Meraki Network Wireless Latency Stats Voice Traffic | bytes | |
| wireless | meraki_wireless_DevicesConnectionStats_Success Aggregated connectivity information for a given AP on this network | Meraki Wireless Device Connection Stats success | count | meraki_wireless_DevicesLatencyStats_BackgroundTrafficAvg Aggregated latency information of background traffic for a given AP on this network | Meraki Wireless Device Latency Stats background Traffic | bytes |
| meraki_wireless_DevicesLatencyStats_BesteffortTrafficAvg Aggregated latency information of best-effort traffic for a given AP on this network | Meraki Wireless Device Latency Stats bestEffort Traffic | bytes | |
| meraki_wireless_DevicesLatencyStats_VideoTrafficAvg Aggregated latency information of video traffic for a given AP on this network | Meraki Wireless Device Latency Stats video Traffic | bytes | |
| meraki_wireless_DevicesLatencyStats_VoiceTrafficAvg Aggregated latency information of voice traffic for a given AP on this network | Meraki Wireless Device Latency Stats voice Traffic | bytes | |
| meraki_wireless_DeviceStatus This indicates the status of a wireless device, with the following values:
| Meraki Wireless Device Status | null | |
| switch | meraki_switch_DeviceStatus This indicates the status of a switch device, with the following values:
| Meraki Switch Device Status | null |
| meraki_switch_PortsStatuses_Enabled Switch port status: 0 = false, 1 = true | Meraki Switch Port Enabled | null | |
| meraki_switch_PortsStatuses_status Visual indication of the port connection status over a 24-hr period: 0 = disconnected, 1 = connected | Meraki Switch Port Status | null | |
| meraki_switch_PortsStatuses_UsageTotal Switch port total usage | Meraki Switch Port Total Usage | kilobytes | |
| meraki_switch_PortsStatuses_UsageSent Switch port usage status for the data sent | Meraki Switch Port Usage Sent | kilobytes | |
| meraki_switch_PortsStatuses_UsageRec Switch port usage status for the data received | Meraki Switch Port Usage Received | kilobytes | |
| meraki_switch_PortsStatuses_TrafficTotal Switch port total traffic | Meraki Switch Port Total Traffic | kilobytes/second | |
| meraki_switch_PortsStatuses_TrafficSent Switch port traffic for the data sent | Meraki Switch Port Traffic Sent | kilobytes/second | |
| meraki_switch_PortsStatuses_TrafficRecv Switch port traffic for the data received | Meraki Switch Port Traffic Received | kilobytes/second | |
| meraki_switch_PortsStatuses_SecureConnectEnabled Switch port secure connect enabled status: 0 = false, 1 = true | Meraki Switch Port Secure Connect Enabled | null | |
| meraki_switch_PortsStatuses_SecureConnectActive Switch port secure connect active status: 0 = false, 1 = true | Meraki Switch Port Secure Connect Active | null | |
| meraki_switch_PortsStatuses_SecureConnectAuthenticationStatus Switch port secure connect authentication status: 0 = disabled, 0 = enabled | Meraki Switch Port Secure Connect Authentication Status | null | |
| firewall | meraki_firewall_DeviceStatus This indicates the status of a firewall device, with the following values:
| Meraki Firewall Device Status | megabytes/second |
| meraki_firewall_PerformanceScore Firewall performance score | Meraki Firewall Performance Score | megabytes/second | |
| IP Camera | meraki_ipCamera_DeviceStatus This shows the device status of a IP camera. Offline - 0, Online - 1, dormant - 2, and alerting - 3. | Meraki IpCamera Device Status | null |
| VOIP Device | meraki_voip_DeviceStatus This shows the device status of a VOIP device. Offline - 0, Online - 1, dormant - 2, and alerting - 3. | Meraki Voip Device Status | null |
| Other | meraki_otherDevice_DeviceStatus This shows the device status of other devices. Offline - 0, Online - 1, dormant - 2, and alerting - 3. | Meraki Other Device Status | null |
Note: OpsRamp uses REST API calls to discover and monitor Cisco Meraki resources. The customer must whitelist the OpsRamp firewall IP to discover and Monitor Cisco Meraki resources. Contact OpsRamp support for firewall IP information.