Note
The NetApp Cluster integration will to deprecate by May 30, 2026.
OpsRamp will not allow new installations but will continue supporting existing integrations.. Customers are advised to use the NetApp ONTAP App for all new integrations and future configurations.
Introduction
NetApp cluster is a storage disk array operating system.
Prerequisites
Transport Layer Security (TLS) must be enabled on the NetApp Cluster.
To check the TLS status:
SSH username@hostname
system services web show
If TLS is not enabled: tls.enable on
Example output:
External Web Services: true
               Status: online
   HTTP Protocol Port: 80
  HTTPS Protocol Port: 443
        TLSv1 Enabled: true
        SSLv3 Enabled: true
SSLv2 Enabled: true| Supported Versions |
|---|
| ONTAP API cluster-mode APIs |
| NetApp Cluster version 8.2.2 |
Supported Metrics
Click here to view the supported metrics
| Metric Name | Metric Display Name | Units |
|---|---|---|
| aggregate.total_transfers Total number of disk operations serviced by the aggregate | netapp.cluster.aggregate.total_transfers | count/second |
| aggregate.user_reads Number of user read operations performed by the aggregate | netapp.cluster.aggregate.user_reads | count/second |
| aggregate.user_writes Number of user write operations performed by the aggregate | netapp.cluster.aggregate.user_writes | count/second |
| aggregate.cp_reads Number of read operations to the aggregate during consistency-point processing | netapp.cluster.aggregate.cp_reads | count/second |
| aggregate.user_read_blocks Number of blocks transferred for user read operations | netapp.cluster.aggregate.user_read_blocks | count/second |
| aggregate.user_write_blocks Number of blocks transferred for user write operations | netapp.cluster.aggregate.user_write_blocks | count/second |
| aggregate.cp_read_blocks Number of blocks transferred for consistency-point read operations | netapp.cluster.aggregate.cp_read_blocks | count/second |
| disk.total_transfers Total number of disk operations performed by the aggregate | netapp.cluster.disk.total_transfers | count/second |
| disk.user_reads Number of user read operations performed by the aggregate | netapp.cluster.disk.user_reads | count/second |
| disk.user_writes Number of user write operations performed by the aggregate | netapp.cluster.disk.user_writes | count/second |
| disk.cp_reads Number of read operations to the aggregate during consistency point processing | netapp.cluster.disk.cp_reads | count/second |
| disk.guarenteed_read_blocks Number of blocks transferred for guaranteed read operations per second | netapp.cluster.disk.guarenteed_read_blocks | count/second |
| disk.guarenteed_write_blocks Number of blocks transferred for guaranteed write operations per second | netapp.cluster.disk.guarenteed_write_blocks | count/second |
| disk.user_read_blocks Number of blocks transferred for user read operations | netapp.cluster.disk.user_read_blocks | count/second |
| disk.user_write_blocks Number of blocks transferred for user write operations | netapp.cluster.disk.user_write_blocks | count/second |
| disk.cp_read_blocks Number of blocks transferred for consistency-point read operations | netapp.cluster.disk.cp_read_blocks | count/second |
| ifnet.recv_packets Packets received per second | netapp.cluster.ifnet.recv_packets | count/second |
| ifnet.recv_errors Errors per second while receiving packets | netapp.cluster.ifnet.recv_errors | count/second |
| ifnet.send_packets Packets sent per second | netapp.cluster.ifnet.send_packets | count/second |
| ifnet.send_errors Errors per second while sending packets | netapp.cluster.ifnet.send_errors | count/second |
| ifnet.collisions Collisions per second on CSMA interfaces | netapp.cluster.ifnet.collisions | count/second |
| ifnet.recv_data Total bytes received per second | netapp.cluster.ifnet.recv_data | bytes/second |
| ifnet.send_data Total bytes sent per second | netapp.cluster.ifnet.send_data | bytes/second |
| ifnet.recv_mcasts Packets received per second through multicast | netapp.cluster.ifnet.recv_mcasts | count/second |
| ifnet.send_mcasts Packets sent per second through multicast | netapp.cluster.ifnet.send_mcasts | count/second |
| lun.read_ops Read operations per second | netapp.cluster.lun.read_ops | count/second |
| lun.write_ops Write operations per second | netapp.cluster.lun.write_ops | count/second |
| lun.other_ops Other operations per second | netapp.cluster.lun.other_ops | count/second |
| lun.read_data Read bytes per second | netapp.cluster.lun.read_data | bytes/second |
| lun.write_data Write bytes per second | netapp.cluster.lun.write_data | bytes/second |
| lun.total_ops Total number of operations on the LUN | netapp.cluster.lun.total_ops | count/second |
| lun.queuefull Queue full responses per second | netapp.cluster.lun.queuefull | count/second |
| system.net_data_recv Network KB received per second | netapp.cluster.system.net_data_recv | kilobytes/second |
| system.net_data_sent Network KB sent per second | netapp.cluster.system.net_data_sent | kilobytes/second |
| system.disk_data_read Disk KB read per second | netapp.cluster.system.disk_data_read | kilobytes/second |
| system.disk_data_written Disk KB written per second | netapp.cluster.system.disk_data_written | kilobytes/second |
| system.total_ops Total operations per second | netapp.cluster.system.total_ops | count/second |
| system.read_ops Read operations per second | netapp.cluster.system.read_ops | count/second |
| system.write_ops Write operations per second | netapp.cluster.system.write_ops | count/second |
| system.cifs_ops CIFS operations per second | netapp.cluster.system.cifs_ops | count/second |
| system.fcp_ops FCP operations per second | netapp.cluster.system.fcp_ops | count/second |
| system.http_ops HTTP operations per second | netapp.cluster.system.http_ops | count/second |
| system.iscsi_ops iSCSI operations per second | netapp.cluster.system.iscsi_ops | count/second |
| system.nfs_ops NFS operations per second | netapp.cluster.system.nfs_ops | count/second |
| volume.total_ops Number of operations performed by the volume | netapp.cluster.volume.total_ops | count/second |
| volume.read_ops Number of reads to the volume | netapp.cluster.volume.read_ops | count/second |
| volume.read_data Bytes read from the volume | netapp.cluster.volume.read_data | bytes/second |
| volume.write_data Bytes written to the volume | netapp.cluster.volume.write_data | bytes/second |
| volume.other_ops Number of other operations to the volume | netapp.cluster.volume.other_ops | count/second |
| volume.write_ops Number of writes to the volume | netapp.cluster.volume.write_ops | count/second |
| volume.nfs_read_ops Number of NFS reads to the volume | netapp.cluster.volume.nfs_read_ops | count/second |
| volume.nfs_write_ops Number of NFS writes to the volume | netapp.cluster.volume.nfs_write_ops | count/second |
| volume.nfs_other_ops Number of other NFS operations to the volume | netapp.cluster.volume.nfs_other_ops | count/second |
| volume.cifs_read_ops Number of CIFS reads to the volume | netapp.cluster.volume.cifs_read_ops | count/second |
| volume.cifs_write_ops Number of CIFS writes to the volume | netapp.cluster.volume.cifs_write_ops | count/second |
| volume.cifs_other_ops Number of other CIFS operations to the volume | netapp.cluster.volume.cifs_other_ops | count/second |
| volume.san_read_ops Number of block protocol reads to the volume | netapp.cluster.volume.san_read_ops | count/second |
| volume.san_write_ops Number of block protocol writes to the volume | netapp.cluster.volume.san_write_ops | count/second |
| volume.san_other_ops Number of other block protocol operations to the volume | netapp.cluster.volume.san_other_ops | count/second |
| volume.flexcache_other_ops Number of other FlexCache operations to the volume | netapp.cluster.volume.flexcache_other_ops | count/second |
| volume.flexcache_read_ops Number of FlexCache read operations from the volume | netapp.cluster.volume.flexcache_read_ops | count/second |
| volume.flexcache_write_ops Number of FlexCache write operations to the volume | netapp.cluster.volume.flexcache_write_ops | count/second |
| volume:vserver.other_ops Number of other operations to the volume at the Vserver level | netapp.cluster.volume:vserver.other_ops | count/second |
| volume:vserver.read_data Bytes read from the volume at the Vserver level | netapp.cluster.volume:vserver.read_data | bytes/second |
| volume:vserver.read_ops Number of reads to the volume, at the Vserver level | netapp.cluster.volume:vserver.read_ops | count/second |
| volume:vserver.total_ops Number of operations performed by the volume at the Vserver level | netapp.cluster.volume:vserver.total_ops | count/second |
| volume:vserver.write_data Bytes written to the volume, at the Vserver level | netapp.cluster.volume:vserver.write_data | bytes/second |
| volume:vserver.write_ops Number of writes to the volume, at the Vserver level | netapp.cluster.volume:vserver.write_ops | count/second |
| volume:node.other_ops Number of other operations to the volume at the Vserver level | netapp.cluster.volume:node.other_ops | count/second |
| volume:node.read_data Bytes read from the volume, at the Vserver level | netapp.cluster.volume:node.read_data | bytes/second |
| volume:node.read_ops Number of reads to the volume, at the Vserver level | netapp.cluster.volume:node.read_ops | count/second |
| volume:node.total_ops Number of operations performed by the volume, at the Vserver level | netapp.cluster.volume:node.total_ops | count/second |
| volume:node.write_data Bytes written to the volume, at the Vserver level | netapp.cluster.volume:node.write_data | bytes/second |
| volume:node.write_ops Number of writes to the volume, at the Vserver level | netapp.cluster.volume:node.write_ops | count/second |
| volume:node.avg_latency Average latency in microseconds for the WAFL file system to process all the operations on the volume | netapp.cluster.volume:node.avg_latency | microseconds |
| volume:node.cifs_other_latency Average time for the WAFL file system to process other CIFS operations to the volume | netapp.cluster.volume:node.cifs_other_latency | microseconds |
| volume:node.cifs_other_ops Number of other CIFS operations to the volume | netapp.cluster.volume:node.cifs_other_ops | count/second |
| volume:node.cifs_read_latency Average time for the WAFL file system to process CIFS read requests to the volume | netapp.cluster.volume:node.cifs_read_latency | microseconds |
| volume:node.cifs_read_ops Number of CIFS reads to the volume | netapp.cluster.volume:node.cifs_read_ops | count/second |
| volume:node.cifs_write_latency Average time for the WAFL file system to process CIFS write requests to the volume | netapp.cluster.volume:node.cifs_write_latency | microseconds |
| volume:node.cifs_write_ops Number of CIFS writes to the volume | netapp.cluster.volume:node.cifs_write_ops | count/second |
| volume:node.flexcache_other_ops Number of other FlexCache operations to the volume | netapp.cluster.volume:node.flexcache_other_ops | count/second |
| volume:node.flexcache_read_ops Number of FlexCache read operations from the volume | netapp.cluster.volume:node.flexcache_read_ops | count/second |
| volume:node.flexcache_write_ops Number of FlexCache write operations to the volume | netapp.cluster.volume:node.flexcache_write_ops | count/second |
| volume:node.nfs_other_latency Average time for the WAFL file system to process other NFS operations to the volume | netapp.cluster.volume:node.nfs_other_latency | microseconds |
| volume:node.nfs_other_ops Number of other NFS operations to the volume | netapp.cluster.volume:node.nfs_other_ops | count/second |
| volume:node.nfs_read_latency Average time for the WAFL file system to process NFS protocol read requests to the volume | netapp.cluster.volume:node.nfs_read_latency | microseconds |
| volume:node.nfs_read_ops Number of NFS reads to the volume | netapp.cluster.volume:node.nfs_read_ops | count/second |
| volume:node.nfs_write_latency Average time for the WAFL file system to process NFS protocol write requests to the volume | netapp.cluster.volume:node.nfs_write_latency | microseconds |
| volume:node.nfs_write_ops Number of NFS writes to the volume | netapp.cluster.volume:node.nfs_write_ops | count/second |
| volume:node.other_latency Average latency in microseconds for the WAFL file system to process other operations to the volume | netapp.cluster.volume:node.other_latency | microseconds |
| volume:node.read_latency Average latency in microseconds for the WAFL file system to process read request to the volume | netapp.cluster.volume:node.read_latency | microseconds |
| volume:node.san_other_latency Average time for the WAFL file system to process other block protocol requests to the volume | netapp.cluster.volume:node.san_other_latency | microseconds |
| volume:node.san_other_ops Number of other block protocol operations to the volume | netapp.cluster.volume:node.san_other_ops | count/second |
| volume:node.san_read_latency Average time for the WAFL file system to process block protocol read requests to the volume | netapp.cluster.volume:node.san_read_latency | microseconds |
| volume:node.san_read_ops Number of block protocol reads to the volume | netapp.cluster.volume:node.san_read_ops | count/second |
| volume:node.san_write_latency Average time for the WAFL file system to process block protocol write requests to the volume | netapp.cluster.volume:node.san_write_latency | microseconds |
| volume:node.san_write_ops Number of block protocol writes to the volume | netapp.cluster.volume:node.san_write_ops | count/second |
| volume:node.write_latency Average latency in microseconds for the WAFL file system to process write request to the volume | netapp.cluster.volume:node.write_latency | microseconds |
| raid.tetris_written Tetrises written per second | netapp.cluster.raid.tetris_written | count/second |
| raid.stripes_written Stripes written per second | netapp.cluster.raid.stripes_written | count/second |
| raid.partial_stripes Partial stripes written per second | netapp.cluster.raid.partial_stripes | count/second |
| raid.full_stripes Full stripes written per second | netapp.cluster.raid.full_stripes | count/second |
| raid.blocks_written Blocks written per second | netapp.cluster.raid.blocks_written | count/second |
| raid.blocks_read Blocks read per second | netapp.cluster.raid.blocks_read | count/second |
| nfsv3.nfsv3_ops Total number of NFSv3 operations | netapp.cluster.nfsv3.nfsv3_ops | count/second |
| nfsv3.nfsv3_read_ops Total NFSv3 read operations | netapp.cluster.nfsv3.nfsv3_read_ops | count/second |
| nfsv3.nfsv3_write_ops Total NFSv3 write operations | netapp.cluster.nfsv3.nfsv3_write_ops | count/second |
| aggregate.raid-status RAID status. Possible values: normal, verifying, SnapMirrored, copying, ironing, mirrored, resyncing, mirror degraded, invalid, needs check, initializing, growing, partial, noparity, degraded, reconstruct, out-of-date, foreign, raid4, raid0, raid_dp, mixed_raid_type. These values may appear by themselves or in combination separated by commas, such as "reconstruct,growing". An aggregate could be of only one of the following RAID types: | netapp.cluster.aggregate.raid-status | text |
| aggregate.state Aggregate state. The possible values: "creating", "destroying", "failed", "frozen", "inconsistent", "iron_restricted", "mounting", "offline", "online", "partial", "quiesced", "quiescing", "restricted", "reverted", "unknown", "unmounted", "unmounting". | netapp.cluster.aggregate.state | text |
| aggregate.percent-used-capacity The percentage of disk space currently in use on the referenced file system. | netapp.cluster.aggregate.percent-used-capacity | percent |
| aggregate.size-available Number of bytes still available in the referenced file system. If the referenced file system is restricted or offline, a value of 0 is returned. | netapp.cluster.aggregate.size-available | bytes |
| aggregate.size-total Total size (in bytes) of the referenced file system. If the referenced file system is restricted or offline, a value 0 is returned. | netapp.cluster.aggregate.size-total | bytes |
| aggregate.size-used Number of bytes used in the referenced file system. If the referenced file system is restricted or offline, a value of 0 is returned. | netapp.cluster.aggregate.size-used | bytes |
| cf.node-state State of the storage failover of the node. Refer API for possible values. | netapp.cluster.cf.node-state | text |
| cf.state If state equals "takeover_failed", this is the reason for the takeover failure. | netapp.cluster.cf.state | text |
| diagnosis.status Overall system health (ok,ok-with-suppressed,degraded,unreachable) as determined by the diagnosis framework. Attributes: non-creatable, non-modifiable | netapp.cluster.diagnosis.status | text |
| storage-disk.is-offline True if disk is offline. Omitted if excluded by 'desired-attributes'. | netapp.cluster.storage-disk.is-offline | boolean |
| storage-disk.is-prefailed True if the admin issued a 'disk fail' or if the the system marked this disk for Rapid RAID Recovery. This flag is expected to remain set until the system has copied the contents of this disk to a system-selected replacement disk. At that point, this disk is expected to be removed from service and placed in in the broken pool. Omitted if excluded by 'desired-attributes'. | netapp.cluster.storage-disk.is-prefailed | boolean |
| storage-disk.is-replacing True if the admin issued 'disk replace' to replace this disk with a specified replacement disk. This flag is expected to remain true until the system has copied the contents of this disk to the admin-specified replacement disk. At that point this disk is expected to be released to the spare pool. Omitted if excluded by 'desired-attributes'. | netapp.cluster.storage-disk.is-replacing | boolean |
| storage-disk.is-zeroed True if disk is in pre-zeroed state. Omitted if excluded by 'desired-attributes'. | netapp.cluster.storage-disk.is-zeroed | boolean |
| storage-disk.bytes-per-sector Number of bytes per disk sector. A sector count element, such as 'capacity-sectors' and 'right-size-sectors', may be multiplied by this value to convert to a byte count. Omitted if excluded by 'desired-attributes'. | netapp.cluster.storage-disk.bytes-per-sector | bytes |
| storage-disk.capacity-sectors Total number of disk sectors on this disk, given in units of 'bytes-per-sector'. Omitted if excluded by 'desired-attributes'. | netapp.cluster.storage-disk.capacity-sectors | bytes |
| storage-disk.right-size-sectors Number of usable disk sectors that remain after subtracting the right-size adjustment for this disk. Given in units of 'bytes-per-sector'. Omitted if information is unavailable, or if excluded by 'desired-attributes'. | netapp.cluster.storage-disk.right-size-sectors | bytes |
| lun.online State of the LUN, ("online" or "offline"). "true" if online, "false" otherwise. | netapp.cluster.lun.online | boolean |
| lun.size Size of this LUN in bytes in the active FS. This field is unavailable while the LUN is fenced for a restore operation. | netapp.cluster.lun.size | bytes |
| lun.size-used Number of bytes used by this LUN. This field is unavailable while the LUN is fenced for a restore operation. | netapp.cluster.lun.size-used | bytes |
| qtree.status Status of the qtree. Possible values include: "snapvaulted", "snapmirrored", "normal", and "readonly". | netapp.cluster.qtree.status | text |
| snapmirror.mirror-state Specifies the mirror state of the SnapMirror relationship. Possible values are: | netapp.cluster.snapmirror.mirror-state | text |
| volume.state State of the volume. Possible values: "offline", "online", "restricted" and "unknown" for both flexible and traditional volumes, and "creating", "failed", and "partial" specifically for traditional volumes. | netapp.cluster.volume.state | text |
| volume.size Filesystem size (in bytes) of the volume. This is the total usable size of the volume, not including WAFL reserve. | netapp.cluster.volume.size | bytes |
| volume.size-available The size (in bytes) that is still available in the volume. This field is valid only when the volume is online. | netapp.cluster.volume.size-available | bytes |
| volume.size-used The size (in bytes) that is used in the volume. This field is valid only when the volume is online. | netapp.cluster.volume.size-used | bytes |
| volume.percentage-size-used Percentage of the volume size that is used. This field is valid only when the volume is online. | netapp.cluster.volume.percentage-size-used | percent |
| volume.snapshot-reserve-size The size (in bytes) in the volume set aside as reserve for snapshot usage. | netapp.cluster.volume.snapshot-reserve-size | bytes |
| volume.size-available-for-snapshots Total free space (in bytes) available in the volume and the snapshot reserve. | netapp.cluster.volume.size-available-for-snapshots | bytes |
| system.size-total System total size | netapp.cluster.system.size-total | bytes |
| system.size-used System used size | netapp.cluster.system.size-used | bytes |
| system.utilization System Utilization | netapp.cluster.system.utilization | percent |
| vserver.state State of the Vserver. This field represents the data serving ability of a Vserver, | netapp.cluster.vserver.state | text |
| cluster-peer.is-cluster-healthy The status of peer cluster health. Attributes: non-creatable, non-modifiable | netapp.cluster.cluster-peer.is-cluster-healthy | boolean |
| system.is-node-healthy This parameter is used to determine health of a node in a cluster. A boolean value | netapp.cluster.system.is-node-healthy | boolean |
| net.administrative-status Specifies the administrative status of the LIF. Possible values: 'up', 'down', 'unknown' | netapp.cluster.net.administrative-status | text |
| netapp.cluster.aggregate.snapshot-reserved-percentage space reserved for aggregate Snapshot copies in the aggregate | Netapp Cluster Aggregate Snapshot Reserved Percentage | percent |
| netapp.cluster.aggregate.aggr-over-commitment An over-committed aggregate is one in which the total space allocated to volumes exceeds that of what is allowable by the containing aggregate | Netapp Cluster Aggregate Aggr Over Commitment | percent |
| netapp.cluster.volume.percentage-snapshots-reserved space reserved for volume Snapshot copies in the volume | Netapp Cluster Volume Percentage Snapshots Reserved | percent |
| netapp.cluster.volume.spacefull-threshold-percentage Specifies the percentage at which a volume is considered full. | Netapp Cluster Volume Spacefull Threshold Percentage | percent |
| netapp.cluster.volume.volume-snapshot-count Specifies the number of snapshots in the volume | Netapp Cluster Volume Volume Snapshot Count | count |
| netapp.cluster.volume.grow-threshold-percentage Specifies the percentage at which volume growth rate is considered to be normal before the system generates a Volume Growth Rate Abnormal event | Netapp Cluster Volume Grow Threshold Percentage | percent |
| netapp.cluster.volume.over-dedupplication Over deduplication is the effective deduplication-enabled storage of more logical bytes of data in a volume container than are actually allotted to that container | Netapp Cluster Volume Over Dedupplication | — |
| netapp.cluster.volume.tooold-snapshot Specifies about the snapshots created before 52weeks | Netapp Cluster Volume Too Old Snapshot | seconds |
| netapp.cluster.snapmirror.lag-time Lag time is the amount of time by which the destination system lags behind the source system. | Netapp Cluster Snapmirror Lag Time | milliseconds |
Configure and Install the integration
- From All Clients, select a client.
- Navigate to Setup > Account.
- Select the Integrations and Apps tab.
- The Installed Integrations page, where all the installed applications are displayed. If there are no installed applications, it will navigate to the Available Integrations and Apps page.
- Click + ADD on the Installed Integrations page. The Available Integrations and Apps page displays all the available applications along with the newly created application with the version.
Note: Search for the application using the search option available. Alternatively, use the All Categories option to search.
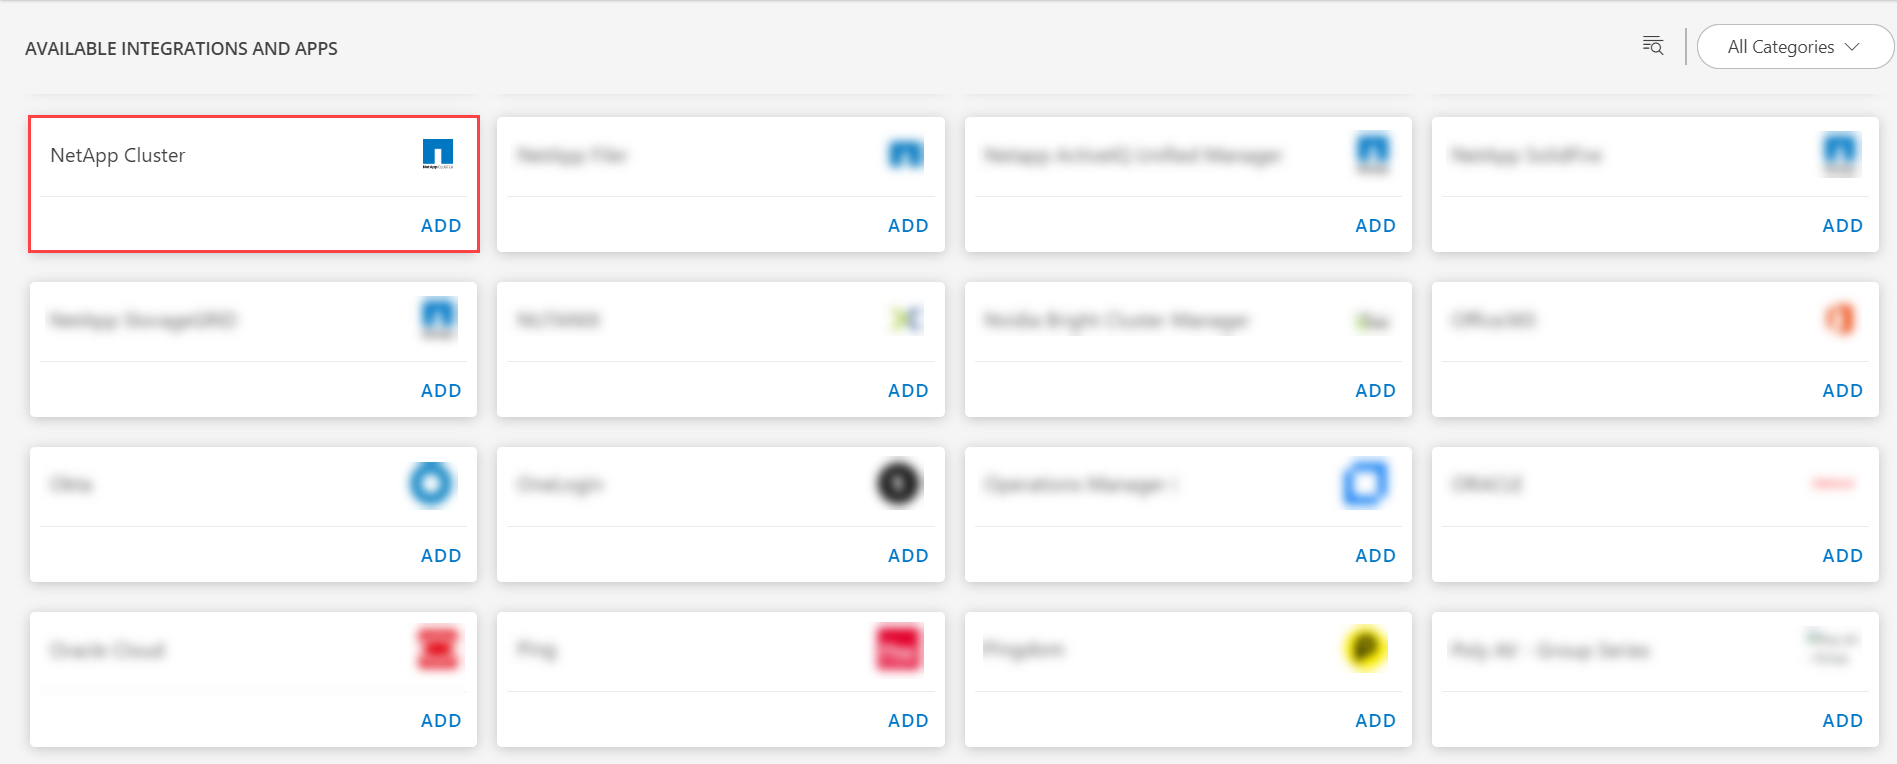
- Click ADD in the NetApp Cluster tile.
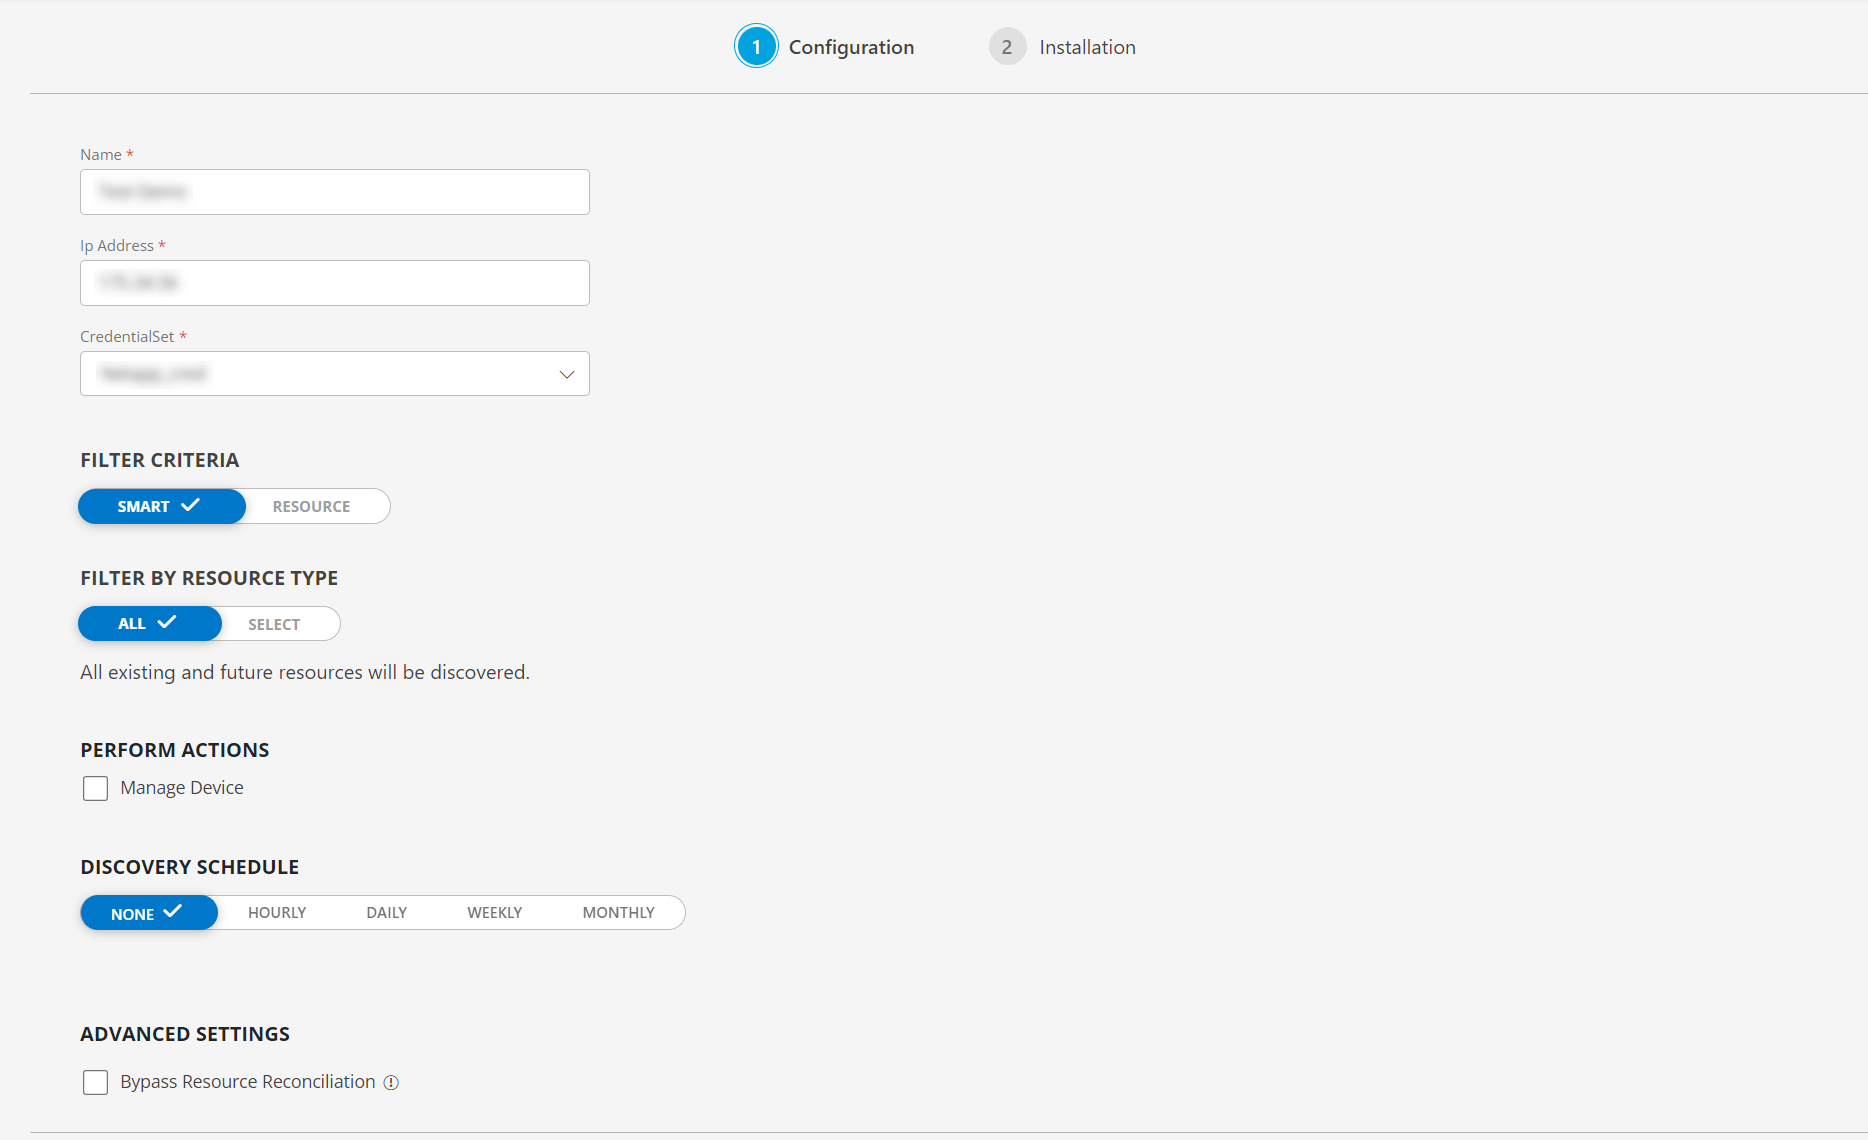
- In the Configurations page, enter the below mentioned information:
| Functionality | Description |
|---|---|
| Name | Enter the name for the configuration. |
| Ip Address | Enter the Ip Address. |
| Credential | Select the Credential from the drop-down list. Notes:
|
From the FILTER CRITERIA section, select:
- SMART: Use to filter resources based on the resource type.
- RESOURCE: Use to filter resources based on certain resource attributes.
In the FILTER BY RESOURCE TYPE section, select:
- ALL: All the existing and future resources will be discovered.
- SELECT: You can select one or multiple resources to be discovered.
From the Perform Actions section, choose Manage Device to set the resources as managed.
In the DISCOVERY SCHEDULE section, select recurrence pattern to add one of the following patterns:
- Minutes
- Hourly
- Daily
- Weekly
- Monthly
(Optional) Under the ADVANCED SETTINGS, Select the Bypass Resource Reconciliation option, if you wish to bypass resource reconciliation when encountering the same resources discovered by multiple applications.
Note: If two different applications provide identical discovery attributes, two separate resources will be generated with those respective attributes from the individual discoveries.Click NEXT.
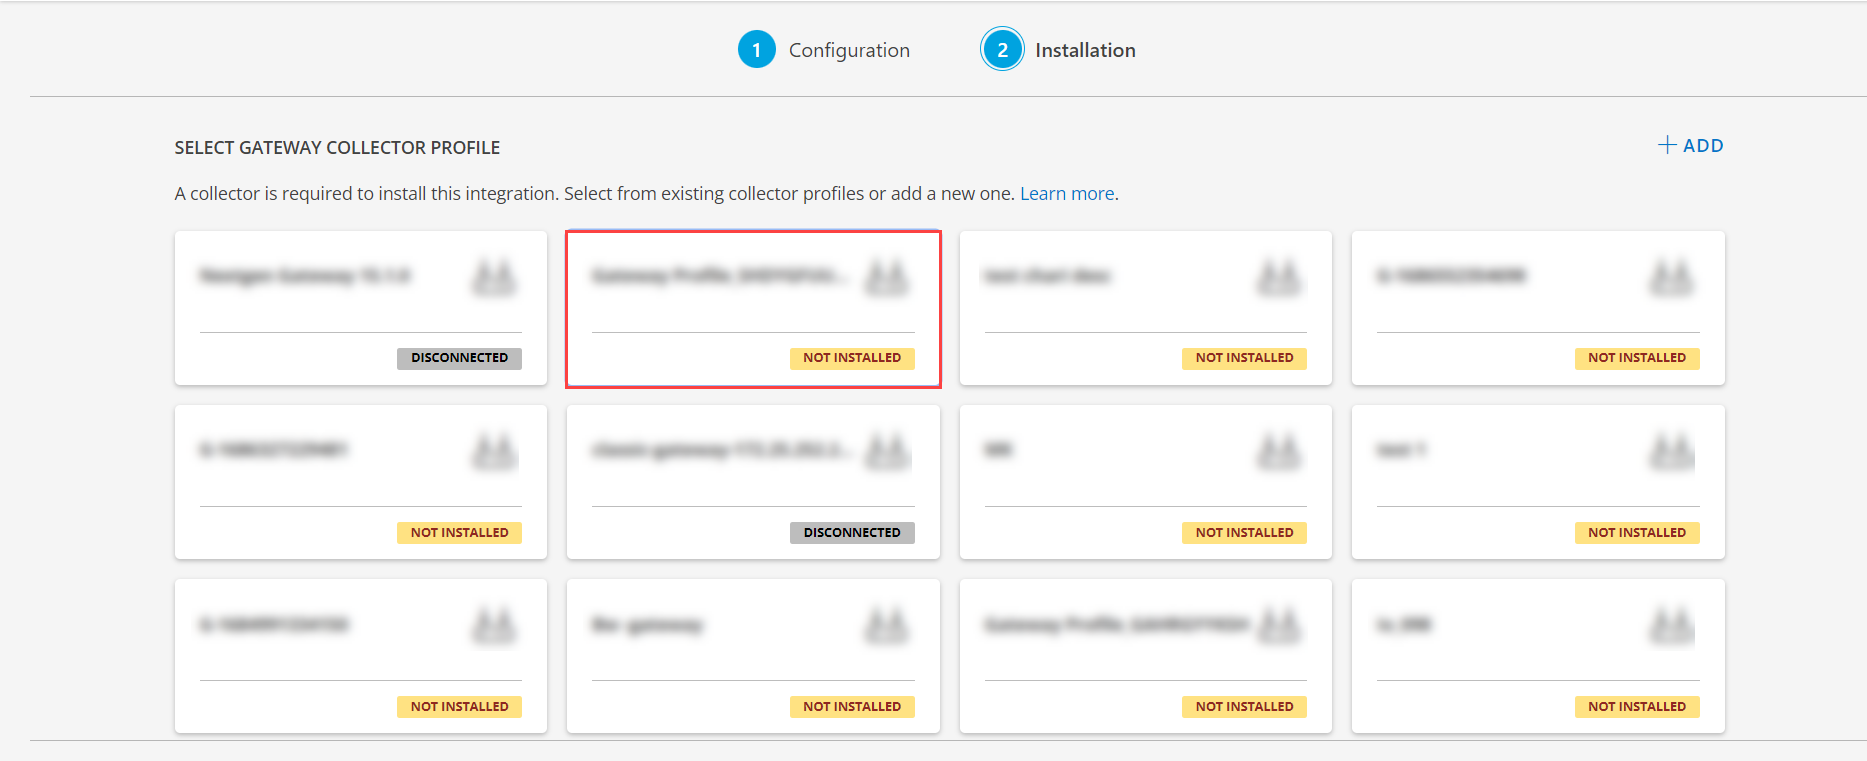
- (Optional) Click +ADD to create a new collector by providing a name or use the pre-populated name.
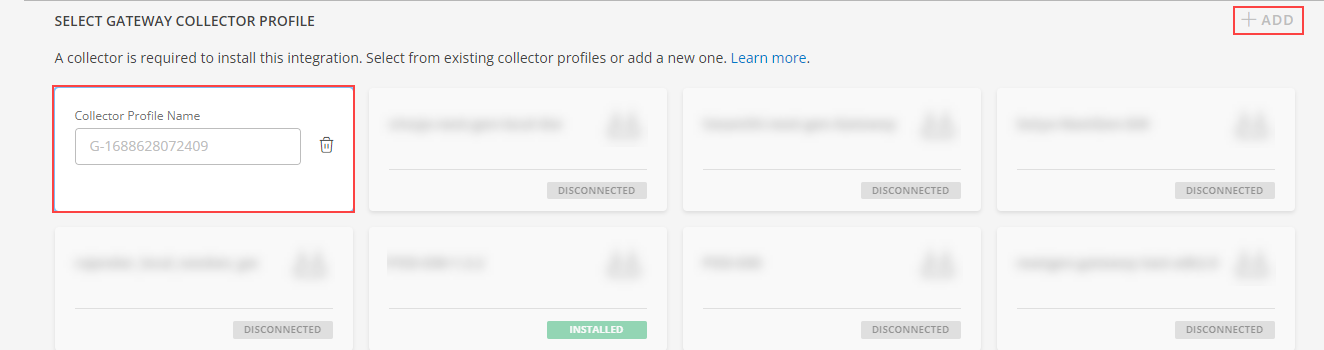
- Select an existing registered profile, and click FINISH.
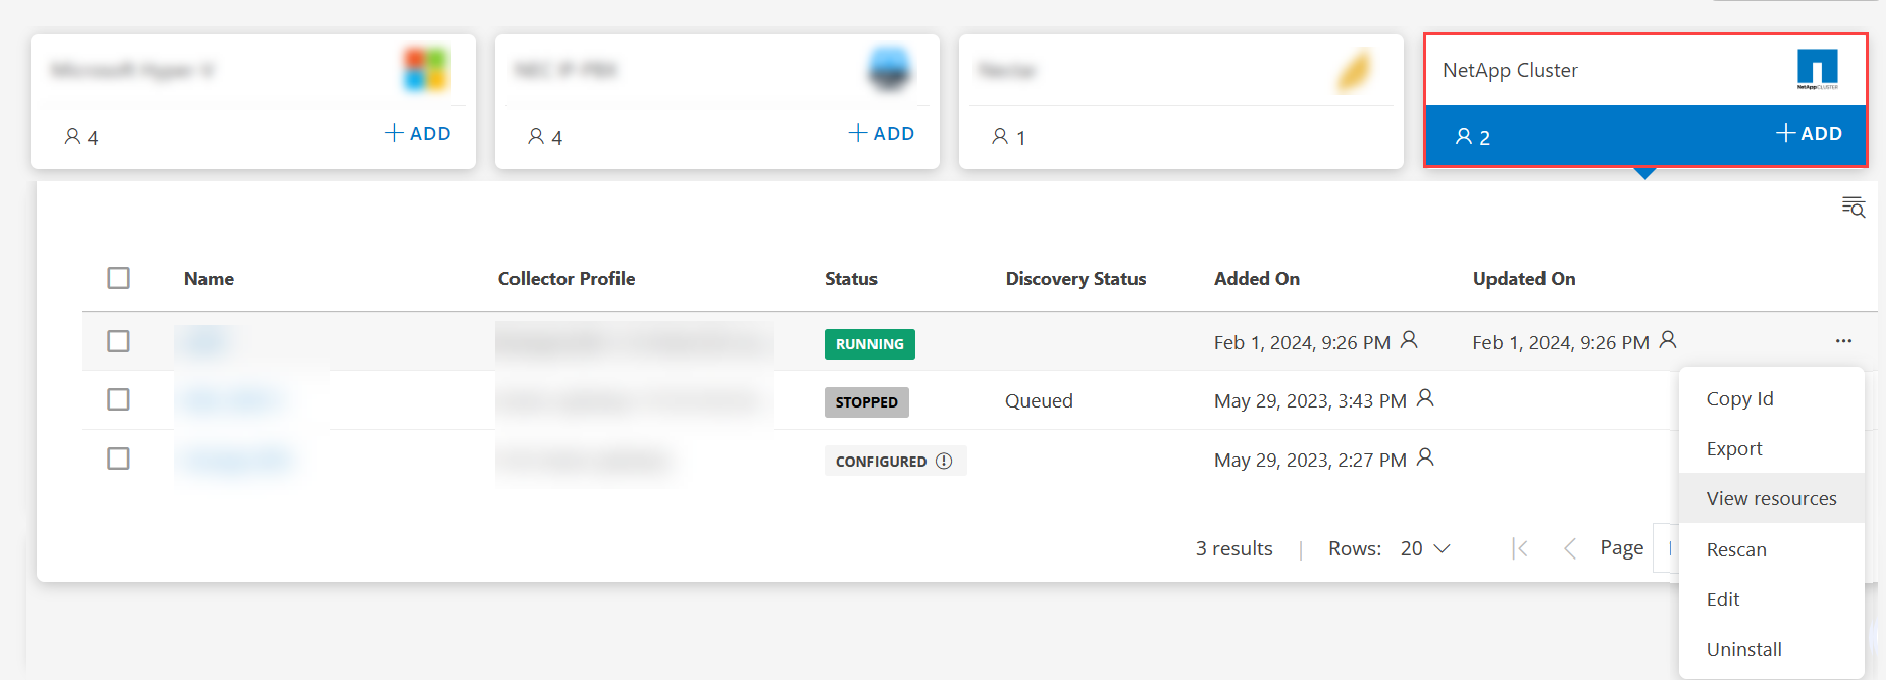
The application is now installed and displayed on the INSTALLED INTEGRATIONS page. Use the search field to find the installed application.
- (Optional), Select the NetApp Cluster Integration.
- (Optional), Click the ellipses and choose the View resources option.
Modify the Configuration
See Modify an Installed Integration or Application article.
Note: Select the NetApp Cluster application.
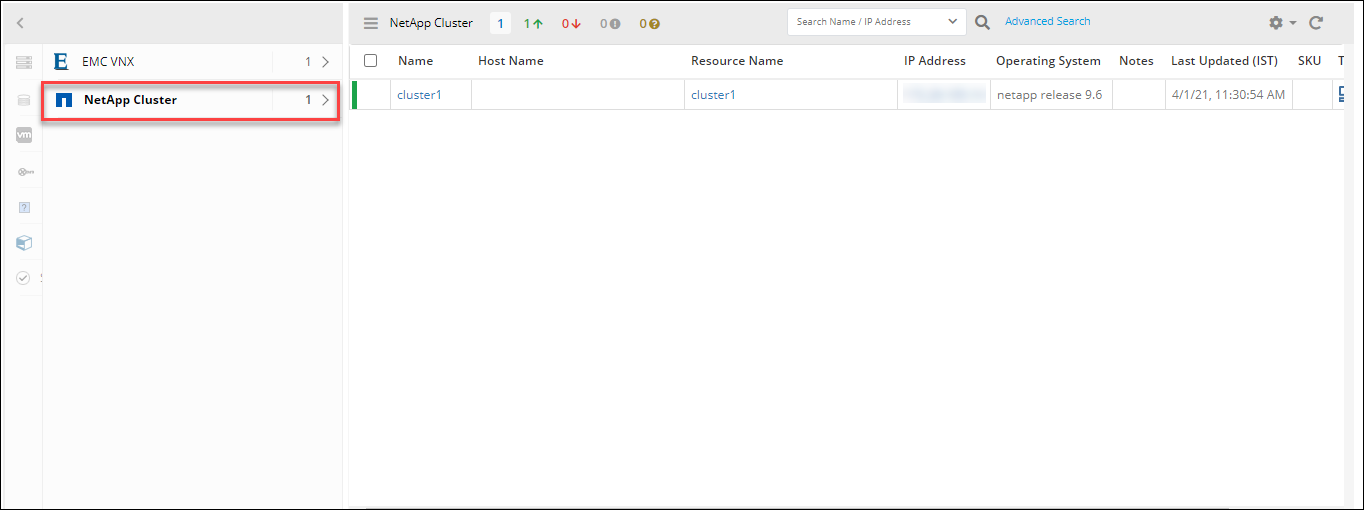
View the NetApp Cluster infrastructure details
NetApp Cluster is displayed in the Infrastructure > Resources > Storage > NetApp Cluster category. Click the name to view details. Monitoring is enabled according to the configured metric criteria.
Assign the monitoring template
To assign monitoring templates to NetApp Cluster, see Assigning Templates. For more information on NetApp Cluster templates, see NetApp Cluster.
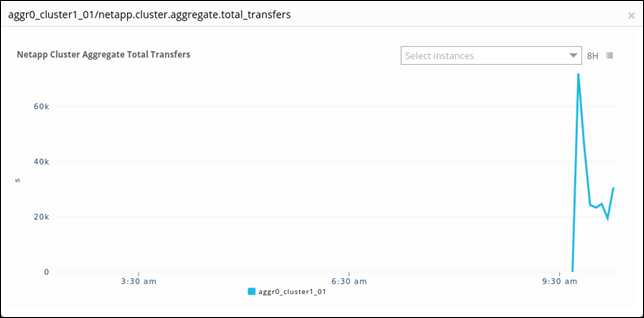
View resource metrics
To confirm NetApp Cluster monitoring, review the following:
- Metric graphs: A graph is plotted for each metric that is enabled in the configuration.
- Alerts: Alerts are generated for metrics that are configured as defined for integration.