Introduction
The Hitachi Operations Center Analyzer detail view (Analyzer detail view) database is a high speed, size-optimized NoSQL database with extremely effective storage and retrieval capabilities. It has the capacity to store time series data with a fine precision for an extended duration, including minute-level data. An expressive, potent, and succinct query language can be used to query this data (MQL). MQL differs from the widely used Structured Query Language because of its distinctive design (SQL).
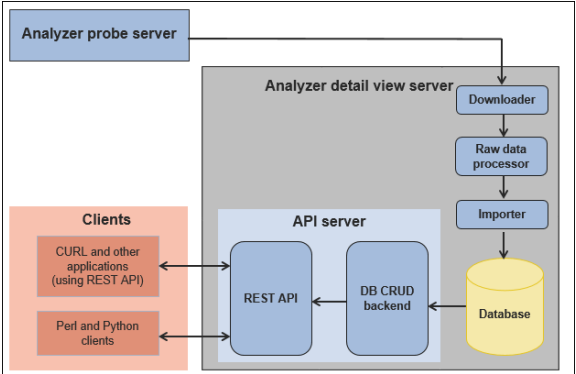
The Analyzer detail view REST API allows you to build an application around the Analyzer detail view database.
The following diagram shows the architecture of the analyzer detail view REST API server.
Prerequisites
- OpsRamp Classic Gateway (Linux) 14.0.0 and above.
- OpsRamp NextGen Gateway 14.0.0 and above.
- Note: OpsRamp recommends using the latest Gateway version for full coverage of recent bug fixes, enhancements, etc.
Resource Hierarchy
- Hitachi VSP Storage Array
- Hitachi VSP Parity Group
- Hitachi VSP Pool
- Hitachi VSP LDEV
- Hitachi VSP Cache
- Hitachi VSP MPB
- Hitachi VSP Port
- Hitachi VSP Tier LDEV
- Hitachi VSP MP
- Hitachi VSP MPB CLPR
Supported Metrics
Click here to view the supported metrics
| Native Type | Metric Names | Unit | Application Version | Default Metric | Description |
|---|---|---|---|---|---|
| Hitachi VSP Storage Array | hitachivsp_cha_Avg_Transfer_Rate | MBps | 4.0.0 | Yes | vsp cha avg transfer rate |
| hitachivsp_dynamic_provision_Provisioning_Efficiency_Rate | % | 4.0.0 | Yes | vsp dynamic provision provisioning efficiency rate | |
| hitachivsp_raidStorage_writePending | MB | 1.0.0 | No | Of the cache memory, the cache memory size used by write pending data. | |
| hitachivsp_raidStorage_cacheUsage | MB | 1.0.0 | No | Of the cache memory in the storage system, the amount that is being used. | |
| hitachivsp_raidStorage_sideFileUsage | MB | 1.0.0 | No | Of the cache memory, the cache memory size used by the side file. | |
| hitachivsp_raidStorage_chaCachePathUsageRate | % | 1.0.0 | Yes | Average (%) of the access path usage rate in the device between the channel adapter and cache switch. | |
| hitachivsp_raidStorage_dkaCachePathUsageRate | % | 1.0.0 | Yes | Average (%) of the access path usage rate in the device between the disk adapter and cache switch. | |
| hitachivsp_raidStorage_transferRate | KB/sec | 1.0.0 | Yes | Transfer speed | |
| hitachivsp_raidStorage_readTransRate | KB/sec | 1.0.0 | No | Read transfer speed | |
| hitachivsp_raidStorage_writeTransRate | KB/sec | 1.0.0 | No | Write transfer speed | |
| hitachivsp_raidStorage_totalIOPS | Operations/sec | 1.0.0 | Yes | Frequency of operations (number of times per second). | |
| hitachivsp_raidStorage_readIOPS | Operations/sec | 1.0.0 | No | Frequency of read operations (number of times per second). | |
| hitachivsp_raidStorage_writeIOPS | Operations/sec | 1.0.0 | No | Frequency of write operations (number of times per second). | |
| hitachivsp_raidStorage_readHit | % | 1.0.0 | No | Cache hit rate of read operations. | |
| Hitachi VSP Port | hitachivsp_port_Read_IO_Rate | 4.0.0 | Yes | vsp port read io rate | |
| hitachivsp_port_Read_Response_Rate | 4.0.0 | Yes | vsp port read response rate | ||
| hitachivsp_port_Read_Xfer_Rate | 4.0.0 | Yes | vsp port read xfer rate | ||
| hitachivsp_port_Write_IO_Rate | 4.0.0 | Yes | vsp port write io rate | ||
| hitachivsp_port_Write_Response_Rate | 4.0.0 | Yes | vsp port write response rate | ||
| hitachivsp_port_Write_Xfer_Rate | 4.0.0 | Yes | vsp port write xfer rate | ||
| hitachivsp_raidPort_totalIOPS | Operations/sec | 1.0.0 | Yes | Average frequency of read and write operations for the storage system port (number of times per second). | |
| hitachivsp_raidPort_initiatorResponseTime | ms | 1.0.0 | No | Average processing time per read/write processing request for a storage system port (Initiator port value/External port value). | |
| hitachivsp_raidPort_initiatorTotalIOPS | Operations/sec | 1.0.0 | No | Average frequency of read and write operations for a storage system port (number of operations per second) (Initiator port value/External port value). | |
| hitachivsp_raidPort_initiatorTransferRate | KB/sec | 1.0.0 | No | Average transfer rate of read and write operations for a storage system port (Initiator port value/External port value). | |
| hitachivsp_raidPort_maxIOPS | Operations/sec | 1.0.0 | No | Maximum frequency of read and write. | |
| hitachivsp_raidPort_transferRate | KB/sec | 1.0.0 | Yes | Average read and write transfer speed for the storage system port. | |
| hitachivsp_raidPort_maxTransferRate | KB/sec | 1.0.0 | Yes | Maximum read and write transfer speed for the storage system port Notes: If either of the following conditions is satisfied, the average value is used for this field when the data is stored in a record every minute or when the data is displayed as the real-time report:
| |
| hitachivsp_raidPort_responseTime Note: no Read Response times available via SDK 2.0 | ms | 1.0.0 | Yes | Average processing time per read/write processing request for a storage system port. | |
| Hitachi VSP Pool | hitachivsp_virtual_volume_Pool_Free_Capacity_Rate | % | 4.0.0 | Yes | vsp virtual volume pool free capacity rate |
| hitachivsp_pool_Physical_Fmc_Capacity_Utilization | % | 4.0.0 | Yes | vsp pool physical fmc capacity utilization | |
| hitachivsp_raidPool_tierRelocationProgressRate | % | 1.0.0 | Yes | Progress of tier relocation (%). Note: Depending on the current status of data placement among the tiers, the amount of time required for tier relocation (as predicted by the progress percentage) might not match the actual time required. | |
| hitachivsp_raidPool_totalPoolCapacityMB | MB | 1.0.0 | No | Virtual capacity of all Dynamic Provisioning VVOLs mapped to the pool. This value is not exactly the same as the device capacity information that is recognized by the host because this capacity information is managed by the storage system. | |
| hitachivsp_raidPool_touchedCapacityInGB | GB | 1.0.0 | No | Amount of pool capacity that is actually being used. Notes:
| |
| hitachivsp_raidPool_unTouchedCapacityInGB | GB | 1.0.0 | No | Unused capacity in the pool. Notes:
| |
| hitachivsp_raidPool_subRate | % | 1.0.0 | No | Pool Subscription Rate Total Actual Capacity: Capacity of the pool. Note: If the pool contains a parity group whose drive type is FMC and also Accelerated Compression is enabled, the value is the amount that includes the capacity of the expanded area. Total Managed Capacity: Virtual capacity of all Dynamic Provisioning VVOLs mapped to the pool. Note: This value is not exactly the same as the device capacity information that is recognized by the host because this capacity information is managed by the storage system. | |
| hitachivsp_raidPool_managedCapacityInGB | GB | 1.0.0 | No | Virtual capacity of all Dynamic Provisioning VVOLs mapped to the pool. Note: This value is not exactly the same as the device capacity information that is recognized by the host because this capacity information is managed by the storage system. | |
| hitachivsp_raidPool_physicalcapacityInGB | GB | 1.0.0 | No | Total amount of the physical capacity of the parity groups that make up the pool. | |
| hitachivsp_raidPool_percentUsageRate | % | 1.0.0 | Yes | Usage rate of the pool capacity. Note: This value is not exactly the same as the device capacity information that is recognized by the host because this capacity information is managed by the storage system. For the Dynamic Provisioning VVOLs for which pool areas are reserved, the percentage includes the capacity for the reserved pages. | |
| hitachivsp_raidPool_percentUsedCapacity | % | 1.0.0 | Yes | Percentage of pool Used capacity Used Capacity: Amount of pool capacity that is actually being used. Note: This value is not exactly the same as the device capacity information that is recognized by the host because this capacity information is managed by the storage system. If the settings of the capacity saving function (dedupe and compression) are enabled, the amount is the amount actually used after the size of the capacity is reduced. Note that if the pool contains a parity group whose drive type is FMC and also Accelerated Compression is enabled, the value does not include the compressed amount. Total Actual Capacity: Capacity of the pool. Note: If the pool contains a parity group whose drive type is FMC and also Accelerated Compression is enabled, the value is the amount that includes the capacity of the expanded area. | |
| hitachivsp_raidPool_transferRate | KB/sec | 1.0.0 | Yes | Total data transfer rate Read Xfer Rate: Total read data transfer rate for virtual volumes mapped to the Dynamic Provisioning pool Write xfer Rate: Total write data transfer rate for virtual volumes mapped to the Dynamic Provisioning pool Note: Performance values do not include information about virtual volumes that are used as S-VOLs of Thin Image. | |
| hitachivsp_raidPool_readTransRate | KB/sec | 1.0.0 | No | Total read data transfer rate for virtual volumes mapped to the Dynamic Provisioning pool. NotePerformance values do not include information about virtual volumes that are used as S-VOLs of Thin Image. | |
| hitachivsp_raidPool_writeTransRate | KB/sec | 1.0.0 | No | Total write data transfer rate for virtual volumes mapped to the Dynamic Provisioning pool. Note: Performance values do not include information about virtual volumes that are used as S-VOLs of Thin Image. | |
| hitachivsp_raidPool_readIOPS | Operations/sec | 1.0.0 | Yes | Frequency of read operations (times per second) for virtual volumes mapped to the Dynamic Provisioning pool. Note: Performance values do not include information about virtual volumes that are used as S-VOLs of Thin Image. | |
| hitachivsp_raidPool_writeIOPS | Operations/sec | 1.0.0 | Yes | Frequency of write operations (times per second) for virtual volumes mapped to the Dynamic Provisioning pool. Note: Performance values do not include information about virtual volumes that are used as S-VOLs of Thin Image. | |
| hitachivsp_raidPool_totalIOPS | Operations/sec | 1.0.0 | Yes | Frequency of operations (times per second) for virtual volumes mapped to the Dynamic Provisioning pool. Note: Performance values do not include information about virtual volumes that are used as S-VOLs of Thin Image. | |
| hitachivsp_raidPool_readResponseTime | ms | 1.0.0 | Yes | Average processing time per read request for virtual volumes mapped to the Dynamic Provisioning pool. Note: Performance values do not include information about virtual volumes that are used as S-VOLs of Thin Image. | |
| hitachivsp_raidPool_writeResponseTime | ms | 1.0.0 | Yes | Average processing time per write request for virtual volumes mapped to the Dynamic Provisioning pool. Note: Performance values do not include information about virtual volumes that are used as S-VOLs of Thin Image. | |
| hitachivsp_raidPool_responseTime | ms | 1.0.0 | Yes | Read Response Time Rate: Average processing time per read request for virtual volumes mapped to the Dynamic Provisioning pool. Write Response Time Rate: Average processing time per write request for virtual volumes mapped to the Dynamic Provisioning pool. Note: Performance values do not include information about virtual volumes that are used as S-VOLs of Thin Image. | |
| hitachivsp_raidPool_readKBPIO | KB/IO | 1.0.0 | No | Read transfer per operation Read Xfer Rate: Total read data transfer rate for virtual volumes mapped to the Dynamic Provisioning pool. Read IO Rate: Frequency of read operations (times per second) for virtual volumes mapped to the Dynamic Provisioning pool. | |
| hitachivsp_raidPool_writeKBPIO | KB/IO | 1.0.0 | No | Write transfer per Operation Write Xfer Rate: Total write data transfer rate for virtual volumes mapped to the Dynamic Provisioning pool. Write IO Rate: Frequency of write operations (times per second) for virtual volumes mapped to the Dynamic Provisioning pool. | |
| hitachivsp_raidPool_percentReadIOPS | % | 1.0.0 | No | Read IOPS Percentage Read IO Rate: Frequency of read operations (times per second) for virtual volumes mapped to the Dynamic Provisioning pool. Write IO Rate: Frequency of write operations (times per second) for virtual volumes mapped to the Dynamic Provisioning pool. Note: Performance values do not include information about virtual volumes that are used as S-VOLs of Thin Image. | |
| hitachivsp_raidPool_dkcSavingCapacity | GB | 1.0.0 | No | Amount of the data is reduced when the capacity saving function (dedupe and compression) is used for pools. The amount is stored only when the capacity saving function (dedupe and compression) is enabled. In other cases, the amount is 0. | |
| hitachivsp_raidPool_physicalCapacityUsed | GB | 1.0.0 | No | Total amount of used capacity in the physical capacity of the parity groups that make up the pool. Note: If the pool contains a parity group whose drive type is FMC and also Accelerated Compression is enabled, the value is the amount after compression. | |
| hitachivsp_raidPool_physicalCapacityFree | GB | 1.0.0 | No | Total amount of free capacity in the physical capacity of the parity groups that make up the pool Note: If the pool contains a parity group whose drive type is FMC and also Accelerated Compression is enabled, the value is the amount after compression. | |
| hitachivsp_raidPool_percentWriteIOPS | % | 1.0.0 | No | Frequency of read and write operations for each volume (number of operations per second). | |
| hitachivsp_raidPool_physicalCapacityUsageRate | % | 1.0.0 | Yes | Usage percentage of the physical capacity of the parity groups that make up the pool. | |
| hitachivsp_raidPool_poolCapacityGB | GB | 1.0.0 | No | Capacity of the pool (GB). This value is not exactly the same as the device capacity information that is recognized by the host because this capacity information is managed by the storage system. If the pool contains a parity group whose drive type is FMC and also Accelerated Compression is enabled, the value is the amount that includes the capacity of the expanded area. | |
| hitachivsp_raidPool_movedPages | Number | 1.0.0 | No | Total number of moved pages. | |
| Hitachi VSP Raid Pool Tier | hitachivsp_raidPoolTier_tierUsedCapacityMB | MB | 1.0.0 | No | Amount of tier capacity that is actually being used. Note: If the pool contains a parity group whose drive type is FMC and also Accelerated Compression is enabled, the value is the amount before compression. |
| hitachivsp_raidPoolTier_tierTotalCapacity | GB | 1.0.0 | No | Capacity of the tier. If the pool contains a parity group whose drive type is FMC and also Accelerated Compression is enabled, the value is the amount that includes the capacity of the expanded area. | |
| hitachivsp_raidPoolTier_tierTotalCapacityMB | MB | 1.0.0 | No | Capacity of the tier. Note: If the pool contains a parity group whose drive type is FMC and also Accelerated Compression is enabled, the value is the amount that includes the capacity of expanded area. | |
| hitachivsp_raidPoolTier_performanceWorkingRatio | % | 1.0.0 | No | Activity rate of the tier (%). Percentage of total I/Os that were actually processed by the tier compared to the number of I/Os that can be processed by the tier within the time period defined in the storage system. Note: If the monitoring mode of the Dynamic Provisioning pool is Continuous Mode, the value is predicted based on the trends of past performance values. | |
| hitachivsp_raidPoolTier_tierIOPS | IOPS | 1.0.0 | No | Frequency of I/O operations (times per second) processed by the tier within the time period defined in the storage system. Note: If the monitoring mode of the Dynamic Provisioning pool is Continuous Mode, the value is predicted based on the trends of past performance values. | |
| hitachivsp_raidPoolTier_spaceUsageRate | % | 1.0.0 | No | Of the capacity of the tier, the percentage of the capacity used | |
| hitachivsp_raidPoolTier_pagePromoted | Number | 1.0.0 | No | Number of pages moved to upper level tiers. | |
| hitachivsp_raidPoolTier_pageDemoted | Number | 1.0.0 | No | Number of pages moved to lower level tiers | |
| hitachivsp_raidPoolTier_movedPages | Number | 1.0.0 | No | Total number of pages moved Promoted Pages: Number of pages moved to upper level tiers Demoted Pages: Number of pages moved to lower level tiers | |
| hitachivsp_raidPoolTier_tierUsedCapacity | GB | 1.0.0 | No | Amount of tier capacity that is actually being used. Note: If the pool contains a parity group whose drive type is FMC and also Accelerated Compression is enabled, the value is the amount before compression. | |
| hitachivsp_raidPoolTier_tierFreeCapacity | GB | 1.0.0 | No | Free capacity of the tier. Note: If the pool contains a parity group whose drive type is FMC and also Accelerated Compression is enabled, the value is the amount that includes the capacity of expanded area. | |
| hitachivsp_raidPoolTier_spaceUsageRateInPool | % | 1.0.0 | No | Of the total capacity of a Dynamic Provisioning pool that has tier management enabled, the percentage of the pool used by the tier. | |
| Hitachi VSP raidPG | hitachivsp_raidPG_utilization | % | 1.0.0 | Yes | Usage rate of the parity group. The total usage rate of the logical devices that associate with the parity groups is stored in this field. Note: For storage systems other than VSP G1000, G1500, VSP F1500, if storage systems use parity groups created from flash drives (FMD, FMC, or SSD), you cannot judge the load status from the usage rate of the parity group. Because of the characteristics of flash drives, larger values might be displayed regardless of the load status. |
| hitachivsp_raidPG_maxUtilization | % | 1.0.0 | Yes | Usage rate of the parity group. Note:
| |
| hitachvsp_raidPG_transferRate | KB/sec | 1.0.0 | Yes | Total data transfer rate | |
| hitachvsp_raidPG_readTransRate | KB/sec | 1.0.0 | No | Read data transfer rate | |
| hitachvsp_raidPG_writeTransRate | KB/sec | 1.0.0 | No | Write data transfer rate | |
| hitachvsp_raidPG_percentReadIOPS | % | 1.0.0 | No | Percentage of the total number of read and write operations that are read operations. | |
| hitachvsp_raidPG_readHit | % | 1.0.0 | No | Cache hit rate of read operations | |
| hitachvsp_raidPG_readIOPS | Operations/sec | 1.0.0 | No | Frequency of read operations | |
| hitachvsp_raidPG_writeIOPS | Operations/sec | 1.0.0 | No | Frequency of write operations | |
| hitachvsp_raidPG_readResponseTime | ms | 1.0.0 | No | Sum of processing times for read operation requests processed during the collection period | |
| hitachvsp_raidPG_writeResponseTime | ms | 1.0.0 | No | Sum of processing times for write operation requests processed during the collection period | |
| hitachvsp_raidPG_randomReadIOPS | Operations/sec | 1.0.0 | No | Frequency of random read operations | |
| hitachvsp_raidPG_seqReadIOPS | Operations/sec | 1.0.0 | No | Frequency of sequential read operations | |
| hitachvsp_raidPG_randomWriteIOPS | Operations/sec | 1.0.0 | No | Frequency of random write operations | |
| hitachvsp_raidPG_seqWriteIOPS | Operations/sec | 1.0.0 | No | Frequency of sequential write operations | |
| hitachvsp_raidPG_randomIOPS | Operations/sec | 1.0.0 | No | Frequency of random operations (sum of processing times for random read and write operations per second) | |
| hitachvsp_raidPG_seqIOPS | Operations/sec | 1.0.0 | No | Frequency of sequential operations (sum of processing times for sequential read and write operations per second) | |
| hitachvsp_raidPG_randomTransRate | KB/sec | 1.0.0 | No | Transfer rate of random operations | |
| hitachvsp_raidPG_seqTransRate | KB/sec | 1.0.0 | No | Transfer rate of sequential operations | |
| hitachvsp_raidPG_totalIOPS | Operations/sec | 1.0.0 | No | Frequency of read and write operations | |
| hitachvsp_raidPG_percentWriteIOPS | % | 1.0.0 | No | Percentage of the total number of read and write operations that are write operations. | |
| Hitachi VSP raidClpr | hitachivsp_raidClpr_utilization | % | 1.0.0 | Yes | Of the cache memory allocated for a CLPR, the
percentage that is being used. Note: For HUS100 series, Hitachi SMS series, and Hitachi AMS2000 series storage systems, this field stores the average value of the performance data over the collection interval. For Hitachi AMS/WMS series, VSP Gx00 models, VSP Fx00 models, HUS VM, VSP G1000, G1500, VSP F1500, Virtual Storage Platform series, and Universal Storage Platform V/VM series storage systems, this field stores the value that was the most recent at the time the record was created. |
| hitachivsp_raidClpr_writePendingRate | % | 1.0.0 | Yes | Of the cache memory allocated for a CLPR, the percentage that is being used by write-pending data. Note: For HUS100 series, Hitachi SMS series, and Hitachi AMS2000 series storage systems, this field stores the average value of the performance data over the collection interval. For Hitachi AMS/WMS series, VSP Gx00 models, VSP Fx00 models, HUS VM, VSP G1000, G1500, VSP F1500, Virtual Storage Platform series, and Universal Storage Platform V/VM series storage systems, this field stores the value that was the most recent at the time the record was created. | |
| hitachivsp_raidClpr_sideFileUsageRate | % | 1.0.0 | No | Of the cache memory allocated for a CLPR, the percentage that is being used by the side file. | |
| hitachivsp_raidClpr_cacheUsage | MB | 1.0.0 | No | Of the cache memory allocated for a CLPR, the amount that is being used. Note: For HUS100 series, Hitachi SMS series, and Hitachi AMS2000 series storage systems, this field stores the average value of the performance data over the collection interval. For Hitachi AMS/WMS series, VSP Gx00 models, VSP Fx00 models, HUS VM, VSP G1000, G1500, VSP F1500, Virtual Storage Platform series, and Universal Storage Platform V/VM series storage systems, this field stores the value that was the most recent at the time the record was created. | |
| hitachivsp_raidClpr_writePending | MB | 1.0.0 | No | Of the cache memory allocated for a CLPR, the amount that is being used by write-pending data. Note: For HUS100 series, Hitachi SMS series, and Hitachi AMS2000 series storage systems, this field stores the average value of the performance data over the collection interval. For Hitachi AMS/WMS series, VSP Gx00 models, VSP Fx00 models, HUS VM, VSP G1000, G1500, VSP F1500, Virtual Storage Platform series, and Universal Storage Platform V/VM series storage systems, this field stores the value that was the most recent at the time the record was created. | |
| hitachivsp_raidClpr_sideFileUsage | MB | 1.0.0 | No | Of the cache memory allocated for a CLPR, the amount that is being used by the side file. | |
| hitachivsp_raidClpr_maxWritePendingRate | % | 1.0.0 | Yes | Of the cache memory allocated for a CLPR, the percentage that is being used by write-pending data. | |
| hitachivsp_raidClpr_cacheSizeGB | GB | 1.0.0 | No | Amount of cache memory allocated for a CLPR | |
| hitachivsp_raidClpr_maxSideFileUsageRate | % | 1.0.0 | No | Of the cache memory allocated for a CLPR, the percentage that is being used by the side file. | |
| Hitachi VSP raidMP | hitachivsp_raidMP_utilization | % | 1.0.0 | Yes | Usage rate of the processor. |
| Hitachi VSP MPB CLPR | hitachivsp_raidMpbClpr_writePendingRate | % | 1.0.0 | Yes | Of the cache memory allocated for each MP blade in the CLPR, the percentage that is being used by the write pending data of the LDEV that is owned by the MP Blade of the MP Blade ID field. |
| hitachivsp_raidMpbClpr_utilization | % | 1.0.0 | Yes | Of the cache memory allocated for each MP blade in the CLPR, the percentage that is being used by the LDEV that is owned by the MP Blade of the MP Blade ID field. | |
| Hitachi VSP MPB | hitachivsp_raidMPB_utilization | % | 1.0.0 | Yes | Usage rate of the processor |
| hitachivsp_raidMPB_maxUtilization | % | 1.0.0 | Yes | Usage rate of the processor | |
| Hitachi VSP LDEV | hitachivsp_ldev_Max_Busy_Rate | % | 4.0.0 | Yes | vsp ldev max busy rate |
| hitachivsp_Ldev_Status | 4.0.0 | Yes | vsp ldev status | ||
| hitachivsp_raidLdev_totalIOPS | Operations/sec | 1.0.0 | No | Frequency of read and write operations | |
| hitachivsp_raidLdev_readHit | % | 1.0.0 | No | Cache hit rate of read operations | |
| hitachivsp_raidLdev_readMiss | % | 1.0.0 | No | Cache hit rate of read operations | |
| hitachivsp_raidLdev_readHitCount | Count | 1.0.0 | No | Number of times the cache is hit for read operations. | |
| hitachivsp_raidLdev_writeHitCount | Count | 1.0.0 | No | Number of times the cache is hit for write operations. | |
| hitachivsp_raidLdev_writeHit | % | 1.0.0 | No | Cache hit rate of write operations. | |
| hitachivsp_raidLdev_writeMiss | % | 1.0.0 | No | Cache hit rate of write operations. | |
| hitachivsp_raidLdev_readIOPS | Operations/sec | 1.0.0 | No | Frequency of read operations | |
| hitachivsp_raidLdev_randomReadHit | % | 1.0.0 | No | Cache hit rate of random read operations for each volume. | |
| hitachivsp_raidLdev_randomReadIOPS | Operations/sec | 1.0.0 | No | Frequency of random read operations | |
| hitachivsp_raidLdev_randomWriteIOPS | Operations/sec | 1.0.0 | No | Frequency of random write operations | |
| hitachivsp_raidLdev_seqReadHit | % | 1.0.0 | No | Cache hit rate of sequential read operations for each volume | |
| hitachivsp_raidLdev_seqReadIOPS | Operations/sec | 1.0.0 | No | Frequency of sequential read operations | |
| hitachivsp_raidLdev_seqWriteIOPS | Operations/sec | 1.0.0 | No | Frequency of sequential write operations | |
| hitachivsp_raidLdev_writeIOPS | Operations/sec | 1.0.0 | No | Frequency of write operations | |
| hitachivsp_raidLdev_backTrans | KB/sec | 1.0.0 | No | Frequency of data transfer operations between cache memory and a hard disk drive (number of operations per second) | |
| hitachivsp_raidLdev_chToDrTransfer | /sec | 1.0.0 | No | Frequency of data transfer operations from cache memory to a hard disk drive (number of operations per second) | |
| hitachivsp_raidLdev_randomDrToChTransfer | /sec | 1.0.0 | No | Frequency of random data transfer operations from a hard disk drive to cache memory (number of operations per second) | |
| hitachivsp_raidLdev_seqDrToChTransfer | /sec | 1.0.0 | No | Frequency of sequential data transfer operations from a hard disk drive to cache memory (number of operations per second) | |
| hitachivsp_raidLdev_readTransRate | KB/sec | 1.0.0 | No | Read data transfer rate | |
| hitachivsp_raidLdev_transferRate | KB/sec | 1.0.0 | No | Total data transfer rate | |
| hitachivsp_raidLdev_writeTransRate | KB/sec | 1.0.0 | No | Write transfer speed | |
| hitachivsp_raidLdev_randomReadTransRate | KB/sec | 1.0.0 | No | Transfer rate of random read operations | |
| hitachivsp_raidLdev_randomWriteTransRate | KB/sec | 1.0.0 | No | Transfer rate of random write operations | |
| hitachivsp_raidLdev_seqReadTransRate | KB/sec | 1.0.0 | No | Transfer rate of sequential read operations | |
| hitachivsp_raidLdev_seqWriteTransRate | KB/sec | 1.0.0 | No | Transfer rate of sequential write operations | |
| hitachivsp_raidLdev_readResponseTime | ms | 1.0.0 | Yes | Average processing time for each read operation request | |
| hitachivsp_raidLdev_responseTime | ms | 1.0.0 | Yes | Average processing time for each read and write operation request. | |
| hitachivsp_raidLdev_writeResponseTime | ms | 1.0.0 | Yes | Average processing time for each write operation request. | |
| hitachivsp_raidLdev_utilization | % | 1.0.0 | Yes | Usage rate of the logical device. Note: For storage systems other than VSP G1000, G1500, VSP F1500, if storage systems use parity groups created from flash drives (FMD, FMC, or SSD), you cannot judge the load status from the usage rate of the parity group. Because of the characteristics of flash drives, larger values might be displayed regardless of the load status. | |
| hitachivsp_raidLdev_randomIOPS | Operations/sec | 1.0.0 | No | Frequency of random operations (sum of processing times for random read and write operations per second) | |
| hitachivsp_raidLdev_readHitIOPS | Operations/sec | 1.0.0 | No | Cache hit Read operation hit IOPS | |
| hitachivsp_raidLdev_readMissIOPS | Operations/sec | 1.0.0 | No | Cache miss Read operation IOPS | |
| hitachivsp_raidLdev_percentReadIOPS | % | 1.0.0 | No | Read IOPS Percentage Read IO count: Number of read operations. Write IO Count: Number of write operations. | |
| hitachivsp_raidLdev_percentWriteIOPS | % | 1.0.0 | No | Write IOPS Percentage. Write IO Count: Number of write operations. Read IO count: Number of read operations. | |
| hitachivsp_raidLdev_readKBPIO | KB/IO | 1.0.0 | No | Read transfer per Operation. Read Transfer Rate: Read data transfer rate Read IO Rate: Frequency of read operations | |
| hitachivsp_raidLdev_writeKBPIO | KB/IO | 1.0.0 | No | Write transfer per Operation. Write Transfer Rate: Write transfer speed Write IO Rate: Frequency of write operations | |
| hitachivsp_raidLdev_randomReadKBPIO | KB/IO | 1.0.0 | No | Random read transfer per operation. Random Read Transfer Rate: Transfer rate of random read operations. Random Read IO Rate: Frequency of random read operations | |
| hitachivsp_raidLdev_randomWriteKBPIO | KB/IO | 1.0.0 | No | Random write transfer per operation. Random Write Transfer Rate: Transfer rate of random write operations Random Write IO Rate: Frequency of random write operations | |
| hitachivsp_raidLdev_seqReadKBPIO | KB/IO | 1.0.0 | No | Sequential read transfer per operation. Sequential Read Transfer Rate: Transfer rate of sequential read operations Sequential Read IO Rate: Frequency of sequential read operations | |
| hitachivsp_raidLdev_seqWriteKBPIO | KB/IO | 1.0.0 | No | Sequential write transfer per operation. Sequential Write Transfer Rate: Transfer rate of sequential write operations Sequential Write IO Rate: Frequency of sequential write operations | |
| hitachivsp_raidLdev_percentUsageRate | % | 1.0.0 | No | Of the virtual capacity of the VVOL, the percentage of the capacity actually used (the usage rate of the pool capacity). Note: This value is not exactly the same as the device capacity information that is recognized by the host because this capacity information is managed by the storage system. If pool areas are reserved, the percentage includes the capacity for the reserved pages. | |
| hitachivsp_raidLdev_touchedCapacityInGB | GB | 1.0.0 | No | The actual amount of V-VOL capacity being used. Note: This value is not exactly the same as the device capacity information that is recognized by the host because this capacity information is managed by the storage system. If pool areas are reserved, the value includes the capacity for the reserved pages. | |
| hitachivsp_raidLdev_unTouchedCapacityInGB | GB | 1.0.0 | No | Free capacity of the V-VOL. Note: This value is not exactly the same as the device capacity information that is recognized by the host because this capacity information is managed by the storage system. | |
| hitachivsp_raidLdev_vvolCapacityInGB | GB | 1.0.0 | No | The virtual capacity of the V-VOL Note: This value is not exactly the same as the device capacity information that is recognized by the host because this capacity information is managed by the storage system. | |
| hitachivsp_raidLdev_queueSize | Count | 1.0.0 | No | Operations queue length | |
| hitachivsp_raidLdev_avgReadByte | byte/IO | 1.0.0 | No | Average read bytes per operation | |
| hitachivsp_raidLdev_avgWriteByte | byte/IO | 1.0.0 | No | Average write bytes per operation | |
| hitachivsp_raidLdev_writeIOCount | Operations/sec | 1.0.0 | No | Number of write operations | |
| hitachivsp_raidLdev_readIOCount | Operations/sec | 1.0.0 | No | Number of read operations | |
| hitachivsp_raidLdev_ldevMpbUtilization | % | 1.0.0 | No | Indicates the MPB utilization by LDEV. This metric will have value only when LDEV belongs to top20 LDEVs which are highly utilizing the MPB. | |
| hitachivsp_raidLdev_readIOPSPercent | % | 1.0.0 | No | Percentage of read operations per second. Operation: (readIOPS/(readIOPS+writeIOPS))*100 | |
| hitachivsp_raidLdev_randomIOPSPercent | % | 1.0.0 | No | Percentage of random operations per second. ((randomReadIOPS + randomWriteIOPS)/(randomReadIOPS + randomWriteIOPS+seqReadIOPS +seqWriteIOPS))*100 | |
| hitachivsp_raidLdev_seqBlockSize | KB/IO | 1.0.0 | No | Sequential block size in KB per IO. ((seqReadTransRate + seqWriteTransRate)/(seqReadIOPS + seqWriteIOPS))*1024 | |
| hitachivsp_raidLdev_randomBlockSize | KB/IO | 1.0.0 | No | Random block size in KB per IO. ((randomReadTransRate + randomWriteTransRate)/ (randomReadIOPS + randomWriteIOPS))*1024 | |
| Hitachi VSP Tier LDEV | hitachivsp_raidLdevTier_tierUsedCapacity | GB | 1.0.0 | No | Of the virtual capacity of the VVOL, the actual amount of V-VOL capacity used by the tier. Note: This value is not exactly the same as the device capacity information that is recognized by the host because this capacity information is managed by the storage system. |
| hitachivsp_raidLdevTier_tierIOPS | IOPS | 1.0.0 | No | Average read and write processing rate (number of times per second) for the tier, excluding cache hits. Note: This value will not match the performance information for virtual volumes because cache hits are not included. | |
| hitachivsp_raidLdevTier_tierIopsPerGB | IOPS/GB | 1.0.0 | No | Average read and write processing rate (number of times per second) for the tier, excluding cache hits. Note: this value will not match the performance information for virtual volumes because cache hits are not included. | |
| raidMb | hitachivsp_raidMb_accessPathUsage | % | 1.0.0 | No | Usage rate of the access path for the cache path in the main blade |
| raidChaEsw | hitachivsp_raidChaEsw_accessPathUsage | % | 1.0.0 | No | VSP G1500, VSP F1500, VSP G1000 and VSP: Usage rate of the access path between the channel adapter and the cache switch. For HUS VM: Usage rate of the access path between the channel blade and the main blade. |
| raidCha | hitachivsp_raidCha_totalIOPS | Operations/sec | 1.0.0 | No | The aggregate value of the average frequency of read and write operations for the storage system port (number of times per second) for each CHA |
| hitachivsp_raidCha_transferRate | KB/sec | 1.0.0 | No | The aggregate value of the read and write transfer speed for the storage system port for each CHA. | |
| raidDkaEsw | hitachivsp_raidDkaEsw_accessPathUsage | % | 1.0.0 | No | VSP G1500, VSP F1500, VSP G1000 and VSP: Usage rate of the access path between the disk adapter and the cache switch. For HUS VM: Usage rate of the access path between the disk blade and the main blade. |
| raidMpbEsw | hitachivsp_raidMpbEsw_accessPathUsage | % | 1.0.0 | No | VSP G1500, VSP F1500, VSP G1000 and VSP: Usage rate of the access path between the MP Blade and the cache switch. For HUS VM: Usage rate of the access path for the cache path in the main blade. |
| raidCacheEsw | hitachivsp_raidCacheEsw_accessPathUsage | % | 1.0.0 | No | Usage rate of the access path between a cache switch and cache memory. |
| raidURJnl | hitachivsp_raidURJnl_writeTransRate | KB/sec | 1.0.0 | Yes | Amount of data written per second to the primary storage system in the journal group. |
| hitachivsp_raidURJnl_writeIOPS | Operations/s | 1.0.0 | Yes | Number of write I/O operations per second to the primary storage system in the journal group. | |
| hitachivsp_raidURJnl_asyncCopyTransRate | MB/s | 1.0.0 | No | The amount of transferred data per second (megabytes per second) for asynchronous replication in the journal group. | |
| hitachivsp_raidURJnl_masterJNLDataUsage | % | 2.0.0 | Yes | Master journal's data usage measured for each journal. | |
| hitachivsp_raidURJnl_restoreJNLDataUsage | % | 2.0.0 | Yes | Restore journal's data usage measured for each journal | |
| hitachivsp_raidURJnl_rioResponseRate | Microseconds/Operations | 1.0.0 | Yes | Average RIO response time (in microseconds per I/O operation) of the storage system among the journal groups. | |
| raidConsistencyGroup | hitachivsp_raidConsistencyGroup_delta | 1.0.0 | No | The network transfer latency time between master JNL and restore JNL. |
Default Monitoring Configurations
Hitachi VSP OpCenter Detailview has default Global Device Management Policies, Global Templates, Global Monitors and Global Metrics in OpsRamp. You can customize these default monitoring configurations as per your business requirement by cloning respective Global Templates and Global Device Management Policies. It is recommended to clone them before installing the application to avoid noise alerts and data.
Default Global Device Management Policies
You can find the Device Management Policy for each Native Type at Setup > Resources > Device Management Policies. Search with suggested names in global scope:
{appName nativeType - version}Ex: hitachi-vsp-opscenter-detailview Hitachi VSP Port - 1 (i.e, appName = hitachi-vsp-opscenter-detailview, nativeType = Hitachi VSP Port, version = 1)
Default Global Templates
You can find the Global Templates for each Native Type at Setup > Monitoring > Templates. Search with suggested names in global scope. Each template adheres to the following naming convention:
{appName nativeType 'Template' - version}Ex: hitachi-vsp-opscenter-detailview Hitachi VSP Port Template - 1 (i.e, appName = hitachi-vsp-opscenter-detailview, nativeType = Hitachi VSP Port, version = 1)
Default Global Monitors available
You can find the Global Monitors for each Native Type at Setup > Monitoring > Monitors. Search with suggested names in global scope. Each Monitors adheres to the following naming convention:
{monitorKey appName nativeType - version}Ex: Hitachi VSP Port Monitor hitachi-vsp-opscenter-detailview Hitachi VSP Port 1 (i.e, monitorKey = Hitachi VSP Port Monitor Monitor, appName = hitachi-vsp-opscenter-detailview, nativeType = Hitachi VSP Port, version = 1)
Configure and Install the Hitachi VSP OpCenter Detailview Integration
- From All Clients, select a client.
- Go to Setup > Account.
- Select the Integrations and Apps tab.
- The Installed Integrations page, where all the installed applications are displayed.
Note: If there are no installed applications, it will navigate to the Available Integrations and Apps page. - Click + ADD on the Installed Integrations page. The Available Integrations and Apps page displays all the available applications along with the newly created application with the version.
Note: You can even search for the application using the search option available. Also you can use the All Categories option to search. - Click ADD in the Hitachi VSP Opcenter Detailview tile.
- In the Configuration page, click + ADD. The Add Configuration page appears.
- Enter the below mentioned BASIC INFORMATION:
| Field Name | Description | Field Type |
|---|---|---|
| Name | Enter a name for the configuration. | String |
| Detailview IP Address/Host Name | Enter the IP address or host name of the OpsCenter Detailview server. | String |
| isSecure | Select to enable secure (HTTPS) communication. | Checkbox |
| Port | Enter the port number for API communication (default: 8443). | String |
| Serial Number | Enter the serial number. | String |
| VSP IP Address | Enter the IP address of the VSP. | String |
| Authentication Type | Select the authentication type (Bearer Token/Access Token). | Dropdown |
| Token API Port | Enter the port number for token (default: 443). | String |
| Credentials | Select the credential associated with your Dell OpenManage Enterprise account. If you want to use the existing credentials, select them from the Select Credentials dropdown. Else, click + Add to create credentials. The ADD CREDENTIAL window is displayed. Enter the following information: Name: Credential name. Description: Brief description of the credential. User Name: User name. Password: Password. Confirm Password: Confirm password. | Dropdown |
| API Metric Collection Time | Set the interval (in minutes) for API metric collection. If there is a delay in metric availability at the end device, update the configuration accordingly. By default, the API collects metrics from the last 15 minutes. | Dropdown |
| OpsCenter Port | Enter the OpsCenter port number (default: 22016). | String |
| Opscenter Credentials | Select the credential associated with your Dell OpenManage Enterprise account. If you want to use the existing credentials, select them from the Select Credentials dropdown. Else, click + Add to create credentials. The ADD CREDENTIAL window is displayed. Enter the following information: Name: Credential name. Description: Brief description of the credential. User Name: User name. Password: Password. Confirm Password: Confirm password. | Dropdown |
| App Failure Notifications | When selected, you will be notified in case of an application failure such as Connectivity Exception, Authentication Exception. | Checkbox |
| API Timeouts | Configure API timeouts for connection, connection request, and socket (in seconds). | Checkbox |
| Connection Timeout in Secs | Select the maximum time, in seconds, that the integration must wait while establishing a connection with the OpsRamp API endpoint. Default Value: 60 | Dropdown |
| Connection Request Timeout in Secs | Select the maximum time, in seconds, required to process an HTTP call: from sending a request to receiving a response. Default Value: 60 | Dropdown |
| Socket Timeout in Secs | Select the maximum time of inactivity between two data packets when exchanging data with a server. Default Value: 60 | Dropdown |
Notes:
- By default the Is Secure checkbox is selected.
- Ip Address/Host Name and Port should be accessible from Gateway.
- Select App Failure Notifications: if turned on, you will be notified in case of an application failure that is, Connectivity Exception, Authentication Exception.
- Select the below mentioned CUSTOM ATTRIBUTE:
| Functionality | Description |
|---|---|
| Custom Attribute | Select the custom attribute from the drop down list box. |
| Value | Select the value from the drop down list box. |
Note: The custom attribute that you add here will be assigned to all the resources that are created by the integration. You can add a maximum of five custom attributes (key and value pair).
- In the Native Types section, select the native types to be discovered.
- In the DISCOVERY SCHEDULE section, select Recurrence Pattern to add one of the following patterns:
- Minutes
- Hourly
- Daily
- Weekly
- Monthly
- Click ADD.
The configuration is saved and displayed on the configurations page after you save it.
Note: From the same page, you may Edit and Remove the created configuration.
Under the ADVANCED SETTINGS, Select the Bypass Resource Reconciliation option, if you wish to bypass resource reconciliation when encountering the same resources discovered by multiple applications.
Note: If two different applications provide identical discovery attributes, two separate resources will be generated with those respective attributes from the individual discoveries.
Click NEXT.
(Optional) Click +ADD to create a new collector by providing a name or use the pre-populated name.
Select an existing registered profile.
Click FINISH.
The application is installed and displayed on the INSTALLED INTEGRATION page. Use the search field to find the installed integration.
Modify the Configuration
See Modify an Installed Integration or Application article.
Note: Select the Hitachi VSP Opcenter Detailview application.
View the Hitachi VSP Opcenter Detailview details
The discovered resource(s) are displayed in Infrastructure > Search > Storage > Hitachi VSP Opcenter Detailview, with Native Resource Type as Hitachi VSP Storage Array. You can navigate to the Attributes tab to view the discovery details, and the Metrics tab to view the metric details for Hitachi VSP.

Supported Alert Custom Macros
Customize the alert subject and description with below macros then it will generate alert based on customisation.
Supported macros keys:
Click here to view the alert subject and description with macros
${resource.name}
${resource.ip}
${resource.mac}
${resource.aliasname}
${resource.os}
${resource.type}
${resource.dnsname}
${resource.alternateip}
${resource.make}
${resource.model}
${resource.serialnumber}
${resource.systemId}
${Custome Attributes in the resource}
${parent.resource.name}
Resource Filter Input Keys
Hitachi VSP Detailview Resources are filtered and discovered based on the following resource filter input keys.
Click here to see Hitachi VSP Storage Array native type and its attributes.
| Native Type | Resource Attributes |
|---|---|
| Hitachi VSP Storage Array | Generic Attributes |
| resourceType | |
| nativeType | |
| resourceName | |
| hostName | |
| moId | |
| serialNumber | |
| model | |
| make | |
| ipAddress |
Click here to see Hitachi VSP Pool native type and its attributes.
| Native Type | Resource Attributes |
|---|---|
| Hitachi VSP Pool | Generic Attributes |
| resourceType | |
| nativeType | |
| resourceName | |
| hostName | |
| moId | |
| Custom Attributes | |
| poolType | |
| numberOfPoolVolumes | |
| noOfVVols | |
| Root Resource IPAddress | |
| Root Resource Name | |
| Root Resource HostName |
Click here to see Hitachi VSP Port native type and its attributes.
| Native Type | Resource Attributes |
|---|---|
| Hitachi VSP Port | Generic Attributes |
| resourceType | |
| nativeType | |
| resourceName | |
| hostName | |
| moId | |
| Custom Attributes | |
| portType | |
| attribute | |
| loopId | |
| topology | |
| lunSecurity | |
| Root Resource IPAddress | |
| Root Resource Name | |
| Root Resource HostName |
Click here to see Hitachi VSP Parity Group native type and its attributes.
| Native Type | Resource Attributes |
|---|---|
| Hitachi VSP Parity Group | Generic Attributes |
| resourceType | |
| nativeType | |
| resourceName | |
| hostName | |
| moId | |
| Custom Attributes | |
| numberOfLdevs | |
| raidLevel | |
| raidType | |
| driveType | |
| isConcatenated | |
| Root Resource IPAddress | |
| Root Resource Name | |
| Root Resource HostName |
Click here to see Hitachi VSP MP native type and its attributes.
| Native Type | Resource Attributes |
|---|---|
| Hitachi VSP MP | Generic Attributes |
| resourceType | |
| nativeType | |
| resourceName | |
| hostName | |
| moId | |
| processorId | |
| Custom Attributes | |
| processorId | |
| Root Resource IPAddress | |
| Root Resource Name | |
| Root Resource HostName |
Click here to see Hitachi VSP MPB native type and its attributes.
| Native Type | Resource Attributes |
|---|---|
| Hitachi VSP MPB | Generic Attributes |
| resourceType | |
| nativeType | |
| resourceName | |
| hostName | |
| Custom Attributes | |
| mpbId | |
| Root Resource IPAddress | |
| Root Resource Name | |
| Root Resource HostName |
Click here to see Hitachi VSP Tier LDEV native type and its attributes.
| Native Type | Resource Attributes |
|---|---|
| Hitachi VSP Tier LDEV | Generic Attributes |
| resourceType | |
| nativeType | |
| resourceName | |
| hostName | |
| moId | |
| Custom Attributes | |
| tierType | |
| displayDriveType | |
| Root Resource IPAddress | |
| Root Resource Name | |
| Root Resource HostName |
Click here to see Hitachi VSP LDEV native type and its attributes.
| Native Type | Resource Attributes |
|---|---|
| Hitachi VSP LDEV | Generic Attributes |
| resourceType | |
| nativeType | |
| resourceName | |
| hostName | |
| moId | |
| Custom Attributes | |
| Root Resource IPAddress | |
| Root Resource Name | |
| Root Resource HostName | |
| parityGroup | |
| volumeType | |
| volumeAttribute | |
| raidLevel | |
| raidType | |
| driveModel | |
| mpb |
Click here to see Hitachi VSP MPB CLPR native type and its attributes.
| Native Type | Resource Attributes |
|---|---|
| Hitachi VSP MPB CLPR | Generic Attributes |
| resourceType | |
| nativeType | |
| resourceName | |
| hostName | |
| moId | |
| Custom Attributes |
Click here to see Hitachi VSP Cache native type and its attributes.
| Native Type | Resource Attributes |
|---|---|
| Hitachi VSP Cache | Generic Attributes |
| resourceType | |
| nativeType | |
| resourceName | |
| hostName | |
| moId | |
| Custom Attributes |
Risks, Limitations & Assumptions
- Application can handle Critical/Recovery failure notifications for below two cases when user enables App Failure Notifications in configuration
- Connectivity Exception
- Authentication Exception
- If App Failure Notifications are enabled, an alert will be sent, however, either OpsCenter Detailview Gateway IP Address configurations or OpsCenter Detailview Manager IP Address configurations should be provided.
- Application will send any duplicate/repeat failure alert notification for every 6 hours.
- Application cannot control monitoring pause/resume actions based on above alerts Metrics can be used to monitor OpsCenter Detailview resources and can generate alerts based on the threshold values.
- OpsCenter Detailview Event/Alert polling will start only if the user enables Alert Polling in configuration. Possible values of Alert Severity Filter configuration property are ALERT_LOW,ALERT_MEDIUM,ALERT_HIGH.
- OpsRamp has given sample mappings to map OpsCenter Detailview Severity with OpsRamp Severities as part of Alert Severity Mapping configuration file. Users can modify them as per their use-case at any point of time from the application configuration page. Possible OpsRamp Severities are Critical, Warning, Ok, Info.
- In OpsCenter Detailview, few resource names are null. For them, we are mapping id as resource name.
- Support for Macro replacement for threshold breach alerts (i.e, customisation for threshold breach alert’s subject, description).
- Component level thresholds can be configured on each resource level.
- The Template Applied Time will only be displayed if the collector profile (Classic and NextGen Gateway) is version 18.1.0 or higher.
- Support for the option to get Latest snapshot metric.
Version History
| Application Version | Bug fixes / Enhancements |
|---|---|
| 6.3.0 | This implementation introduces third-party CI alert mapping and OpsQL-based enhancements.Configure alert mappings to target CI systems through the application configuration. After configuration, the system automatically forwards alerts to the corresponding third-party platforms and maps them to the specified CIs, ensuring consistent integration and efficient alert management.Previously, resource filters in the app configuration required manual entry of resource core and custom attributes. With this enhancement, the configuration is moved to OpsQL-based filtering, where users can see the keys auto-populated as needed. |
| 6.2.3 | Increased the metric collection window form 60 to 65 (adding buffer). |
| 6.2.2 | Fixed metric collection to account for a one-hour delay at the end device (specific to Detail View APIs). |
| 6.2.1 | Fixed metric collection for raid pool subscription rate. |
| 6.2.0 | Fixed a manifest issue caused by newly added fields on the platform side. |
| 6.1.1 | Fixed Pool native type metric physical capacity rate. |
| 6.1.0 | Added support for configurable delay in API metric collection. |
| 6.0.4 | Updates metrics to collect from opscenter APIs for Port and Pool native types. |
| 6.0.3 | Pool used capacity percentage metric is collected from Opscenter Raid agent API. |
| 6.0.2 | Optimization for memory and CPU utilization and updating units for hitachivsp_raidPort_transferRate metric from KBPS to MBPS. |
| 6.0.1 | Activity log changes & latest metric snapshot changes. |
| 6.0.0 | Seperate Hitachi VSP MPB native type to Hitachi VSP MBP , Hitachi VSP MP, Hitachi VSP MBP CLPR |
| 5.0.1 | Added Timezone parameter in API Calls |
| 5.0.0 |
|
| 4.0.2 |
|
| 4.0.1 | Giving Hostname and resource name of root resource as VSP array instance name |
Click here to view the earlier version updates
| Application Version | Bug fixes / Enhancements |
|---|---|
| 4.0.0 |
|
| 3.0.0 | New default metrics added. |
| 2.0.0 | Initial SDK2.0 application Discovery and Monitoring Implementations. |