| Supported Target Versions |
|---|
| veritas infoscale 7.4.2 |
Application Version and Upgrade Details
| Application Version | Bug fixes / Enhancements |
|---|---|
| 2.0.4 | Provided support for both sudo and non-sudo commands execution. |
| 2.0.2 | Resource Display order Support for search UI. |
| 2.0.1 | Curated Dashboards. |
Click here to view the earlier version updates
| Application Version | Bug fixes / Enhancements |
|---|---|
| 2.0.0 | Converted veritas-cluster sdk-1.0.0 application to sdk-2.0.0 application. |
Introduction
Veritas Cluster Server is a high-availability cluster software for unix, linux and Microsoft windows computer systems. It is an availability clustering solution that manages the availability of application services, such as Db2 database, by enabling application failover. The state of each individual cluster node and its associated software services are regularly monitored.
Failover
Failover is a process. Whenever a primary system, network or a database fails or is abnormally terminated, then a Failover acts as a standby which helps resume these operations.
Failover Cluster
Failover cluster is a set of servers that work together to provide High Availability (HA) or Continuous availability (CA). As mentioned earlier, if one of the servers goes down another node in the cluster can take over its workload with minimal or no downtime. Some failover clusters use physical servers whereas others involve virtual machines (VMs).
CA clusters allow users to access and work on the services and applications without any incidence of timeouts (100% availability), in case of a server failure. HA clusters, on the other hand, may cause a short hiatus in the service, but system recovers automatically with minimum downtime and no data loss.
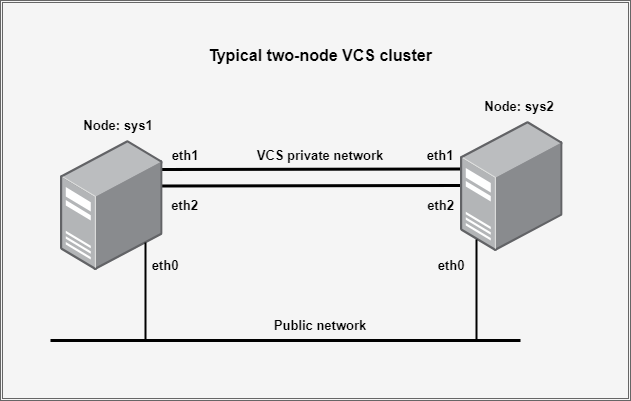
A cluster is a set of two or more nodes (servers) that transmit data for processing through cables or a dedicated secure network. Even load balancing, storage or concurrent/parallel processing is possible through other clustering technologies.
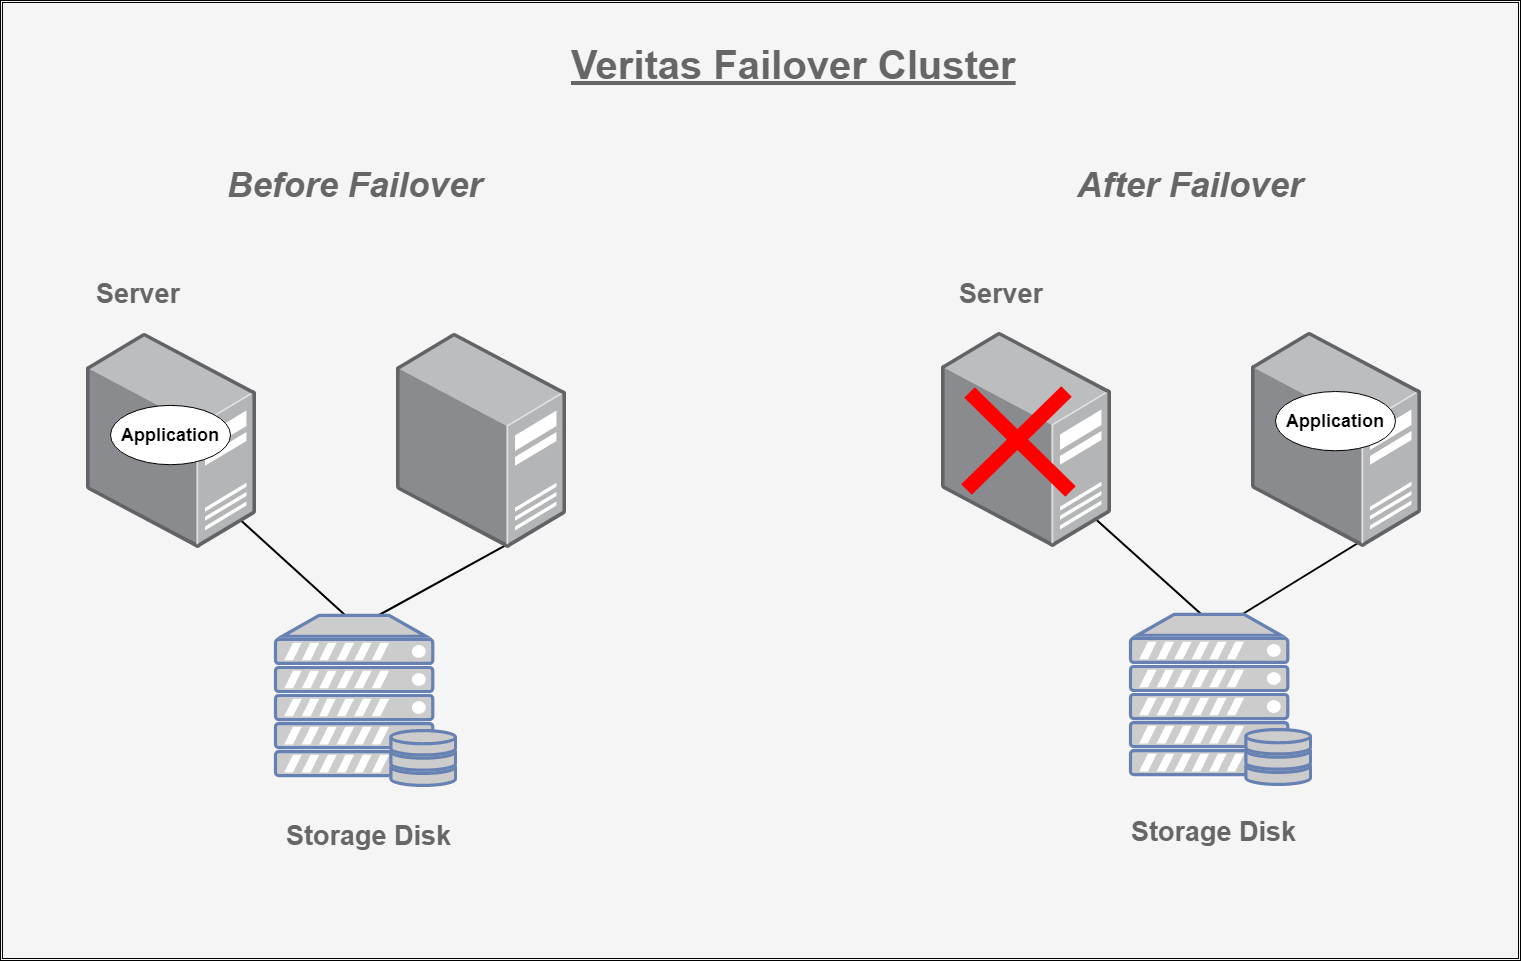
The above image shows an application that runs on a primary or master server. A dedicated redundant server is present to take over on any failure. The redundant server is not configured to perform any other functions. The redundant server is on stand-by with full performance capability.
Veritas Cluster Server (VCS)
Veritas Cluster Server is a high-availability cluster software for Unix, Linux and Microsoft Windows computer systems.
Veritas Cluster Server connects multiple, independent systems into a management framework for increased availability. Each system or node runs its own operating system and cooperates at the software level to form a cluster. VCS links commodity hardware with intelligent software to provide application failover and control. So when a node or a monitored application fails, other nodes take over and bring up services elsewhere in the cluster.
How VCS detects failure
VCS detects failure by issuing specific commands or scripts to monitor the overall health of an application. VCS also determines the health of underlying resources supporting the application, such as network interfaces or file systems.
VCS uses a redundant network heartbeat to differentiate between the loss of a system and the loss of communication between systems.
How VCS ensures application availability
When VCS detects an node or application failure, VCS brings application services up on a different node in a cluster. VCS virtualizes IP addresses and system names, so client systems continue to access the application without any interruption.
Integration is done with Veritas Cluster using SSH and shell script.
Prerequisites
- OpsRamp Classic Gateway 14.0.0 and above.
- OpsRamp NextGen Gateway 14.0.0 and above.
Note: OpsRamp recommends using the latest Gateway version for full coverage of recent bug fixes, enhancements, etc. - Ensure that “adapter integrations” add-on is enabled in client configuration. Once enabled you can see Veritas Cluster integration under Setup > Integrations > Adapter section.
It is mandatory to provide administrator (or) operator level VCS credentials in input configuration. VCS credentials are required to fetch veritas_cluster_group_State, veritas_cluster_group_Status, veritas_cluster_node_State, veritas_cluster_resource_State, veritas_cluster_resource_Status, veritas_cluster_group_failover_Status metric details.
In order to get Additional metrics ( veritas_cluster_lltLinks_State, veritas_cluster_lltInterface_Status), you need to provide permissions for the non-root SSH user. So, you need to make an entry as below in “/etc/sudoers”.
    cat /etc/sudoers

    ## Allow root to run any commands anywhere
    root    ALL=(ALL)     ALL
    content    ALL=NOPASSWD:/usr/sbin/lltstat -n,/usr/sbin/lltstat -nvv configured
In case root SSH Credentials are provided, there is no need to configure the second prerequisite.
All nodes IP Address should be publicly available or it should be configured in
/etc/hostsof all the existing nodes in the Veritas Cluster.cat /etc/hosts [root@centos-node1 ~]# cat /etc/hosts 127.0.0.1 localhost localhost.localdomain localhost4 localhost4.localdomain4 ::1 localhost localhost.localdomain localhost6 localhost6.localdomain6 172.26.1.25 centos-node1 172.26.1.26 centos-node2non-root user running VCS commands must have a home directory on the system on which the VCS commands will be run.
    pwd
    [content@centos-node1 ~]$ pwd
    /home/content
Resource Hierarchy
Veritas Cluster
→ Server
Default Monitoring Configurations
Veritas Cluster application has default Global Device Management Policies, Global Templates, Global Monitors and Global metrics in OpsRamp. Users can customize these default monitoring configurations as per their business use cases by cloning respective global templates and global Device Management Policies. OpsRamp recommends doing this activity before installing the application to avoid noise alerts and data.
Default Global Device Management Policies
OpsRamp has a Global Device Management Policy for each Native Type of VERITAS-CLUSTER. You can find those Device Management Policies at Setup > Resources > Device Management Policies, search with suggested names in global scope. Each Device Management Policy follows below naming convention:
{appName nativeType - version}Ex: veritas-cluster Veritas Cluster - 1 (i.e, appName = veritas-cluster, nativeType = Veritas Cluster, version = 1)
Default Global Templates
OpsRamp has a Global template for each Native Type of VERITAS-CLUSTER. You can find those templates at Setup > Monitoring > Templates, search with suggested names in global scope. Each template follows below naming convention:
{appName nativeType 'Template' - version}Ex: veritas-cluster Veritas Cluster Template - 1 (i.e, appName = veritas-cluster, nativeType = Veritas Cluster, version = 1)
Default Global Monitors
OpsRamp has a Global Monitors for each Native Type which has monitoring support. You can find those monitors at Setup > Monitoring > Monitors, search with suggested names in global scope. Each Monitors follows below naming convention:
{monitorKey appName nativeType - version}Ex: Veritas Cluster Monitor veritas-cluster Veritas Cluster 1 (i.e, monitorKey = Veritas Cluster Monitor, appName = veritas-cluster, nativeType = Veritas Cluster, version = 1)
Supported Metrics
Click here to view the supported metrics
Resource Type: Cluster
| Native Type | Metric Name | Display Name | Unit | Application Version | Description |
|---|---|---|---|---|---|
| Veritas Cluster | veritas_cluster_group_State | Veritas Cluster Group State | 2.0.0 | Veritas cluster service group status on each node. Possible values 0-OFFLINE, 1-ONLINE, 2-FAULTED, 3-PARTIAL, 4-STARTING, 5-STOPPING, 6-MIGRATING, 7-OFFLINE|FAULTED, 8-OFFLINE|STARTING, 9-PARTIAL|FAULTED, 10-PARTIAL|STARTING, 11-PARTIAL|STOPPING, 12-ONLINE|STOPPING | |
| veritas_cluster_group_Status | Veritas Cluster Group Status | 2.0.0 | Veritas cluster service group status. Possible values 0 - Service group not online on any cluster node, 1 - Service group online on cluster node. | ||
| veritas_cluster_node_State | Veritas Cluster Node Status | 2.0.0 | Veritas cluster node's status. Possible values 0-RUNNING, 1-ADMIN_WAIT, 2-CURRENT_DISCOVER_WAIT, 3-CURRENT_PEER_WAIT, 4-EXITING, 5-EXITED, 6-EXITING_FORCIBLY, 7-FAULTED, 8-INITING, 9-LEAVING, 10-LOCAL_BUILD, 11-REMOTE_BUILD, 12-STALE_ADMIN_WAIT, 13-STALE_DISCOVER_WAIT, 14-STALE_PEER_WAIT, 15-UNKNOWN | ||
| veritas_cluster_resource_State | Veritas Cluster Resource State | 2.0.0 | Veritas cluster resource status on each node. Possible values 0-OFFLINE, 1-ONLINE, 2-FAULTED, 3-PARTIAL, 4-STARTING, 5-STOPPING, 6-MIGRATING, 7-OFFLINE|FAULTED, 8-OFFLINE|STARTING, 9-PARTIAL|FAULTED, 10-PARTIAL|STARTING, 11-PARTIAL|STOPPING, 12-ONLINE|STOPPING | ||
| veritas_cluster_resource_Status | Veritas Cluster Resource Status | 2.0.0 | Veritas cluster resource status. Possible values 0 - Resource state is not online on any cluster node, 1 - Resource state in online on any cluster node. | ||
| veritas_cluster_group_failover_Status | Veritas Cluster Group Failover Status | 2.0.0 | Veritas cluster service group failover status. Possible values 0 - No change. 1 - Cluster group change from one node to another due to failover. 2 - The specific cluster group is not online on any cluster node. | ||
| veritas_cluster_service_status_LLT | Veritas Cluster LLT Service Status | 2.0.0 | Low latency transport status, used for communication between nodes in the cluster. Possible values are 1-Active, 0-Inactive. | ||
| veritas_cluster_service_status_GAB | Veritas Cluster GAB Service Status | 2.0.0 | Group membership and Atomic Broadcast service status, used for creating membership between all the nodes. Possible values 1-Active, 0-Inactive. | ||
| veritas_cluster_service_status_Fencing | Veritas Cluster Fencing Service Status | 2.0.0 | Fencing service status. Possible values 1-Active, 0-Inactive. | ||
| veritas_cluster_highAvailability_daemon_Status | Veritas Cluster HighAvailability Daemon Status | 2.0.0 | High availability daemon status, main VCS engine which manages the agents and service groups. Possible values 1-Active, 0-Inactive. | ||
| veritas_cluster_highAvailabilityCompanion_daemon_Status | Veritas Cluster HighAvailability Companion Daemon Status | 2.0.0 | High availability companion daemon ( hashadow) status. Possible values 1-Active, 0-Inactive. | ||
| veritas_cluster_resourceAgent_daemon_Status | Veritas Cluster ResourceAgent Daemon Status | 2.0.0 | Resource agent daemon status. Possible values 1-Active, 0-Inactive. | ||
| veritas_cluster_clusterMgmt_daemon_Status | Veritas Cluster ClusterManagement Daemon Status | 2.0.0 | Web console cluster management daemon status. Possible values 1-Active, 0-Inactive. | ||
| veritas_cluster_volumeManager_daemon_Status | Veritas Cluster VolumeManager Daemon Status | 2.0.0 | Volume manager daemon status, manages disk configurations at veritas level. Possible values 1-Active, 0-Inactive. | ||
| veritas_cluster_RunningMode | Veritas Cluster Running Mode | 2.0.0 | Veritas cluster running mode of the configuration(/etc/VRTSvcs/conf/config/main.cf). Possible values 1-ReadOnly,0-Writemode. | ||
| veritas_cluster_active_NodeCount | Veritas Cluster Running Node Count | count | 2.0.0 | Count of the running cluster nodes at that instance. | |
| veritas_cluster_running_NodeCount | Veritas Cluster Running Node Count | count | 2.0.0 | Count of the running cluster nodes at that instance. | |
| veritas_cluster_node_Health | Veritas Cluster Node Health | % | 2.0.0 | Cluster health - percentage of running nodes. | |
| veritas_cluster_system_os_Uptime | System Uptime | m | 2.0.0 | Time lapsed since last reboot in minutes. | |
| veritas_cluster_system_cpu_Load | System CPU Load | 2.0.0 | Monitors the system's last 1min, 5min and 15min load. It sends per cpu core load average. | ||
| veritas_cluster_system_cpu_UsageStats | System CPU Usage Statistics | % | 2.0.0 | Monitors cpu time in percentage spent in various program spaces. User - The processor time spent running user space processes System - The amount of time that the CPU spent running the kernel. IOWait - The time the CPU spends idle while waiting for an I/O operation to complete Idle - The time the processor spends idle Steal - The time virtual CPU has spent waiting for the hypervisor to service another virtual CPU running on a different virtual machine. Kernal Time Total Time. | |
| veritas_cluster_system_disk_inode_Utilization | System Disk Inode Utilization | % | 2.0.0 | This monitor is to collect DISK Inode metrics for all physical disks in a server. | |
| veritas_cluster_system_disk_FreeSpace | System Disk FreeSpace | GB | 2.0.0 | Monitors the Free Space usage in GB. | |
| veritas_cluster_system_disk_UsedSpace | System Disk UsedSpace | GB | 2.0.0 | Monitors disk used space in GB | |
| veritas_cluster_system_disk_Utilization | System Disk Utilization | % | 2.0.0 | Monitors disk utilization in percentage. | |
| veritas_cluster_system_cpu_Utilization | System CPU Utilization | % | 2.0.0 | The percentage of elapsed time that the processor spends to execute a non-Idle thread(This doesn't includes CPU steal time). | |
| veritas_cluster_system_memory_UsedSpace | System Memory Used Space | GB | 2.0.0 | Physical and virtual memory usage in GB | |
| veritas_cluster_system_memory_Utilization | System Memory Utilization | % | 2.0.0 | Physical and virtual memory usage in percentage. | |
| veritas_cluster_system_network_interface_OutTraffic | System Network Out Traffic | Kbps | 2.0.0 | Monitors Out traffic of each interface for linux Devices. | |
| veritas_cluster_system_network_interface_InDiscards | System Network In discards | psec | 2.0.0 | Monitors Network in discards of each interface for linux Devices. | |
| veritas_cluster_system_network_interface_OutPackets | System Network out packets | packets/sec | 2.0.0 | Monitors Out packets of each interface for linux Devices. | |
| veritas_cluster_system_network_interface_OutErrors | System Network Out Errors | Errors per Sec | 2.0.0 | Monitors network out errors of each interface for linux Devices. | |
| veritas_cluster_system_network_interface_OutDiscards | System Network Out discards | psec | 2.0.0 | Monitors network Out Discards of each interface for linux Devices. | |
| veritas_cluster_system_network_interface_InPackets | System Network In packets | packets/sec | 2.0.0 | Monitors in Packets of each interface for linux Devices. | |
| veritas_cluster_system_network_interface_InErrors | System Network In Errors | Errors per Sec | 2.0.0 | Monitors network in errors of each interface for linux Devices. | |
| veritas_cluster_system_network_interface_InTraffic | System Network In Traffic | Kbps | 2.0.0 | Monitors In traffic of each interface for linux Devices | |
| veritas_cluster_lltLinks_State | Veritas Cluster LLT Links State | 2.0.0 | Low latency transport link status on each node. Possible values are 0-CONNWAIT, 1-OPEN. |
Resource Type: Server
| Native Type | Metric Names | Display Name | Unit | Application Version | Description |
|---|---|---|---|---|---|
| Server | veritas_cluster_node_lltInterface_Status | Veritas Node LLT Interface Status | 2.0.0 | Low latency transport interface status on each node. Possible values are 0-DOWN,1-UP | |
| veritas_cluster_node_system_os_Uptime | System Uptime | m | 2.0.0 | Time lapsed since last reboot in minutes. | |
| veritas_cluster_node_system_cpu_Load | System CPU Load | 2.0.0 | Monitors the system's last 1min, 5min and 15min load. It sends per cpu core load average. | ||
| veritas_cluster_node_system_cpu_UsageStats | System CPU Usage Statistics | % | 2.0.0 | Monitors cpu time in percentage spent in various program spaces. User - The processor time spent running user space processes. System - The amount of time that the CPU spent running the kernel. IOWait - The time the CPU spends idle while waiting for an I/O operation to complete. Idle - The time the processor spends idle. Steal - The time virtual CPU has spent waiting for the hypervisor to service another virtual CPU running on a different virtual machine. Kernal Time Total Time | |
| veritas_cluster_node_system_disk_inode_Utilization | System Disk Inode Utilization | % | 2.0.0 | This monitor is to collect DISK Inode metrics for all physical disks in a server. | |
| veritas_cluster_node_system_disk_FreeSpace | System Disk FreeSpace | GB | 2.0.0 | Monitors the Free Space usage in GB. | |
| veritas_cluster_node_system_disk_UsedSpace | System Disk UsedSpace | GB | 2.0.0 | Monitors disk used space in GB | |
| veritas_cluster_node_system_disk_Utilization | System Disk Utilization | % | 2.0.0 | Monitors disk utilization in percentage. | |
| veritas_cluster_node_system_cpu_Utilization | System CPU Utilization | % | 2.0.0 | The percentage of elapsed time that the processor spends to execute a non-Idle thread(This doesn't includes CPU steal time). | |
| veritas_cluster_node_system_memory_UsedSpace | System Memory Used Space | GB | 2.0.0 | Physical and virtual memory usage in GB. | |
| veritas_cluster_node_system_memory_Utilization | System Memory Utilization | % | 2.0.0 | Physical and virtual memory usage in percentage. | |
| veritas_cluster_node_system_network_interface_OutTraffic | System Network Out Traffic | Kbps | 2.0.0 | Monitors Out traffic of each interface for linux Devices. | |
| veritas_cluster_node_system_network_interface_InDiscards | System Network In discards | psec | 2.0.0 | Monitors Network in discards of each interface for linux Devices. | |
| veritas_cluster_node_system_network_interface_OutPackets | System Network out packets | packets/sec | 2.0.0 | Monitors Out packets of each interface for linux Devices. | |
| veritas_cluster_node_system_network_interface_OutErrors | System Network Out Errors | Errors per Sec | 2.0.0 | Monitors network out errors of each interface for linux Devices. | |
| veritas_cluster_node_system_network_interface_OutDiscards | System Network Out discards | psec | 2.0.0 | Monitors network Out Discards of each interface for linux Devices. | |
| veritas_cluster_node_system_network_interface_OutDiscards | System Network Out discards | psec | 2.0.0 | Monitors network Out Discards of each interface for linux Devices. | |
| veritas_cluster_node_system_network_interface_InPackets | System Network In packets | packets/sec | 2.0.0 | Monitors in Packets of each interface for linux Devices. | |
| veritas_cluster_node_system_network_interface_InErrors | System Network In Errors | Errors per Sec | 2.0.0 | Monitors network in errors of each interface for linux Devices. | |
| veritas_cluster_node_system_network_interface_InTraffic | System Network In Traffic | Kbps | 2.0.0 | Monitors In traffic of each interface for linux Devices. |
Configure and Install the Veritas Cluster Integration
- From All Clients, select a client.
- Navigate to Setup > Account.
- Select the Integrations and Apps tab.
- The Installed Integrations page, where all the installed applications are displayed. If there are no installed applications, it will navigate to the Available Integrations and Apps page.
- Click + ADD on the Installed Integrations page. The Available Integrations and Apps page displays all the available applications along with the newly created application with the version.
Note: Search for the application using the search option available. Alternatively, use the All Categories option to search.
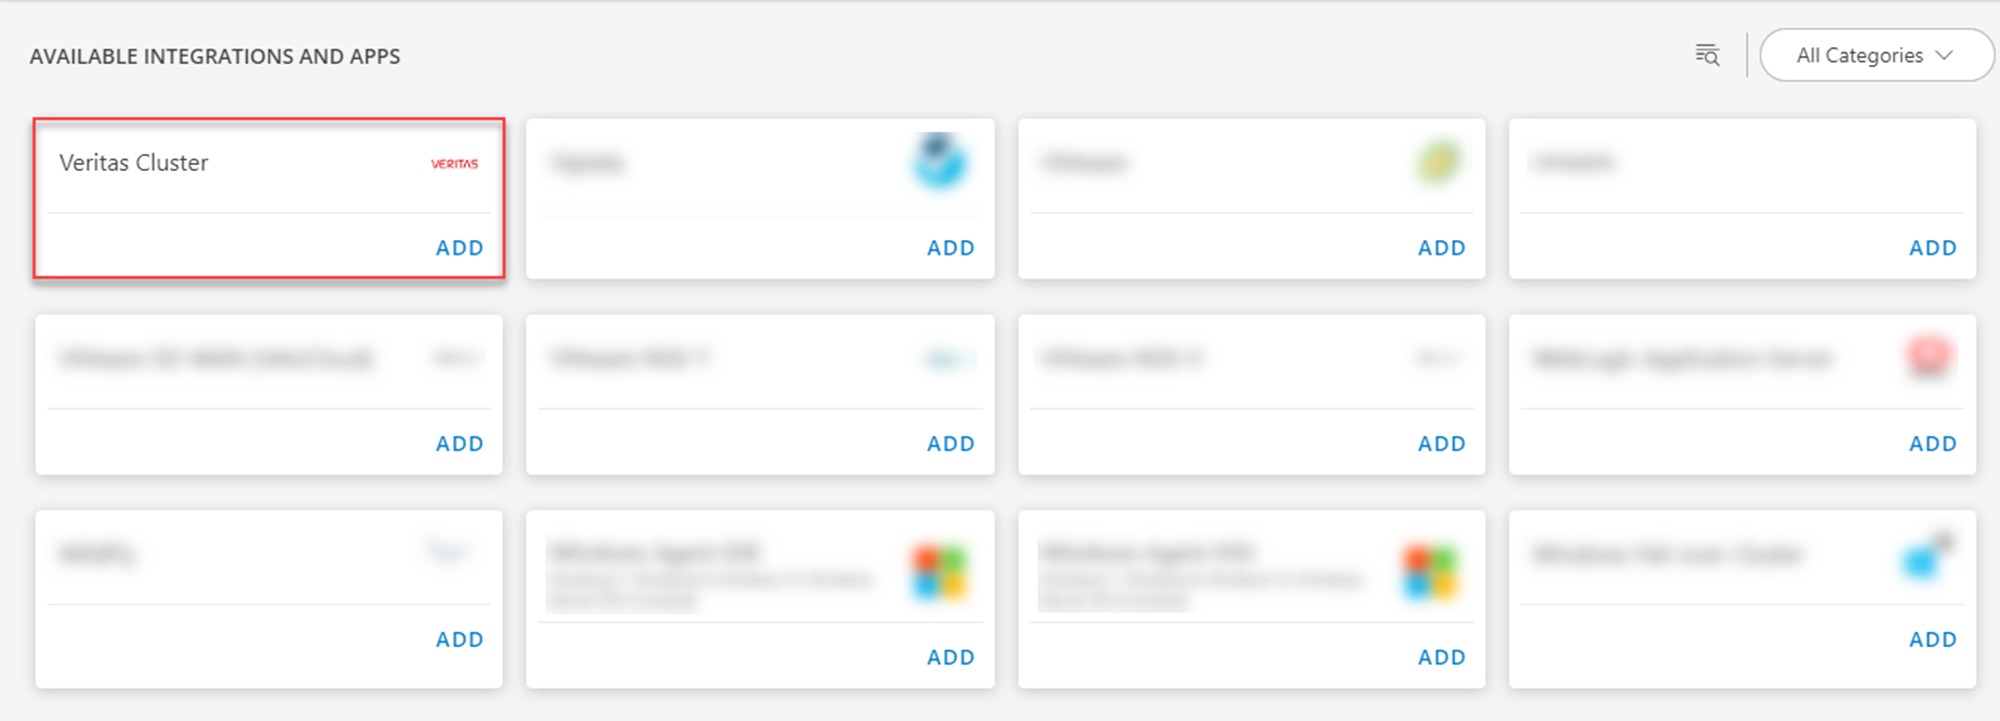
- Click ADD in the Veritas Cluster application.
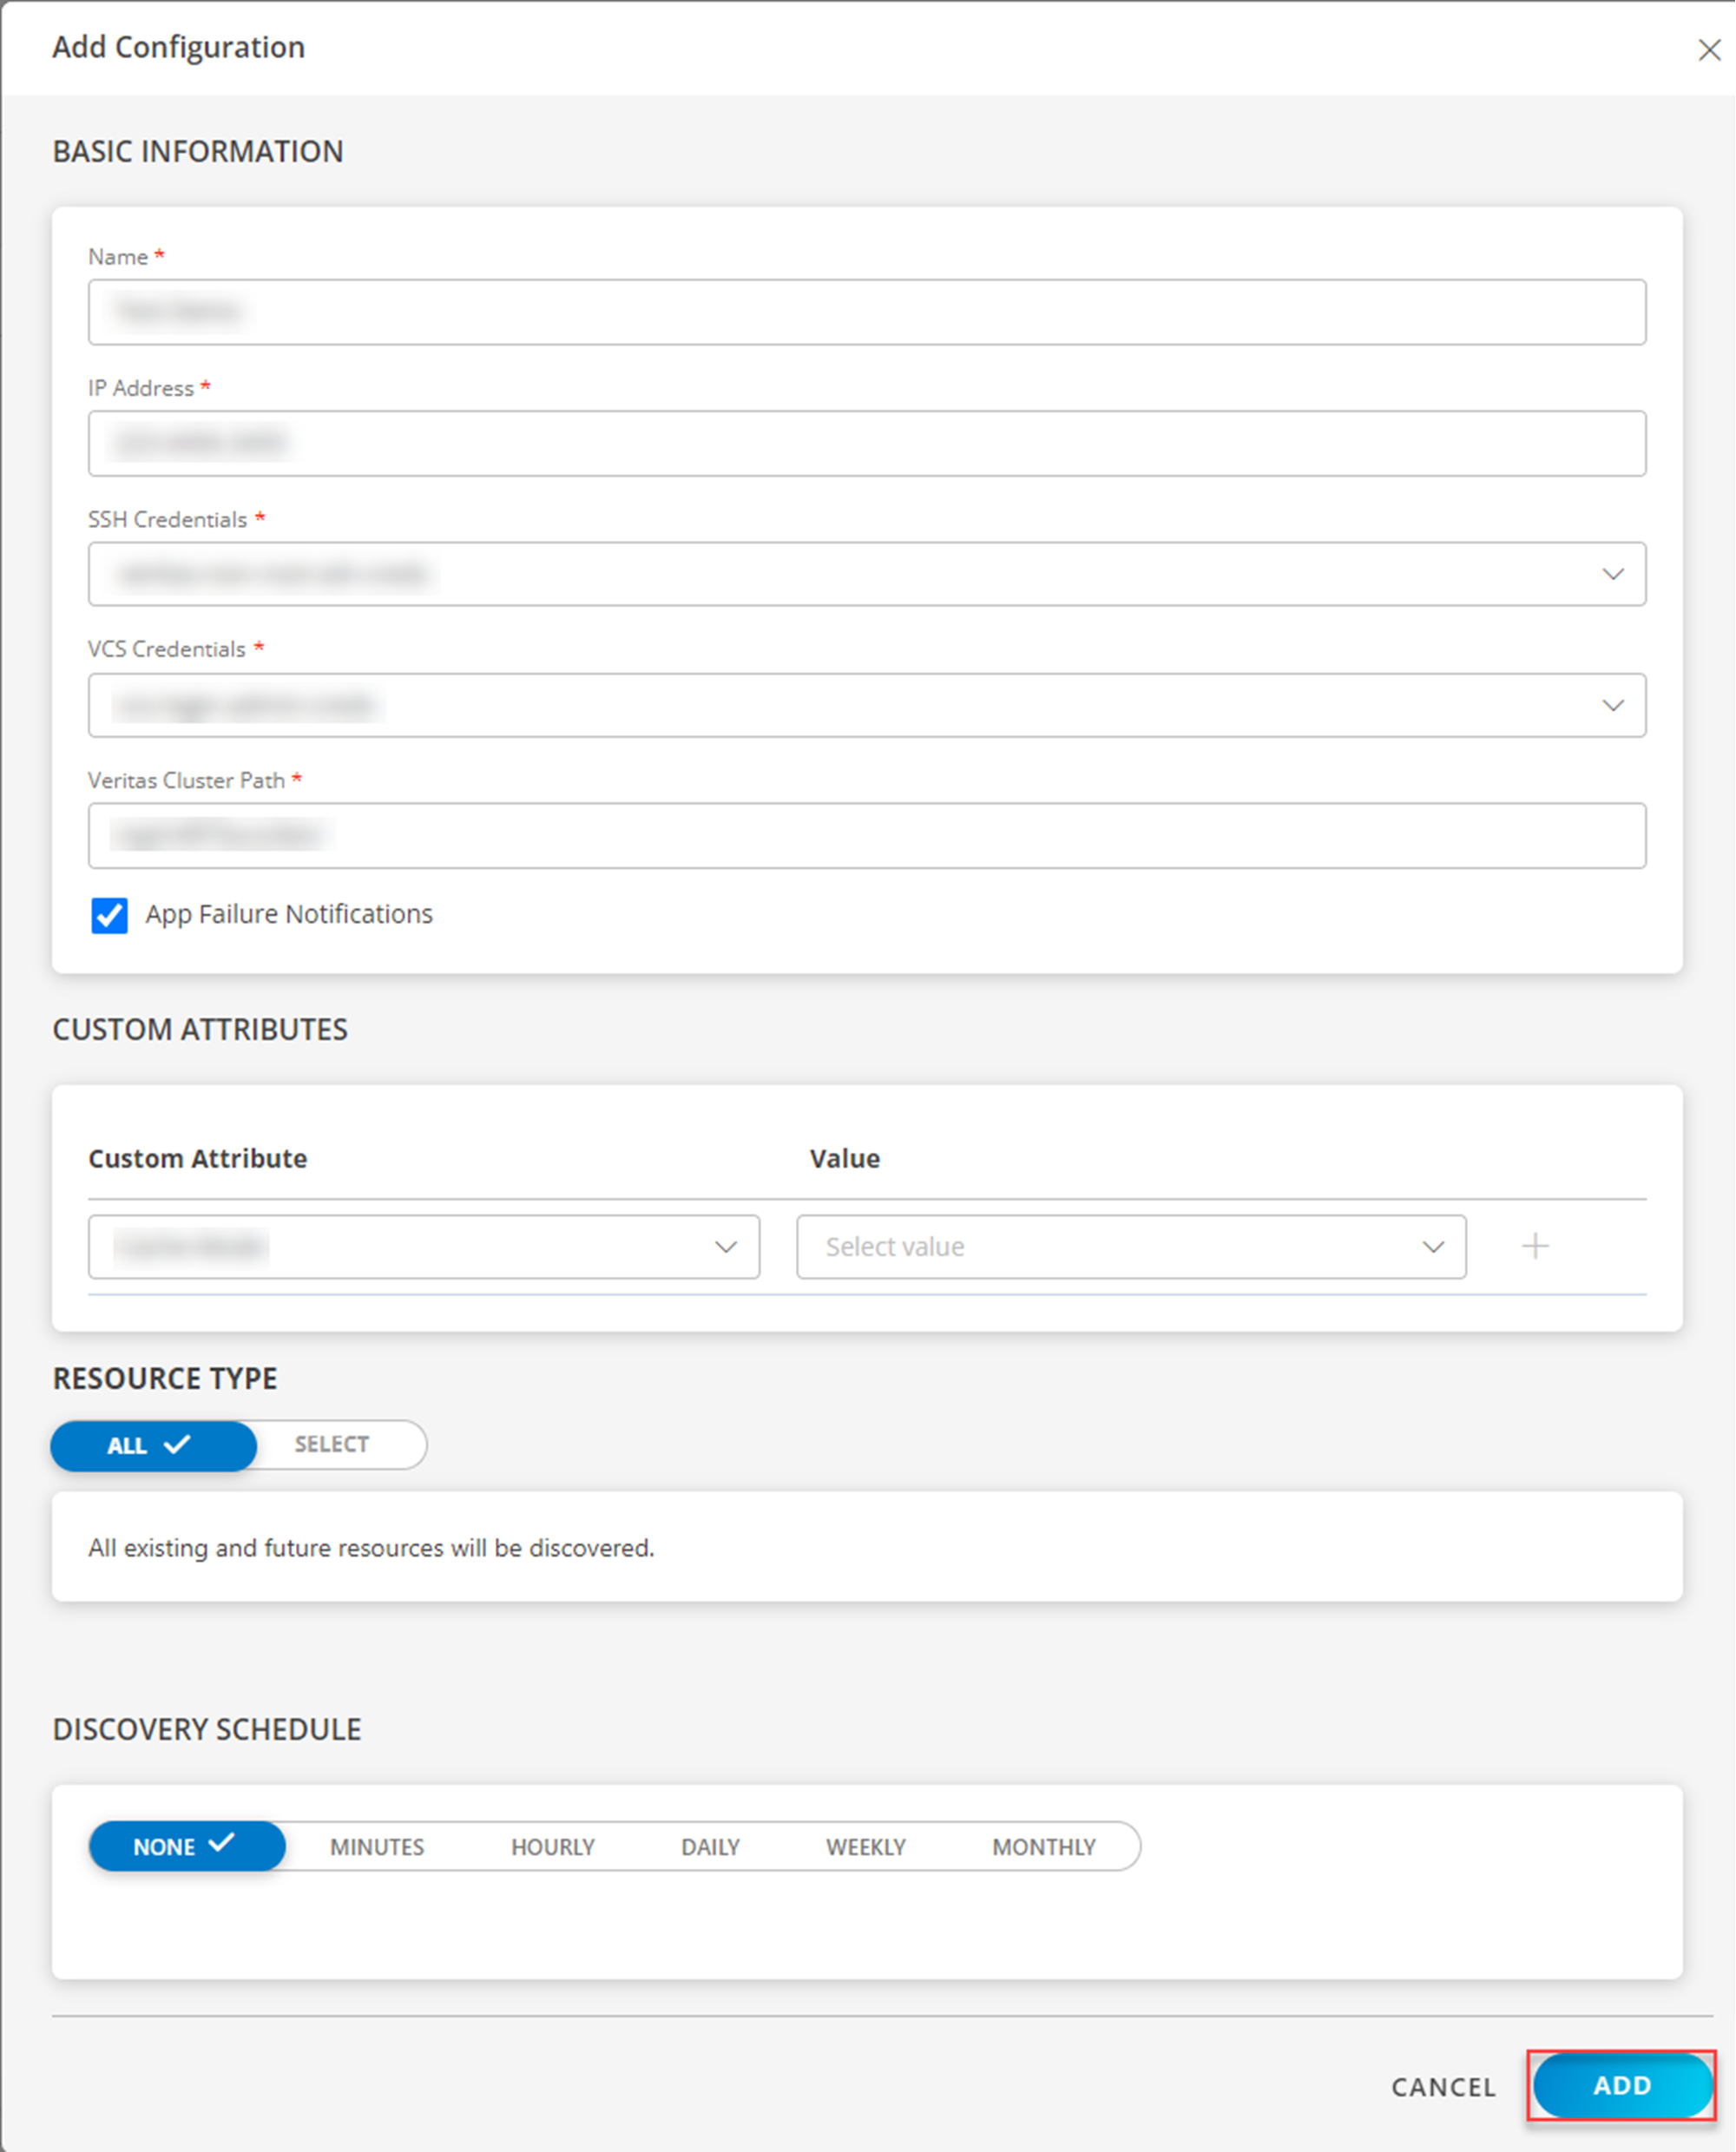
- In the Configuration page, click + ADD. The Add Configuration page appears.
- Enter the below mentioned BASIC INFORMATION:
| Functionality | Description |
|---|---|
| Name | Enter the name for the configuration. |
| IP Address | IP address of the target. |
| SSH Credentials | Select the SSH credentials from the drop-down list. Note: Click + Add to create a credential. |
| VCS Credentials | Select the VCS credentials from the drop-down list. Note: Click + Add to create a credential. |
| Veritas Cluster Path | Enter the Veritas cluster path. Note: By default /opt/VRTSvcs/bin/ is displayed. |
Notes:
- IP Address should be accessible from Gateway.
- Select App Failure Notifications: if turned on, you will be notified in case of an application failure that is, Connectivity Exception, Authentication Exception.
- Select the below mentioned Custom Attribute:
| Functionality | Description |
|---|---|
| Custom Attribute | Select the custom attribute from the drop down list box. |
| Value | Select the value from the drop down list box. |
Note: The custom attribute that you add here will be assigned to all the resources that are created by the integration. You can add a maximum of five custom attributes (key and value pair).
- In the RESOURCE TYPE section, select:
- ALL: All the existing and future resources will be discovered.
- SELECT: You can select one or multiple resources to be discovered.
- In the DISCOVERY SCHEDULE section, select Recurrence Pattern to add one of the following patterns:
- Minutes
- Hourly
- Daily
- Weekly
- Monthly
- Click ADD.
Now the configuration is saved and displayed on the configurations page after you save it. From the same page, you may Edit and Remove the created configuration.
Click Next.
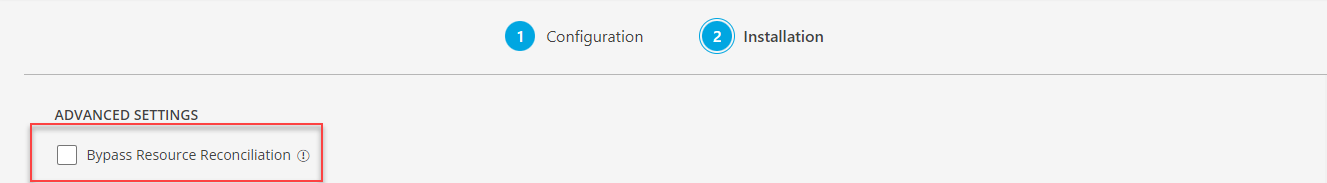
Below are the optional steps you can perform on the Installation page.
Under the ADVANCED SETTINGS, Select the Bypass Resource Reconciliation option, if you wish to bypass resource reconciliation when encountering the same resources discovered by multiple applications.
Note: If two different applications provide identical discovery attributes, two separate resources will be generated with those respective attributes from the individual discoveries.
- Click +ADD to create a new collector by providing a name or use the pre-populated name.
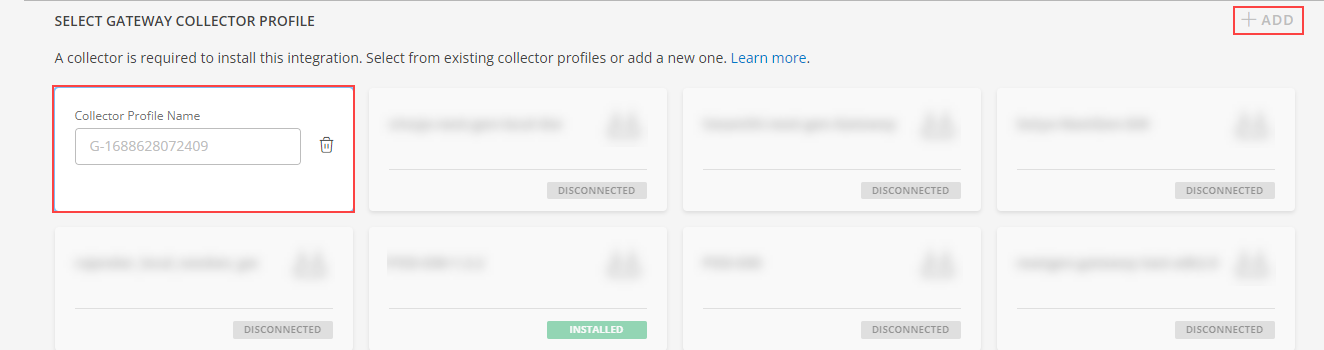
- Select an existing registered profile.
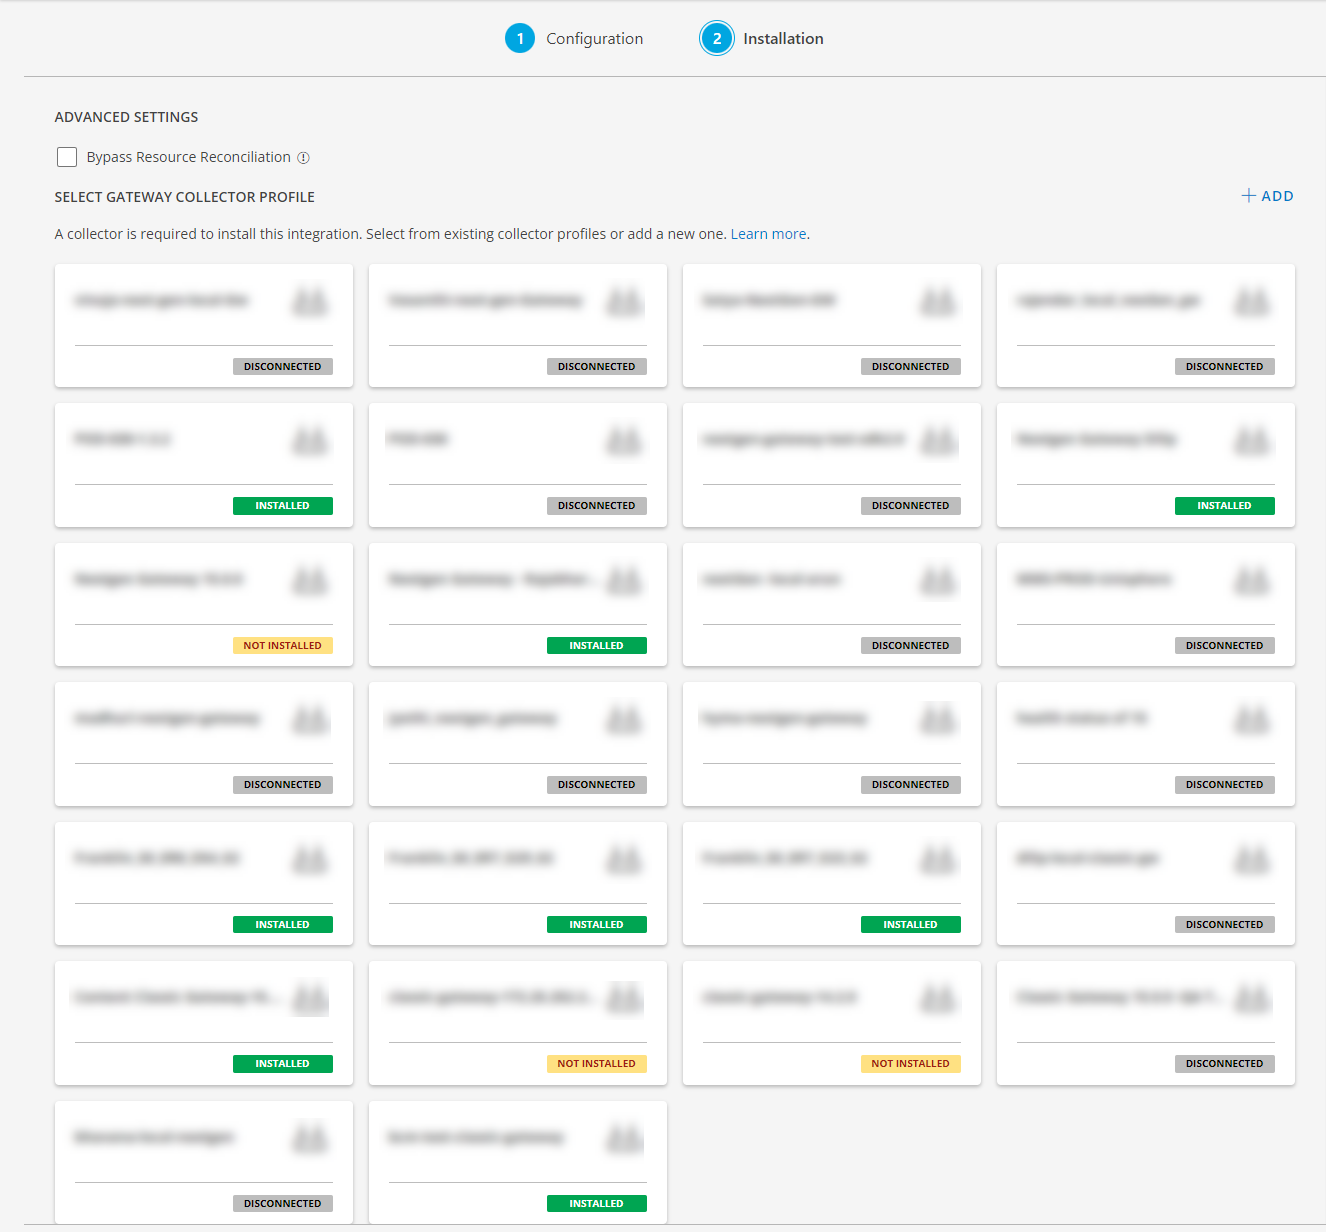
- Click FINISH.
The integration is installed and displayed on the INSTALLED INTEGRATION page. Use the search field to find the installed integration.
Modify the Configuration
See Modify an Installed Integration or Application article.
Note: Select the Veritas Cluster application.
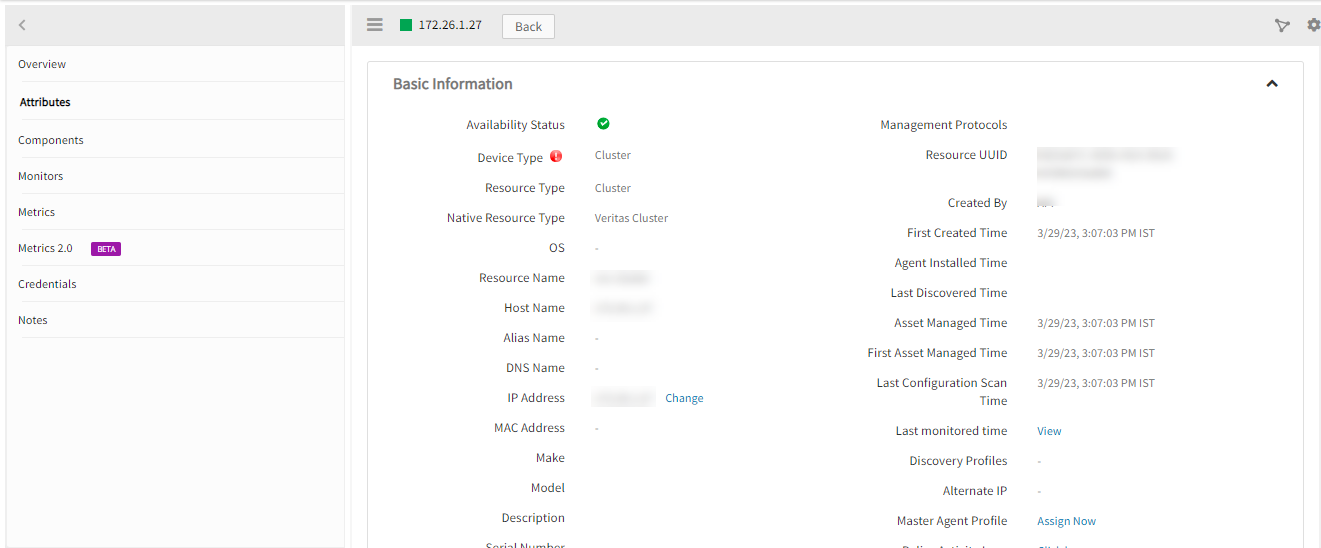
View the Veritas Cluster details
The discovered resource(s) are displayed in Infrastructure > Resources > Cluster, with Native Resource Type as Veritas Cluster. You can navigate to the Attributes tab to view the discovery details, and the Metrics tab to view the metric details for Veritas Cluster.
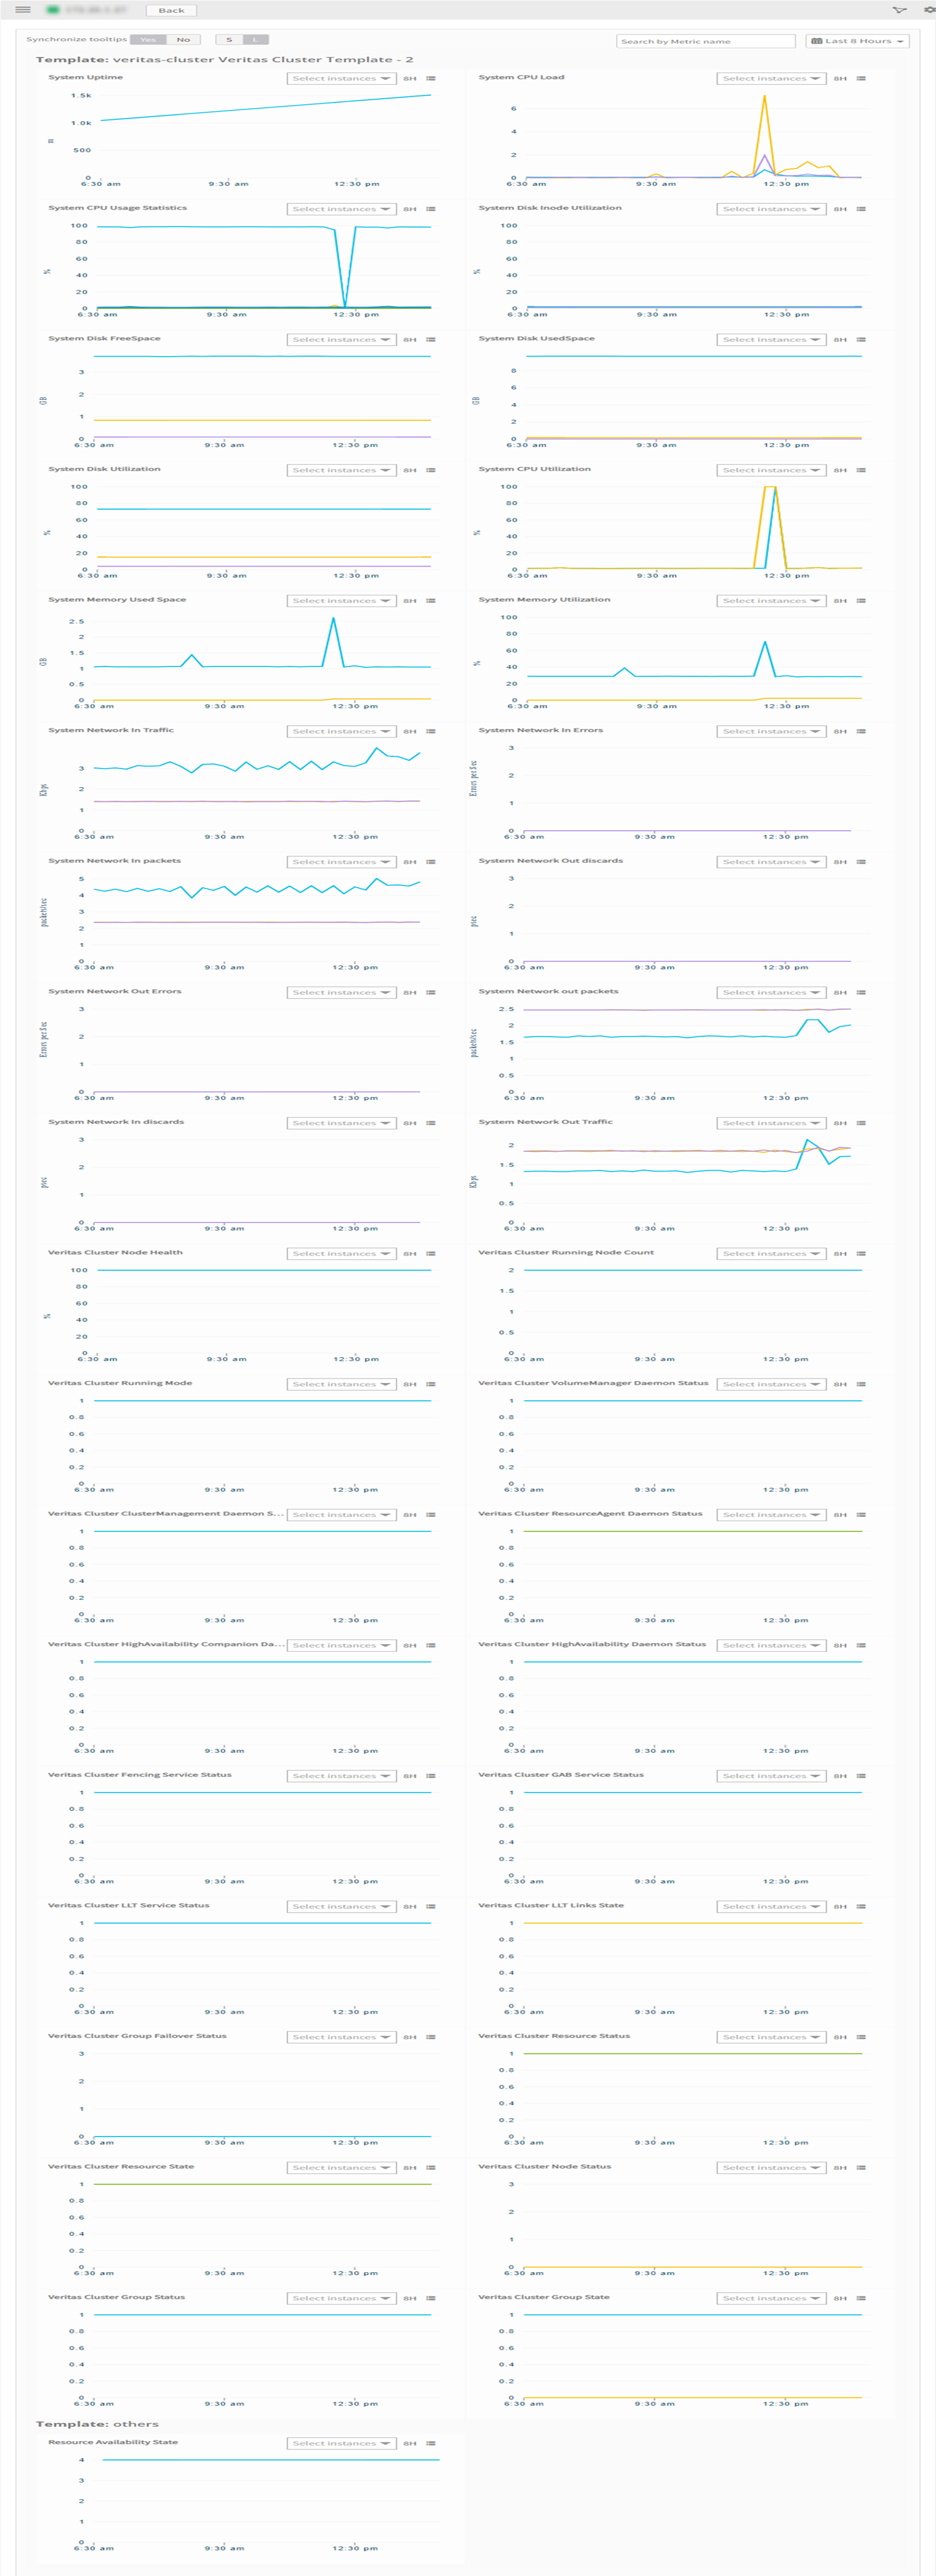
View Resource Metrics
To confirm Veritas Cluster monitoring, review the following:
- Metric graphs: A graph is plotted for each metric that is enabled in the configuration.
- Alerts: Alerts are generated for metrics that are configured as defined for integration.
Resource Type Filter Keys
Veritas-cluster application Resources are filtered and discovered based on below keys.
Click here to view the Supported Input Keys
| Resource Type | Resource Type |
|---|---|
| All Types | resourceName |
| hostName | |
| aliasName | |
| dnsName | |
| ipAddress | |
| macAddress | |
| os | |
| make | |
| model | |
| serialNumber | |
| systemUID | |
| Veritas Cluster | Veritas Infoscale software version |
| Server | Veritas Infoscale software version |
Supported Alert Custom Macros
Customize the alert subject and description with below macros then it will generate alerts based on customisation.
Supported macros keys:
Click here to view the alert subject and description with macros
${resource.name}
${resource.ip}
${resource.mac}
${resource.aliasname}
${resource.os}
${resource.type}
${resource.dnsname}
${resource.alternateip}
${resource.make}
${resource.model}
${resource.serialnumber}
${resource.systemId}
${parent.resource.name}
${Custom attributes on the resource}
Risks, Limitations & Assumptions
- As of now supporting only Linux based Veritas failover cluster.
- When we add two configurations with same end device details (like IP, credentials), we might observe gaps in the graphs due to internal VCS login and logouts parallely on the same device.
- Application can handle Critical/Recovery failure notifications for below two cases when user enables App Failure Notifications in configuration
- Connectivity Exception
- Authentication Exception
- Application will not send any duplicate/repeat failure alert notification until the already existing critical alert is recovered.
- Using metrics for monitoring the resources and generating alerts when the threshold values are breached.
- Application cannot control monitoring pause/resume actions based on above alerts.
- No support of showing activity log and applied time.
- This application supports both Classic Gateway and NextGen Gateway.