Supported Versions |
---|
Windows Server 2019 |
Introduction
High availability enables your IT infrastructure to function continuously though some of the components may fail. High availability plays a vital role in case of a severe disruption in services that may lead to severe business impact.
It is a concept that entails the elimination of single points of failure to make sure that even if one of the components fail, such as a server, the service is still available.
Failover
Failover is a process. Whenever a primary system, network or a database fails or is abnormally terminated, then a Failover acts as a standby which helps resume these operations.
Failover Cluster
Failover cluster is a set of servers that work together to provide High Availability (HA) or Continuous availability (CA). As mentioned earlier, if one of the servers goes down another node in the cluster can take over its workload with minimal or no downtime. Some failover clusters use physical servers whereas others involve virtual machines (VMs).
CA clusters allow users to access and work on the services and applications without any incidence of timeouts (100% availability), in case of a server failure. HA clusters, on the other hand, may cause a short hiatus in the service, but system recovers automatically with minimum downtime and no data loss.
A cluster is a set of two or more nodes (servers) that transmit data for processing through cables or a dedicated secure network. Even load balancing, storage or concurrent/parallel processing is possible through other clustering technologies.

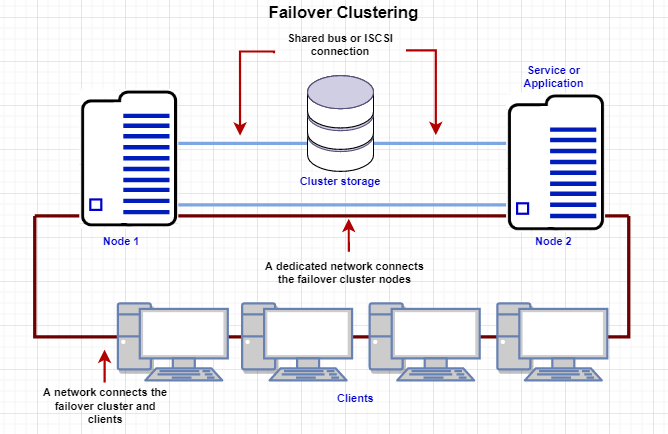
If you look at the above image, Node 1 and Node 2 have common shared storage. Whenever one node goes down, the other one will pick up from there. These two nodes have one virtual IP that all other clients connect to.
Let us take a look at the two failover clusters, namely High Availability Failover Clusters and Continuous Availability Failover Clusters.
High Availability Failover Clusters
In case of High Availability Failover Clusters, a set of servers share data and resources in the system. All the nodes have access to the shared storage.
High availability clusters also include a monitoring connection that servers use to check the “heartbeat” or health of the other servers. At any time, at least one of the nodes in a cluster is active, while at least one is passive.
Continuous Availability Failover Clusters
This system consists of multiple systems that share a single copy of a computer’s operating system. Software commands issued by one system are also executed on the other systems. In case of a failover, the user can check critical data in a transaction.
There are a few Failover Cluster types like Windows Server Failover Cluster (WSFC), VMware Failover Clusters, SQL Server Failover Clusters, and Red Hat Linux Failover Clusters.
Windows Server Failover Clustering (WSFC)
One of the powerful features of Windows Server is the ability to create Windows failover clusters. With Windows Server 2019, Windows Failover Clustering is more powerful than ever and can host many highly available resources for business-critical workloads.
Following are the types of Windows Server 2019 Failover Clustering:
- Hyper-V Clustering
- Clustering for File Services
- Scale-Out File Server
- Application Layer Clustering
- Host Layer Clustering
- Tiered Clustering
Each provides tremendous capabilities to ensure production workloads are resilient and highly available.
Windows Server 2019 Failover Clustering supports the new and demanding use cases with a combination of various cluster types and applications of various clustering technologies.
Windows Server Failover Clustering (WSFC) is a feature of the Windows server platform for improving the high availability of clustered roles (formerly called clustered applications and services). For example, say there are two servers. They communicate through a series of heartbeat signals over a dedicated network.
Prerequisites
- OpsRamp Classic Gateway 12.0.1 and above.
- PS Remoting and WMI remoting to be enabled on each cluster node. If the configured user is non-administrator, then the below user should have privileges on WMI remoting and on Windows Services.
Following are the specific prerequisites for non-administrator/operator level users:
Enable WMI Remoting**
To enable WMI remoting:
- Click Start and select Run.
- Enter wmimgmt.msc and click OK.
- Right click WMI control (Local) and select Properties.
- Click Security tab.
- Expand Root.
- Select WMI and Click Security.
- Add user and select the following permissions:
- Execute methods
- Enable account
- Enable remoting
- Read security
- Execute methods
Enable WMI Remoting – CPU, Disk, Network**
- Click Start and select Run.
- Enter lusrmgr.msc and click OK.
- In the Groups folder, right click Performance Monitor Users and select Properties.
- Click Members of tab, and click Add.
- Add users.
Enable Windows Service Monitoring**
- Retrieve the user SID of the User Account from the monitored device.
- Open Command Prompt in Administrator mode.
- Run the below command to retrieve the user SID.
Note: Replace UserName with the user name for the User account.
wmic useraccount where name="UserName" get name,sid Example: wmic useraccount where name="apiuser" get name,sid
- Note down the SID.
(Ex. S-1-0-10-200000-30000000000-4000000000-500)
- Retrieve the current SDDL for the SC Manager.
- Run the below command which will save the current SDDL for the SC Manager to CurrentSDDL.txt.
sc sdshow clussvc > CurrentSDDL.txt
- Edit the CurrentSDDL.txt and copy the entire content.
The SDDL will look like below:
D:(A;;CC;;;AU)(A;;CCLCRPRC;;;IU)(A;;CCLCRPRC;;;SU)(A;;CCLCRPWPRC;;;SY)(A;;KA;;;BA)(A;;CC;;;AC)S:(AU;FA;KA;;;WD)(AU;OIIOFA;GA;;;WD)
- Update the SDDL:
Frame new SDDL snippet for above SID
(A;;CCLCRPWPRC;;; <SID of User> ) Example: (A;;CCLCRPWPRC;;;S-1-0-10-200000-30000000000-4000000000-500)
- Place this snippet before “S:” of original SDDL.
Updated SDDL will be like this:
D:(A;;CC;;;AU)(A;;CCLCRPRC;;;IU)(A;;CCLCRPRC;;;SU)(A;;CCLCRPWPRC;;;SY)(A;;KA;;;BA)(A;;CC;;;AC)(A;;CCLCRPWPRC;;;S-1-0-10-200000-30000000000-4000000000-500)S:(AU;FA;KA;;;WD)(AU;OIIOFA;GA;;;WD)
- Execute the below command with the updated SDDL:
sc sdset clussvc D:(A;;CC;;;AU)(A;;CCLCRPRC;;;IU)(A;;CCLCRPRC;;;SU)(A;;CCLCRPWPRC;;;SY)(A;;KA;;;BA)(A;;CC;;;AC)(A;;CCLCRPWPRC;;;S-1-0-10-200000-30000000000-4000000000-500)S:(AU;FA;KA;;;WD)(AU;OIIOFA;GA;;;WD)
- Retrieve the user SID of the User Account from the monitored device.
Open ports and add user in all nodes and cluster**
- Opsramp gateway should be able to access cluster and nodes.
- Ports to be opened are 5985 and 5986.
Note: By default, WS-Man and PowerShell remoting use port 5985 and 5986 for connections over HTTP and HTTPS, users should be present in nodes and cluster.
- Opsramp gateway should be able to access cluster and nodes.
Hierarchy of Windows Failover Cluster
Windows Failover Cluster
- Windows Cluster Node
Default monitoring configurations
Windows-Failover-Cluster has default Global Device Management Policies, Global Templates, Global Monitors and Global metrics in OpsRamp. You can customize these default monitoring configurations as per your business use cases by cloning respective Global Templates and Global Device Management Policies. OpsRamp recommends doing this activity before installing the application to avoid noise alerts and data.
Default Global Device Management Policies
OpsRamp has a Global Device Management Policy for each Native Type of Windows-Failover-Cluster. You can find these Device Management Policies at Setup -> Resources -> Device Management Policies -> Search with suggested names in global scope. Each Device Management Policy follows below naming convention:
{appName nativeType - version}
Ex: windows-failover-cluster Windows Failover Cluster - 1 (i.e, appName = windows-failover-cluster , nativeType = Windows Failover Cluster , version = 1)
Default Global Templates
OpsRamp has a Global template for each Native Type of Windows-Failover-Cluster. You can find these templates at Setup -> Monitoring -> Templates -> Search with suggested names in global scope. Each template follows below naming convention:
{appName nativeType 'Template' - version}
Ex: windows-failover-cluster Windows Failover Cluster Template - 1(i.e, appName = windows-failover-cluster, nativeType = Windows Failover Cluster,version=1)
Default Global Monitors
OpsRamp has a Global Monitors for each Native Type which has monitoring support. You can find these monitors at Setup -> Monitoring -> Monitors -> Search with suggested names in global scope. Each Monitors follows below naming convention:
{monitorKey appName nativeType - version}
Ex: Windows Failover Cluster Monitor windows-failover-cluster Windows Failover Cluster 1 (i.e, monitorKey = Windows Failover Cluster Monitor, appName = windows-failover-cluster, nativeType = Windows Failover Cluster, version = 1)
Configure and install the integration
- From All Clients, select a client
- Go to Setup > Integrations and Apps.
- Click Manage Apps.
Notes:- If there are already installed applications, it will redirect to the INSTALLED APPS page, where all the installed applications are displayed.
- If there are no installed applications, it will navigate to the ADD APP page.

- Click + ADD on the INSTALLED APP page. The AVAILABLE INTEGRATIONS AND APPS page displays all the available applications along with the newly created application with the version.
Note: You can even search for the application using the search option available. Also you can use the All Categories option to search.

- Click ADD in the Windows Fail-over Cluster application.
- In the Configurations page, click + ADD. The Add Configuration page appears.
- Enter the below mentioned BASIC INFORMATION:
Funtionality | Description |
---|---|
Name | Enter the name for the configuration. |
IP Address/Host Name | IP address/host name of the target. |
Credentials | Select the credentials from the drop-down list. Note: Click + Add to create a credential. |
Note: Select App Failure Notifications; if turned on, you will be notified in case of an application failure that is, Connectivity Exception, Authentication Exception.
In the Custom Attributes section, select the custom attribute key and value from the dropdown boxes.
Note: The custom attribute that you add here will be assigned to all the resources that are created by the configuration. You can add a maximum of 5 custom attributes (key and value pair).In the RESOURCE TYPE section, select:
- ALL: All the existing and future resources will be discovered.
- SELECT: You can select one or multiple resources to be discovered.
In the DISCOVERY SCHEDULE section, select Recurrence Pattern to add one of the following patterns:
- Minutes
- Hourly
- Daily
- Weekly
- Monthly
Click Save.
Now the configuration is saved and displayed on the configurations page after you save it.
Note: From the same page, you may Edit and Remove the created configuration.
- Click NEXT.
- In the Installation page, select an existing registered gateway profile, and click FINISH.

The application is now installed and displayed on the Installed Integration page. Use the search field to find the installed application.
Modify the Configuration
See Modify an Installed Integration or Application article.
Note: Select the Windows Fail-over Cluster application.
View the Windows failover cluster device details
The discovered resource(s) are displayed in the Infrastructure page under Cluster, with Native Resource Type as Windows Failover Cluster. You can navigate to the Attributes tab to view the discovery details, and Metrics tab to view the metric details for Windows Failover Cluster.

The cluster nodes are displayed under Components.

Supported Alert Custom Macros
Customize the alert subject and description with below macros then it will generate alert based on customisation.
Supported macros keys:
${resource.name}
${resource.ip}
${resource.mac}
${resource.aliasname}
${resource.os}
${resource.type}
${resource.dnsname}
${resource.alternateip}
${resource.make}
${resource.model}
${resource.serialnumber}
${resource.systemId}
${Custome Attributes in the resource}
${parent.resource.name}
Supported Metrics
Resource Type: Cluster
Metric Names | Description | Unit | Description |
---|---|---|---|
windows_cluster_node_state | Windows Cluster Node State | State of all nodes of the cluster such as up or down. Possible values 0-DOWN,1-UP | |
windows_cluster_group_state | Windows Cluster Group State | State of cluster group of the failover cluster. Possible values 0-OFFLINE,1-ONLINE | |
windows_cluster_group_failover_status | Windows Cluster Group Failover Status | Whenever the owner node which is hosting all the cluster services, goes down any other node becomes owner node automatically. This metric explains whether the current node was the owner node, when the last failover happened. Possible values 0-FALSE,1-TRUE | |
windows_cluster_node_health | Windows Cluster Node Health | % | Cluster health - percentage of online nodes |
windows_cluster_resource_state | Windows Cluster Resource State | State of resources with in failover cluster. Possible values 0-OFFLINE,1-ONLINE | |
windows_cluster_online_nodes_count | Windows Cluster Online Nodes Count | count | Count of online node, when status is Up |
Windows_cluster_system_os_Uptime | System Uptime | m | Time lapsed since last reboot in minutes |
Windows_cluster_system_cpu_Load | System CPU Load | Monitors the system's last 1min, 5min and 15min load. It sends per cpu core load average. | |
Windows_cluster_system_cpu_Utilization | System CPU Utilization | % | The percentage of elapsed time that the processor spends to execute a non-Idle thread(This doesn't includes CPU steal time) |
Windows_cluster_system_memory_Usedspace | System Memory Used Space | GB | Physical and virtual memory usage in GB |
Windows_cluster_system_memory_Utilization | System Memory Utilization | % | Physical and virtual memory usage in percentage. |
Windows_cluster_system_cpu_IdleTime | System CPU IdleTime | % | The percentage of idle time that the processor spends on waiting for an operation. |
Windows_cluster_system_disk_Usedspace | System Disk UsedSpace | GB | Monitors disk used space in GB |
Windows_cluster_system_disk_Utilization | System Disk Utilization | % | Monitors disk utilization in percentage |
Windows_cluster_system_disk_Freespace | System Disk FreeSpace | GB | Monitors the Free Space usage in GB |
Windows_cluster_system_network_interface_InTraffic | System Network In Traffic | Kbps | Monitors In traffic of each interface for windows Devices |
Windows_cluster_system_network_interface_OutTraffic | System Network Out Traffic | Kbps | Monitors Out traffic of each interface for windows Devices |
Windows_cluster_system_network_interface_InPackets | System Network In packets | packets/sec | Monitors in Packets of each interface for windows Devices |
Windows_cluster_system_network_interface_OutPackets | System Network out packets | packets/sec | Monitors Out packets of each interface for windows Devices |
Windows_cluster_system_network_interface_InErrors | System Network In Errors | Errors per Sec | Monitors network in errors of each interface for windows Devices |
Windows_cluster_system_network_interface_OutErrors | System Network Out Errors | Errors per Sec | Monitors network out errors of each interface for windows Devices |
Windows_cluster_system_network_interface_InDiscords | System Network In discards | psec | Monitors Network in discards of each interface for windows Devices |
Windows_cluster_system_network_interface_OutDiscords | System Network Out discards | psec | Monitors network Out Discards of each interface for windows Devices |
Resource Type: Server
Metric Names | Description | PS cmdlet | Sample output |
---|---|---|---|
windows_cluster_node_service_status | Windows Cluster Node Service Status | State of each node's windows os service named cluster service which is responsible for windows failover cluster. Possible values 0-STOPPED,1-RUNNING | |
Windows_cluster_node_system_os_Uptime | System Uptime | m | Time lapsed since last reboot in minutes |
Windows_cluster_node_system_cpu_Load | System CPU Load | Monitors the system's last 1min, 5min and 15min load. It sends per cpu core load average. | |
Windows_cluster_node_system_cpu_Utilization | System CPU Utilization | % | The percentage of elapsed time that the processor spends to execute a non-Idle thread(This doesn't includes CPU steal time) |
Windows_cluster_node_system_memory_Usedspace | System Memory Used Space | GB | Physical and virtual memory usage in GB |
Windows_cluster_node_system_memory_Utilization | System Memory Utilization | % | Physical and virtual memory usage in percentage. |
Windows_cluster_node_system_cpu_IdleTime | System CPU IdleTime | % | The percentage of idle time that the processor spends on waiting for an operation. |
Windows_cluster_node_system_disk_Usedspace | System Disk UsedSpace | GB | Monitors disk used space in GB |
Windows_cluster_node_system_disk_Utilization | System Disk Utilization | % | Monitors disk utilization in percentage |
Windows_cluster_node_system_disk_Freespace | System Disk FreeSpace | GB | Monitors the Free Space usage in GB |
Windows_cluster_node_system_network_interface_InTraffic | System Network In Traffic | Kbps | Monitors In traffic of each interface for windows Devices |
Windows_cluster_node_system_network_interface_OutTraffic | System Network Out Traffic | Kbps | Monitors Out traffic of each interface for windows Devices |
Windows_cluster_node_system_network_interface_InPackets | System Network In packets | packets/sec | Monitors in Packets of each interface for windows Devices |
Windows_cluster_node_system_network_interface_OutPackets | System Network out packets | packets/sec | Monitors Out packets of each interface for windows Devices |
Windows_cluster_node_system_network_interface_InErrors | System Network In Errors | Errors per Sec | Monitors network in errors of each interface for windows Devices |
Windows_cluster_node_system_network_interface_OutErrors | System Network Out Errors | Errors per Sec | Monitors network out errors of each interface for windows Devices |
Windows_cluster_node_system_network_interface_InDiscords | System Network In discards | psec | Monitors Network in discards of each interface for windows Devices |
Windows_cluster_node_system_network_interface_OutDiscords | System Network Out discards | psec | Monitors network Out Discards of each interface for windows Devices |
Risks, Limitations & Assumptions
- For Cluster Object Discovery and Monitoring implementation, We are considering the object which has Name equals to Cluster Name in Get-ClusterResource response.
- For ClusterGroup monitoring implementation, We are considering the object which has Name as Cluster Group in Get-ClusterGroup response.
- windows_cluster_group_failover_status metric’s possible instance values are 0-if there is no change in OwnerNode, 1-If there is a change in OwnerNode, 2 If no OwnerNode.
- Application can handle Critical/Recovery failure alert notifications for below two cases of when user enables App Failure Notifications in configuration:
- Connectivity Exception
- Authentication Exception
- If user enables agent monitoring templates on the Cluster/Node resource, he might see the duplicate metrics with different naming conventions.
- If user enables same thresholds on Additional OS level monitoring metrics on both Cluster and Node, he might see 2 alerts with same details with respective metric names (i.e, Windows_cluster_system_disk_Utilization, Windows_cluster_node_system_disk_Utilization).
- While trying to fetch the node ip address we receive multiple node ips, which will include many local ips and actual ips (example : lets say actual node ip is 10.1.1.1 when trying to fetch the details we will receive two ips one associated with custer(192.168.0.0) and other is the actual ip). to identify the actual node ip address from the list of ip addresses received we are assuming that node ip address is part of the same subnet of cluster ip address. meaning if cluster ip is 10.1.1.1 then node ips will be 10.1.X.X.
- We have provided the provision to give Cluster Ip Address OR HostName in configuration, But HostName provision will work only if the Host Name Resolution works.
- Support for Macro replacement for threshold breach alerts (i.e, customisation for threshold breach alert’s subject, description).
- Component level thresholds can be configured on each resource level.
- No support of showing activity log and applied time.
- Support for the option to get Latest snapshot metric.
- Application is not compatible with Cluster Gateway.
- Powershell execution is not working in arm64 architecture due to which windows-failover-cluster application will not work in arm64 architecture.