| Supported Target Versions |
|---|
| HP-UX hpux1 B.11.31 OS |
Application Version and Upgrade Details
| Application Version | Bug fixes / Enhancements |
|---|---|
| 2.0.1 | Filled the resource name field with hostname. |
| 2.0.0 | Initial Version with discovery and monitoring features. |
Introduction
HP UX is a closed source operating system provided by HP Enterprise. It is a Unix-like operating system based on the Unix System V design. It is primarily designed for HP computers, and its target system is a server. It is one of five commercial operating systems with versions certified to the open group’s UNIX 03 standard. It has a monolithic kernel with dynamically loadable modules and the preferred proprietary license.
Prerequisites
- OpsRamp Classic Gateway 14.0.0 and above.
- OpsRamp Nextgen Gateway 14.0.0 and above.
Note: OpsRamp recommends using the latest Gateway version for full coverage of recent bug fixes, enhancements, etc. - Non-root users should have a home directory and make sure the user has read, write & execute permissions to that directory for log file monitoring.(As part of log file monitoring, the application will copy the .sh script file into the HP-UX server device which is responsible for log file monitoring. This will copy the file into user’s home directory)
- Provided IP Address/Host Name, Credentials should work for SSH communication.
- Users need to add path /usr/sbin against path variables in the .profile file to achieve NETWORK related metrics. Example:
(hpux_server_network_interface_OutTraffic, hpux_server_network_interface_InDiscards, hpux_server_network_interface_OutPackets, hpux_server_network_interface_OutErrors, hpux_server_network_interface_OutDiscards, hpux_server_network_interface_InPackets, hpux_server_network_interface_InErrors, hpux_server_network_interface_Collisions, hpux_server_network_interface_Status, hpux_server_network_interface_InTraffic).cat .profile
# Set up the search paths:
PATH=$PATH:/usr/bin:/usr/sbin:/etc:/usr/local/bin:.- Users should have a tmp folder, the application will use it to store top command output in order to retrieve CPU and memory utilization metrics.
Commands using tmp folder
top -f /tmp/topoutput.txt

cat /tmp/topoutput.txt

rm /tmp/topoutput.txt- Users who want to use log file monitoring must have a home directory on the system where the script will be run.
pwd

[content@centos-node1 ~]$ pwd
/home/content
Application Migration
Check for the gateway version as a prerequisite step - classic gateway-12.0.1 and above.
Notes:- You only have to follow these steps when you want to migrate from sdk 1.0 to sdk 2.0.
- For first time installation below steps are not required.
- Application name should be the same.
- Disable all installed integrations configurations for that application. This is to make sure no discovery and monitoring requests are processed.
- Install and Add the configuration to that sdk 2.0 application.
- During the migration from SDK 1.0 to SDK 2.0, ensure that you uncheck the Bypass Resource Reconciliation checkbox.
Note: refer to Configure and Install the HP UX Server Integration & View the HP UX Server Details sections of this document.
Once all discoveries are completed with the sdk 2.0 applicaion, follow any one of the approaches.
- Direct uninstallation of the sdk1.0 adaptor application through the uninstall API with skipDeleteResources=true in the post request
End-Point: https://{{host}}/api/v2/tenants/{tenantId}/integrations/installed/{installedIntgId}
Request Body:
{
    "uninstallReason": "Test",
    "skipDeleteResources": true
}
(OR)
- Delete the configuration one by one through the Delete adaptor config API with the request parameter as skipDeleteResources=true
End-Point:
https://{{host}}/api/v2/tenants/{tenantId}/integrations/installed/config/{configId}?skipDeleteResources=true.
- Finally, uninstall the adaptor application through API with skipDeleteResources=true in the post request.
End-Point:
https://{{host}}/api/v2/tenants/{tenantId}/integrations/installed/{installedIntgId}
Request Body:
{
    "uninstallReason": "Test",
    "skipDeleteResources": true
}
Supported Metrics
Click here to view the supported metrics
| Native Type | Metric Name | Display Name | Unit | Application Version | Metric Description |
|---|---|---|---|---|---|
| HP UX Server | hpux_server_logFile_AlertStatistics | HP-UX Server Log file alert Statistics | 2.0.0 | HP UX server log file monitoring alert statistics. | |
| hpux_server_openFileDescriptors_Utilization | HP-UX Server open file descriptor utilization | % | 2.0.0 | HP UX open file descriptors used percentage. | |
| hpux_server_openFileDescriptors_UsedCount | HP-UX Server open file descriptor used count | Count | 2.0.0 | Current number of open file descriptors. | |
| hpux_server_loggedInUsers_Pct | HP-UX Server logged in users percentage | % | 2.0.0 | Current number of logged in users percentage. | |
| hpux_server_loggedInUsers_Count | HP-UX Server logged in users count | Count | 2.0.0 | Current number of logged in users. | |
| hpux_server_runningProcesses_Pct | HP-UX Server running processes percentage | % | 2.0.0 | Current running processes percentage. | |
| hpux_server_runningProcesses_Count | HP-UX Server running processes count | Count | 2.0.0 | Current number of running processes. | |
| hpux_server_semaphores_Utilization | HP-UX Server semaphores utilization | % | 2.0.0 | Semaphore ID's used percentage. | |
| hpux_server_semaphores_UsedCount | HP-UX Server semaphores used count | Count | 2.0.0 | Current number of semaphore ID’s in use. | |
| hpux_server_messageQueueIDs_Utilization | HP-UX Server message queue IDs utilization | % | 2.0.0 | Used percentage of current message queue ID's. | |
| hpux_server_messageQueueIDs_UsedCount | HP-UX Server message queue IDs used count | count | 2.0.0 | Current number of message queue ID’s in use. | |
| hpux_server_sharedMemoryIDs_Utilization | HP-UX Server shared memory IDs utilization | % | 2.0.0 | Used percentage of shared memory ID's. | |
| hpux_server_sharedMemoryIDs_UsedCount | HP-UX Server shared memory IDs used count | Count | 2.0.0 | Current number of shared memory ID’s in use. | |
| hpux_server_cpu_total_Utilization | HP-UX Server CPU utilization | % | 2.0.0 | System CPU utilization. | |
| hpux_server_cpu_logicalProcessor_Utilization | HP-UX Server CPU logical processor utilization | % | 2.0.0 | System CPU logical processor utilization. | |
| hpux_server_cpu_Load | HP-UX Server CPU load | 2.0.0 | Average CPU load for 1 min, 5 min, and 15 min. | ||
| hpux_server_realMemory_ScanRate | HP-UX Server real memory scan rate | psec | 2.0.0 | Memory scan rate in pages per second. | |
| hpux_server_realMemory_pageOuts_PagesPerSec | HP-UX Server real memory pageouts pages per sec | psec | 2.0.0 | Memory page out rate in pages per second. | |
| hpux_server_realMemory_pageOuts_KiloBytesPerSec | HP-UX Server real memory pageouts kilobytes per sec | KBps | 2.0.0 | Memory pages page out rate in Kilo Bytes per second. | |
| hpux_server_memory_UsedInMB | HP-UX Server memory used | MB | 2.0.0 | System memory used space. | |
| hpux_server_memory_Utilization | HP-UX Server memory utilization | % | 2.0.0 | System memory utilization. | |
| hpux_server_swapMemory_UsedInKb | HP-UX Server swap memory used | KB | 2.0.0 | Swap memory used. | |
| hpux_server_swapMemory_Utilization | HP-UX Server swap memory utilization | % | 2.0.0 | Swap memory utilization in percent. | |
| hpux_server_individual_swapArea_Utilization | HP-UX Server individual swap area utilization | % | 2.0.0 | Individual swap area utilization in percent. | |
| hpux_server_fileSystem_space_Utilization | HP-UX Server filesystem space utilization | % | 2.0.0 | File system space utilization in percent. | |
| hpux_server_fileSystem_space_UsedInMB | HP-UX Server filesystem space used in MB | MB | 2.0.0 | File system space usage in MB. | |
| hpux_server_fileSystem_space_DeltaInKB | HP-UX Server filesystem space delta in KB | KB | 2.0.0 | File system space usage(KB) delta. | |
| hpux_server_fileSystem_Inodes_Utilization | HP-UX Server filesystem Inodes utilization | % | 2.0.0 | File system Inodes utilization percent. | |
| hpux_server_fileSystem_Inodes_Usage_Number | HP-UX Server filesystem Inodes usage number | Count | 2.0.0 | File system Inodes usage number. | |
| hpux_server_fileSystem_Inodes_Delta | HP-UX Server filesystem Inodes delta | Count | 2.0.0 | File system Inodes usage delta. | |
| hpux_server_fileSystem_mount_ChangeDetection | HP-UX Server filesystem mount change detection | 2.0.0 | File system mount point change detection. It detects if any file system mount point removed and if any new mount point added into the system. Below are the possible values: 0 - Available , 1 - Newly Added , 2 - Removed. | ||
| hpux_server_mountpoint_space_Utilization | HP-UX Server mountpoint space utilization | % | 2.0.0 | Mount point space utilization in percent. | |
| hpux_server_mountpoint_space_UsedInMB | HP-UX Server mountpoint space used in MB | MB | 2.0.0 | Mount point usage in MB. | |
| hpux_server_mountpoint_space_DeltaInKB | HP-UX Server mountpoint space delta in KB | KB | 2.0.0 | Mount point space usage(KB) delta. | |
| hpux_server_mountpoint_Inodes_Utilization | HP-UX Server mountpoint Inodes utilization | % | 2.0.0 | Mount point Inodes utilization percent. | |
| hpux_server_mountpoint_Inodes_Usage_Number | HP-UX Server mountpoint Inodes usage number | Count | 2.0.0 | Mount point Inodes usage number. | |
| hpux_server_mountpoint_Inodes_Delta | HP-UX Server mountpoint Inodes delta | Count | 2.0.0 | Mount point Inodes usage delta. | |
| hpux_server_mountpoint_availability_Status | HP-UX Server mountpoint availability status | 2.0.0 | Availability status of mount point. These are possible values : 0 - Not Available 1 - Available. | ||
| hpux_server_network_interface_OutTraffic | HP-UX Server Network Out Traffic | Kbps | 2.0.0 | Monitors Out traffic of each interface for HP UX devices. | |
| hpux_server_network_interface_InDiscards | HP-UX Server Network In discards | psec | 2.0.0 | Monitors Network in discards of each interface for HP UX devices. | |
| hpux_server_network_interface_OutPackets | HP-UX Server Network out packets | packets/sec | 2.0.0 | Monitors Out packets of each interface for HP UX devices. | |
| hpux_server_network_interface_OutErrors | HP-UX Server Network Out Errors | Count | 2.0.0 | Monitors network out errors of each interface for HP UX devices. | |
| hpux_server_network_interface_OutDiscards | HP-UX Server Network Out discards | psec | 2.0.0 | Monitors network Out Discards of each interface for HP UX devices. | |
| hpux_server_network_interface_InPackets | HP-UX Server Network In packets | packets/sec | 2.0.0 | Monitors in Packets of each interface for HP UX devices. | |
| hpux_server_network_interface_InErrors | HP-UX Server Network In Errors | Count | 2.0.0 | Monitors network in errors of each interface for HP UX devices. | |
| hpux_server_network_interface_Collisions | HP-UX Server Network Interface collisions | Count | 2.0.0 | Monitors network collisions of each interface for HP UX devices. | |
| hpux_server_network_interface_Status | HP-UX Server Network Interface status | 2.0.0 | Monitors status of each interface for HP UX devices. Possible values 0-down, 1-up. | ||
| hpux_server_network_interface_InTraffic | HP-UX Server Network In Traffic | Kbps | 2.0.0 | Monitors In traffic of each interface for HP UX devices. | |
| hpux_server_process_RunningStatus | HP-UX Server process running status | 2.0.0 | Monitors status of each user mentioned process. possible values 0-Not Running, 1- Running. |
Default Monitoring Configurations
HP UX Server has default Global Device Management Policies, Global Templates, Global Monitors and Global metrics in OpsRamp. Users can customize these default monitoring configurations as per their business use cases by cloning respective global templates and global Device Management Policies. OpsRamp recommends doing this activity before installing the app to avoid noise alerts and data.
Default Global Device Management Policies
OpsRamp has a Global Device Management Policy for each Native Type of HP UX Server. You can find those Device Management Policies at Setup > Resources > Device Management Policies, search with suggested names in global scope. Each Device Management Policy follows below naming convention:
{appName nativeType - version}Ex: hp-ux-server HP UX Server - 2 (i.e, appName = hp-ux-server, nativeType = HP UX Server, version = 2)
Default Global Templates
OpsRamp has a Global template for each Native Type of HP UX Server. You can find those templates at Setup > Monitoring > Templates, search with suggested names in global scope. Each template follows below naming convention:
{appName nativeType 'Template' - version}Ex : hp-ux-server HP UX Server Template - 2 (i.e, appName = hp-ux-server, nativeType = HP UX Server, version = 2)
Default Global Monitors
OpsRamp has a Global Monitors for each Native Type which has monitoring support. We can find those monitors at Setup > Monitoring > Monitors, search with suggested names in global scope. Each Monitors follows below naming convention:
{monitorKey appName nativeType - version}Ex: HP UX Server Monitor hp-ux-server HP UX Server 2(i.e, monitorKey = HP UX Server Monitor, appName = hp-ux-server, nativeType = HP UX Server, version = 2)
Configure and Install the HP UX Server Integration
- From All Clients, select a client.
- Go to Setup > Account.
- Select the Integrations and Apps tab.
- The Installed Integrations page, where all the installed applications are displayed. If there are no installed applications, it will navigate to the Available Integrations and Apps page.
- Click + ADD on the Installed Integrations page. The Available Integrations and Apps page displays all the available applications along with the newly created application with the version.
- Search for the application using the search option available. Alternatively, use the All Categories option to search.
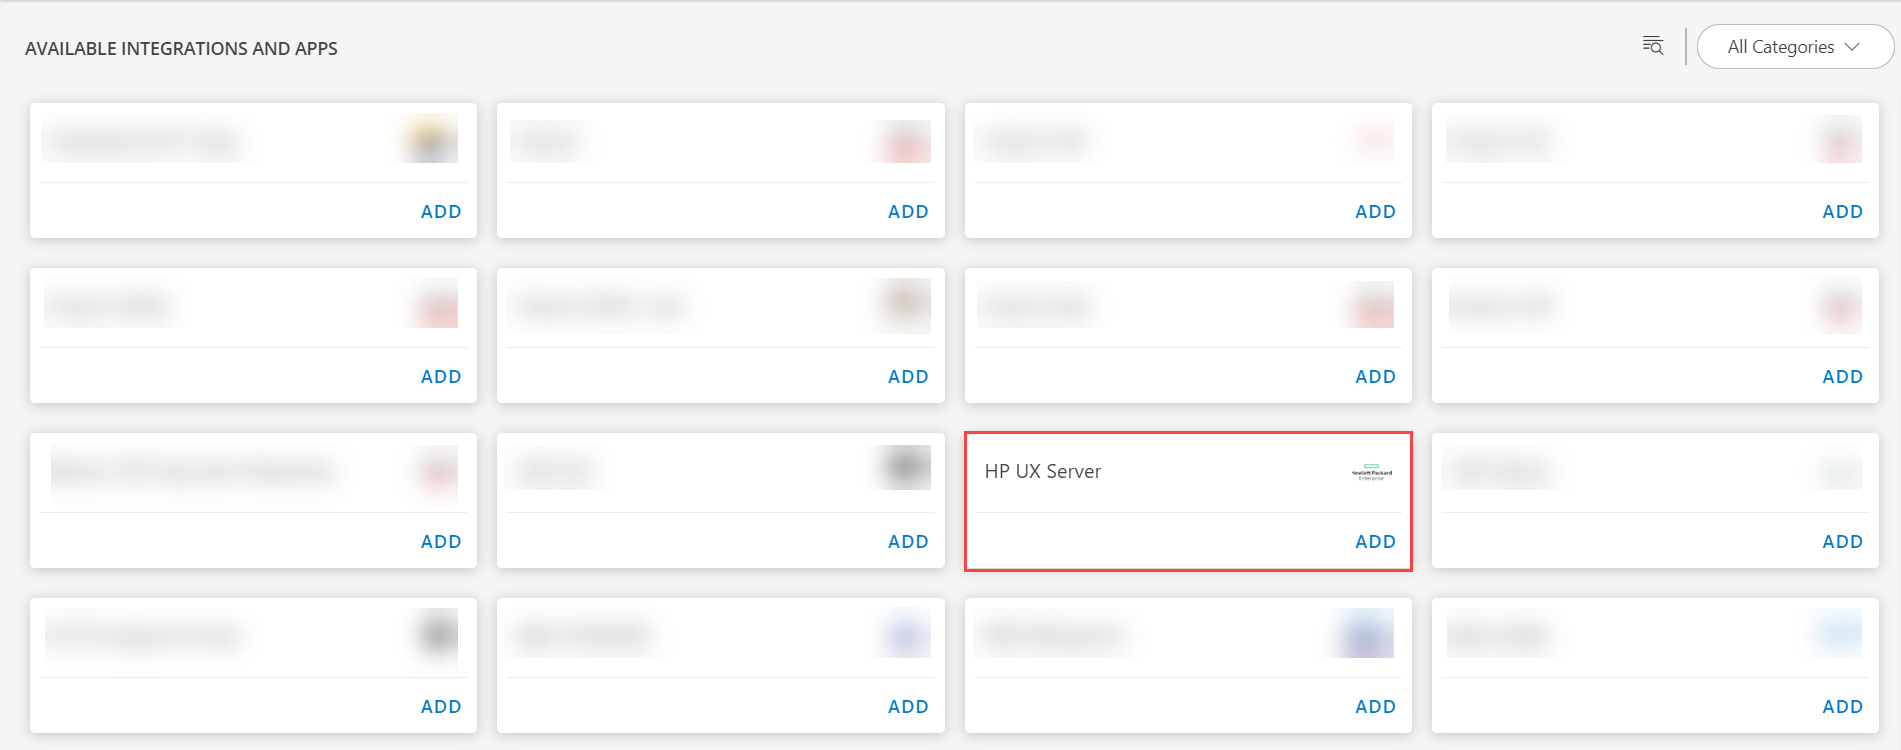
- Click ADD in the HP UX Server tile.
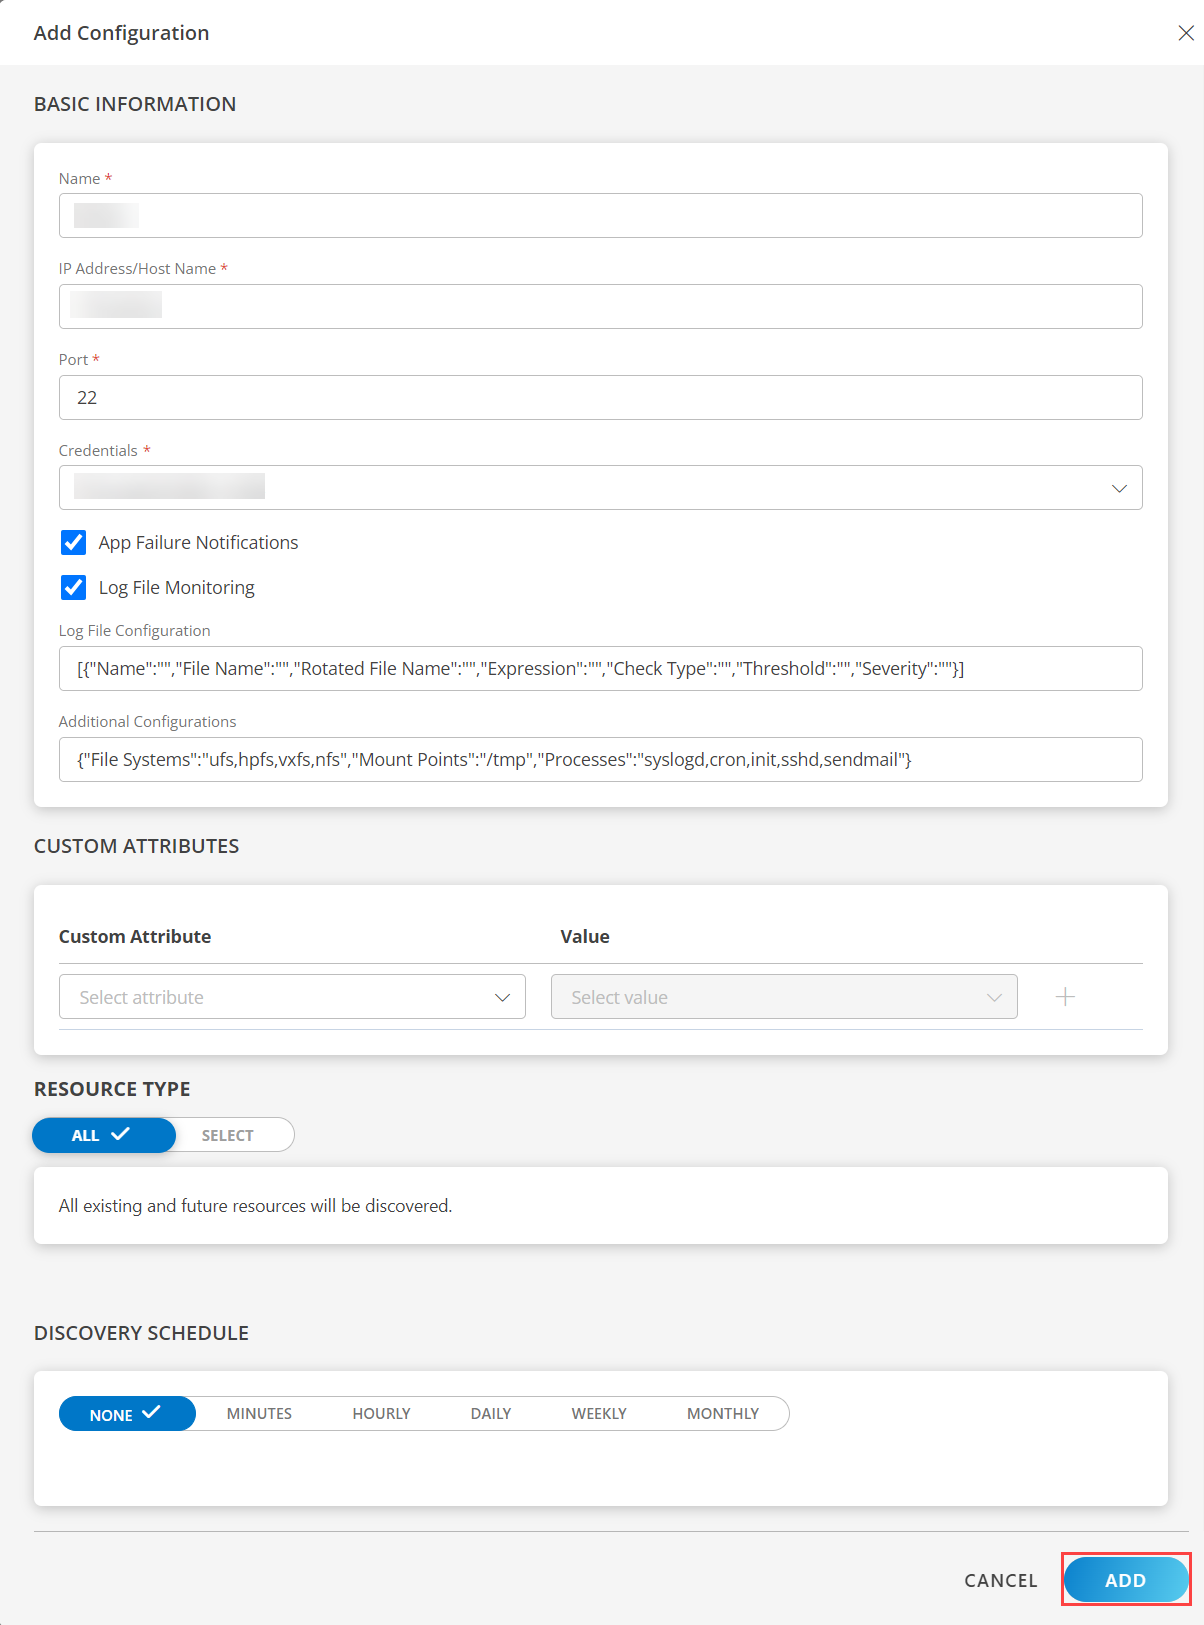
- From the Configurations page, click + ADD.
- Enter the below mentioned BASIC INFORMATION:
| Functionality | Description |
|---|---|
| Name | Enter the name for the configuration. |
| IP Address/ Host Name | IP address/host name of the HP UX Server. |
| Port | Port Note: By default 22 is the port value. |
| Credential | Select the Credential from the drop-down list. Notes:
|
| Additional Configuration | Enter the additional configuration. Note: By default {"File Systems":"ufs,hpfs,vxfs,nfs","Mount Points":"/tmp","Processes":"syslogd,cron,init,sshd,sendmail"} is added. |
Notes:
- Select the following:
- App Failure Notifications: if turned on, you will be notified in case of an application failure that is, Connectivity Exception, Authentication Exception.
- Log File Monitoring: The Log File Configuration is part of the additional configuration, configure the values for below fields as per your log file monitoring use case:
- Log File Configuration: {“Name”:"",“File Name”:"",“Rotated File Name”:"",“Expression”:"",“Check Type”:"",“Threshold”:"",“Severity”:""}
- Ip Address/Host Name and Port should be accessible from Gateway.
- Select the below mentioned Custom Attribute:
| Functionality | Description |
|---|---|
| Custom Attribute | Select the custom attribute from the drop down list box. |
| Value | Select the value from the drop down list box. |
Note: The custom attribute that you add here will be assigned to all the resources that are created by the integration. You can add a maximum of five custom attributes (key and value pair).
In the RESOURCE TYPE section, select:
- ALL: All the existing and future resources will be discovered.
- SELECT: You can select one or multiple resources to be discovered.
In the DISCOVERY SCHEDULE section, select Recurrence Pattern to add one of the following patterns:
- Minutes
- Hourly
- Daily
- Weekly
- Monthly
Click ADD.
Now the configuration is saved and displayed on the configurations page after you save it.
Note: From the same page, you may Edit and Remove the created configuration.
Under the ADVANCED SETTINGS, Select the Bypass Resource Reconciliation option, if you wish to bypass resource reconciliation when encountering the same resources discovered by multiple applications.
Note: If two different applications provide identical discovery attributes, two separate resources will be generated with those respective attributes from the individual discoveries.
Click NEXT.
(Optional) Click +ADD to create a new collector by providing a name or use the pre-populated name.
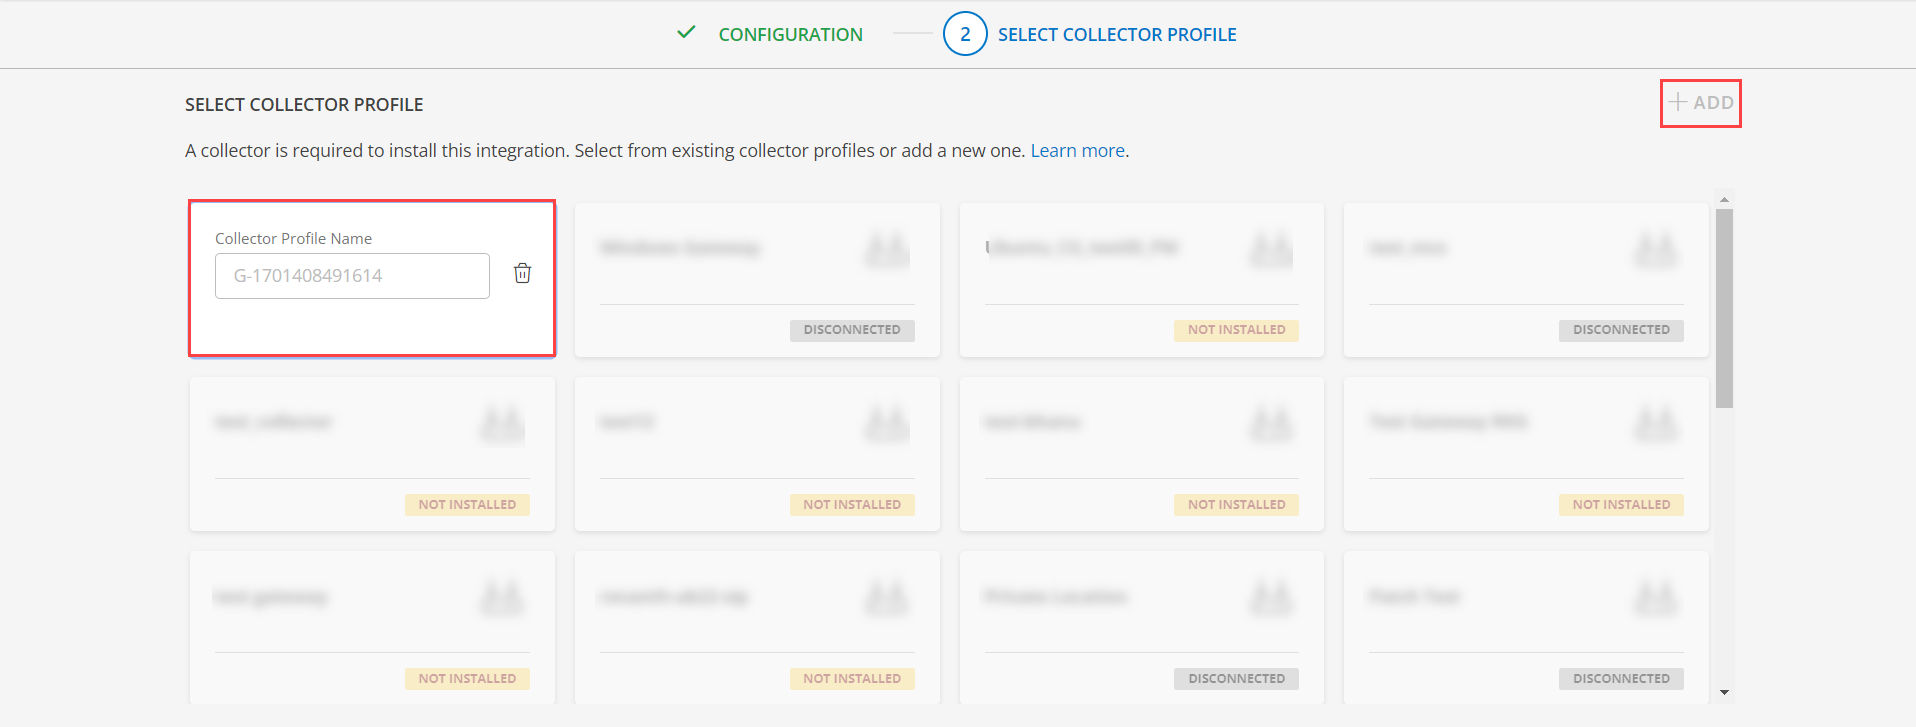
- Select an existing registered profile.
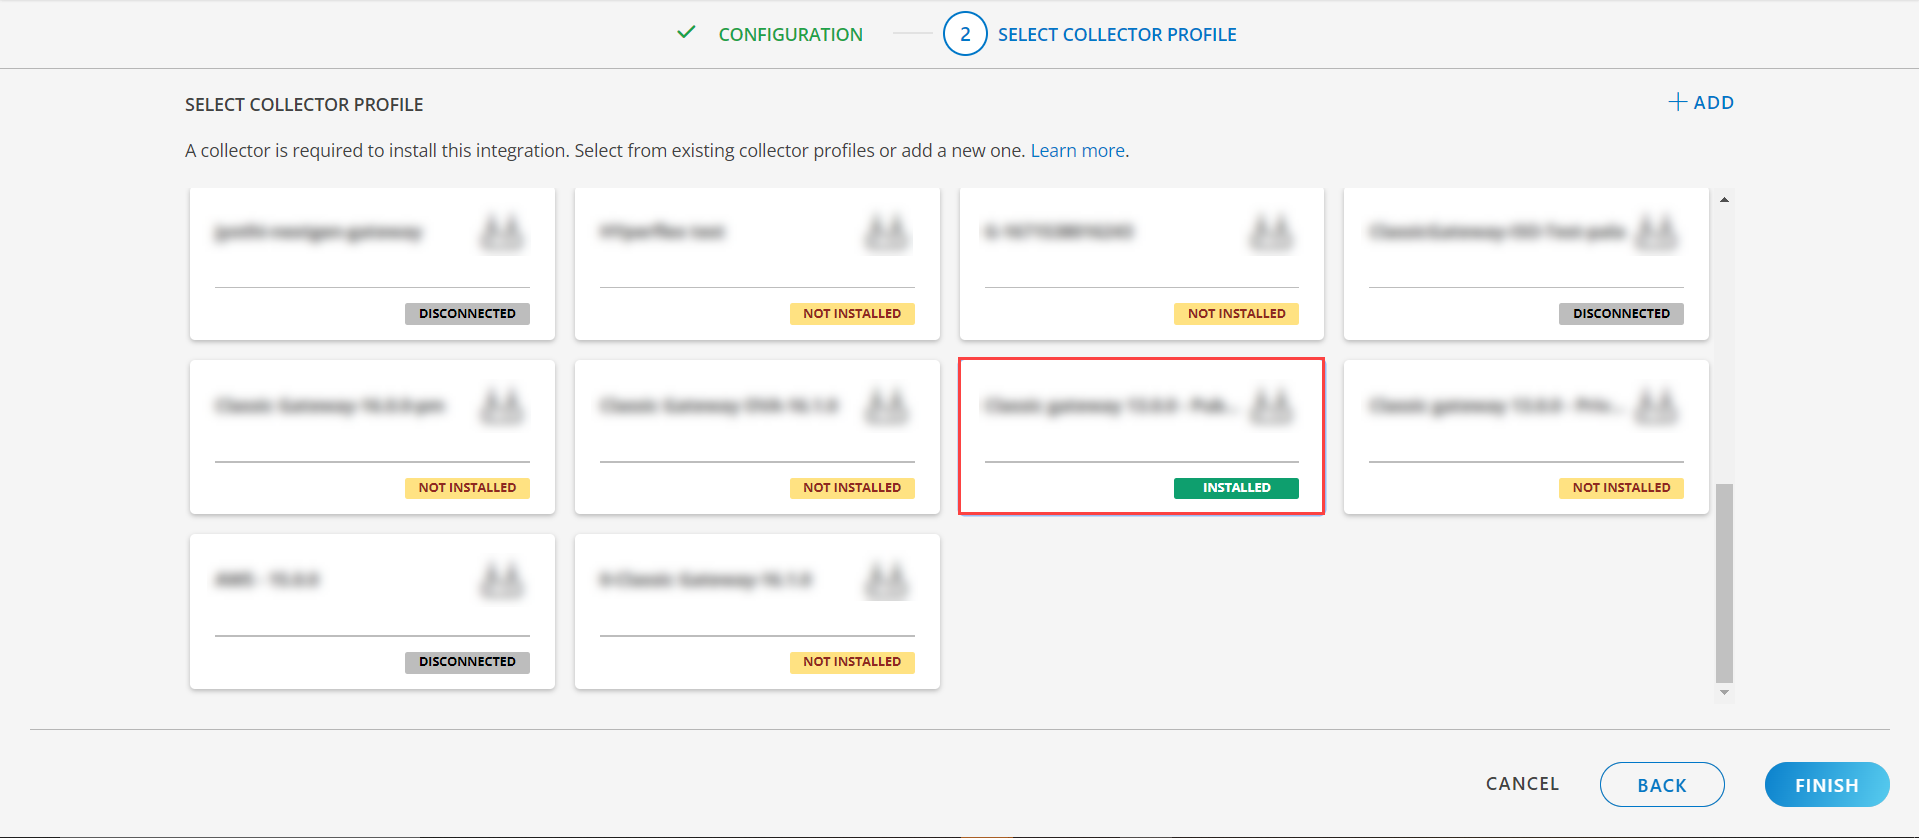
- Click FINISH.
The application is installed and displayed on the INSTALLED INTEGRATION page. Use the search field to find the installed integration.
Modify the Configuration
See Modify an Installed Integration or Application article.
Note: Select the HP UX Server application.
View the HP UX Details
Navigate to Infrastructure > Resources > Server, with Native Resource Type as HP UX Server. You can go to the Attributes tab to view the discovery details and click the Metrics tab to view the metric details for HP UX Server.

View resource attributes
The discovered resource(s) are displayed under Attributes. In this page you will get the basic information about the resources such as: Resource Type, Native Resource Type, Resource Name, IP Address etc.
View resource metrics
To confirm HP-UX Server monitoring, review the following:
- Metric graphs: A graph is plotted for each metric that is enabled in the configuration.
- Alerts: Alerts are generated for metrics that are configured as defined for integration.
Resource Filter Input Keys
HP UX Server application Resources are filtered and discovered based on below keys:
Note: You can filter the resources with the discoverable keys only.
Click here to view the Supported Input Keys
| Resource Type | Resource Type |
|---|---|
| All Types | resourceName |
| hostName | |
| aliasName | |
| dnsName | |
| ipAddress | |
| macAddress | |
| os | |
| make | |
| model | |
| serialNumber |
Supported Alert Custom Macros
Customize the alert subject and description with below macros then it will generate alerts based on customization.
Supported macros keys:
Click here to view the alert subject and description with macros
${resource.name}
${resource.ip}
${resource.mac}
${resource.aliasname}
${resource.os}
${resource.type}
${resource.dnsname}
${resource.alternateip}
${resource.make}
${resource.model}
${resource.serialnumber}
${resource.systemId}
${Custome Attributes in the resource}
${parent.resource.name}
Risks, Limitations & Assumptions
- Application can handle Critical/Recovery failure notifications for below two cases when user enables App Failure Notifications in configuration:
- Connectivity Exception
- Authentication Exception
- Application uses the provided IpAddress/hostname, Credentials for SSH communications.
- Application will send duplicate/repeat failure alert notification for every 6 hours.
- Application cannot control monitoring pause/resume actions based on above alerts
- Metrics can be used to monitor HP UX Server resources and can generate alerts based on the threshold values.
- OpsRamp has provided 22 as default SSH Port value for connecting to HP UX end devices via SSH. Users can modify this value from the application configuration page at any point of time if required.
- No support of showing activity log and applied time.
- Full discovery support requires gateway version 15.0.0 or above.
- This application supports both Classic Gateway and NextGen Gateway.
- Currently we do not have monitoring support for below things
- Hardware metrics
- Programmable Resource Monitoring
- Processes (We provided one metric for each process RunningStatus. i.e, hpux_server_process_RunningStatus)
- For log monitoring, we expect the below json payload as input.
- “Name” can be any string used to identify individual log configuration.
- “File Name” is a combination of folder path and file name. Folder path should contain the exact path for the file as prefix. File name can be any valid string or regular expression.. In case of file not found with specified file name, alert will be generated with the severity specified by the user.
Example 1:C:\Program Files (x86)\Vistara\Agent\log\Age.?t.log
Matches:Agent.log, Ageat.log ,.. - “Rotated File Name” is similar to filename field but specifying the rotated file. This field is optional.
- “Expression” can be any valid string or regular expression used to specify the search string. It’s a mandatory field.
- “Check Type” can be either “exists” or “not exists”(case insensitive).
- “Threshold” can be any valid integer. Alert will be generated in case a specified threshold breach happens.
- “Severity” used to specify the alert type to be created in case of expression found. Possible values are CRITICAL,WARNING,INFO and OK (case insensitive).
Log File configuration
[
  {
  "Name":"",
  "File Name":"",
  "Rotated File Name":"",
  "Expression":"",
  "Check Type":"",
  "Threshold":"",
  "Severity":""
  }
]- We do not process logs of size greater than 1GB.
- We do not process logs for the first request, since it leads to performance issues due to huge data. We will consider the latest logs ( logs generated between first and second polls) from the second request and process accordingly.
- No recovery alerts are generated for expression related alerts. We will get recovery only for file not found alerts.