Supported Target Version
| Supported Versions |
|---|
Validated the application against the PostgreSQL Cluster with below specifications:
|
Application Version and Upgrade Details
| Application Version | Bug fixes / Enhancements |
|---|---|
| 1.0.0 | Initial support for PostgreSQL Cluster application. |
Introduction
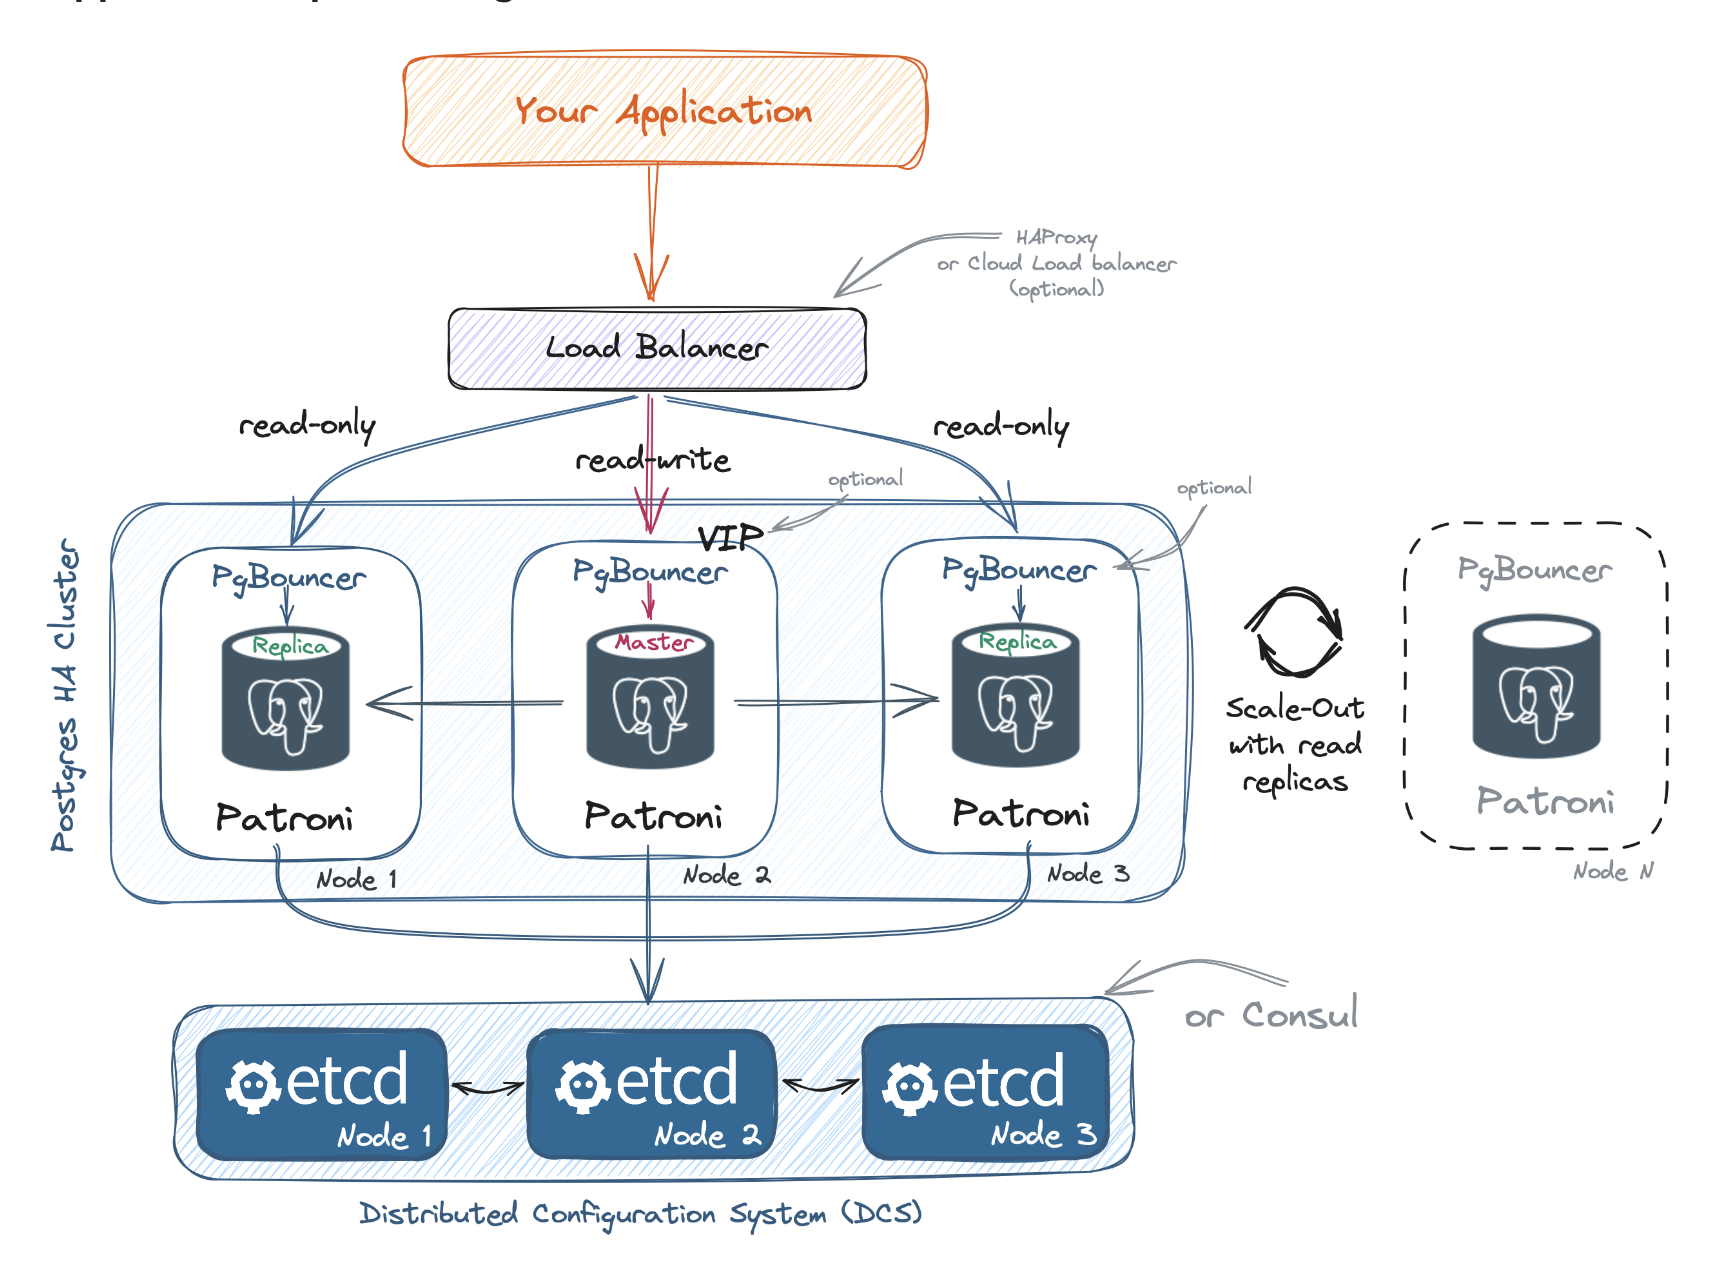
A PostgreSQL Cluster is a high-availability, fault-tolerant setup with interconnected nodes providing data redundancy and continuous operation.
It automatically fails over to a standby node during a failure, minimizing downtime. This enhances reliability, scalability, and performance, making it ideal for mission-critical applications.
PostgreSQL clusters also support load balancing and data distribution, efficiently handling large data volumes and concurrent requests in enterprise applications like e-commerce and financial systems.
Key Benefits
- Device discovery provides a unified view of all elements in a Linux cluster and their relationships.
- Device monitoring tracks metrics over time and sends alerts to the customer team for immediate action if thresholds are breached or unexpected behavior occurs, ensuring smooth business operations with minimal or zero downtime during infrastructure issues.
Prerequisites
- OpsRamp Classic Gateway (Linux) 15.0.0 or above.
- OpsRamp NextGen Gateway 15.0.0 or above.
Note: OpsRamp recommends using the latest Gateway version for full coverage of recent bug fixes, enhancements, etc.
Hierarchy of PostgreSQL Cluster resource
• PostgreSql Cluster
• PostgreSql Node
Supported Metrics
The following tabs represent the Native Type of PostgreSQL Cluster
| Metric Name | Display Name | Metric Category | Unit | Application Version | Description |
|---|---|---|---|---|---|
| postgresql_node_statiotables_Idx_Blks_Hit | Postgresql Statio Tables Idx Blks Hit | Performance | count | 1.0.0 | Number of buffer hits in all indexes on this table |
| postgresql_node_database_Temp_Bytes | Postgresql Database Temporary Bytes | Usage | 1.0.0 | Total amount of data written to temporary files by queries in this database. All temporary files are counted, regardless of why the temporary file was created, and regardless of the log_temp_files setting. | |
| postgresql_node_bgwriter_Checkpoints_Reqest | Postgresql Bgwriter Checkpoints Request | Performance | 1.0.0 | Number of requested checkpoints that have been performed | |
| postgresql_node_database_Size | Postgresql Database Size | Capacity | Giga Bytes (GB) | 1.0.0 | The size of the database |
| postgresql_node_stat_tables_Seq_Tup_Read | Postgresql Tables Row Sequential Scan | Performance | 1.0.0 | Number of live rows fetched by sequential scans | |
| postgresql_node_statiotables_Toast_Blks_Hit | Postgresql Statio Tables Toast Blks Hit | Performance | 1.0.0 | Number of buffer hits in this table's TOAST table (if any) | |
| postgresql_node_max_Connections | Postgresql Max Connections | Usage | 1.0.0 | The maximum number of client connections allowed to this database.shown as connection | |
| postgresql_node_statio_tables_Buffer_Hits | Postgresql Statio Tables Buffer Hits | Performance | 1.0.0 | Number of buffer hits in this table | |
| postgresql_node_database_Rows_Deleted | Postgresql Database Rows Deleted | Usage | 1.0.0 | Number of rows deleted by queries in this database | |
| postgresql_node_user_Table_Count | User Table Count | Usage | 1.0.0 | It monitors the number of user tables in current database. | |
| postgresql_node_Activity_Count | Postgresql Activity Count | Usage | 1.0.0 | This will tell you how close you are to hitting your max_connections limit, and show up any clients which are leaking database connections. | |
| postgresql_node_database_Conflict_Deadlocks | Postgresql Database Conflict Deadlocks | Performance | count | 1.0.0 | Number of conflicts in this database that have been canceled due to deadlocks |
| postgresql_node_Locks_Granted | Postgresql Locks Granted | Usage | 1.0.0 | True if lock is held, false if lock is awaite | |
| postgresql_node_statio_tables_Index_Buffer_Hit | Postgresql Statio Tables Index Buffer Hits | Performance | Hits per sec (hps) | 1.0.0 | Number of buffer hits in all indexes on this table |
| postgresql_node_database_Blks_Hit | Postgresql Database Blocks Hits | Performance | 1.0.0 | Number of times disk blocks were found already in the buffer cache, so that a read was not necessary (this only includes hits in the PostgreSQL buffer cache, not the operating system's file system cache) | |
| postgresql_node_database_Rows_Updated | Postgresql Database Rows Updated | Usage | 1.0.0 | Number of rows updated by queries in this database | |
| postgresql_node_database_Rows_Inserted | Postgresql Database Rows Inserted | Usage | 1.0.0 | Number of rows inserted by queries in this database | |
| postgresql_node_Class_Relpages | Postgresql Class Relpages | count | 1.0.0 | This query is used to display the tables and their respective indexes in descending order of relpages. | |
| postgresql_node_Locks_Count | Postgresql Locks Count | Capacity | 1.0.0 | The number of connections blocked waiting for a lock can be an indicator of a slow transaction with an exclusive lock. | |
| postgresql_node_Statioindexes_Bufferhits | Postgresql Statio Indexes Buffer Hits | Performance | 1.0.0 | Number of buffer hits in this index | |
| postgresql_node_bgwriter_Buffers_Backend | Postgresql Bgwriter Buffers Backend | 1.0.0 | Number of buffers written directly by a backend | ||
| postgresql_node_database_Deadlocks | Postgresql Database Deadlocks | Performance | count | 1.0.0 | Number of deadlocks detected in this database |
| postgresql_node_statio_tables_Index_Block_Read | Postgresql Statio Tables Index Block Read | Performance | 1.0.0 | Number of disk blocks read from all indexes on this table | |
| postgresql_node_database_Connections | Postgresql Database Connections | Usage | 1.0.0 | The number of active connections to postgres database. | |
| postgresql_node_settings_Connection | Postgresql Settings Connections | 1.0.0 | The number of connections to this database as a fraction of the maximum number of allowed connections. | ||
| postgresql_node_bgwriter_Buffers_Clean | Postgresql Bgwriter Buffers Clean | 1.0.0 | Number of buffers written by the background writer | ||
| postgresql_node_bgwriter_Checkpoints_Timed | Postgresql Bgwriter Checkpoints Timed | count | 1.0.0 | Number of scheduled checkpoints that have been performed | |
| postgresql_node_bgwriter_Buffers_Checkpoint | Postgresql Bgwriter Buffers Checkpoint | 1.0.0 | Number of buffers written during checkpoints | ||
| postgresql_node_database_Rows_Returned | Postgresql Database Rows Returned | 1.0.0 | Number of rows returned by queries in this database | ||
| postgresql_node_database_Rows_Fetched | Postgresql Database Rows Fetched | 1.0.0 | Number of rows fetched by queries in this database | ||
| postgresql_node_user_tables_Rows_Count | Postgresql User Tables Rows Count | count | 1.0.0 | number of rows scans | |
| postgresql_node_usertable_Rowsdead | Postgresql User Table Rows Dead | 1.0.0 | This query gives the number of dead rows (tuples) in the table. | ||
| postgresql_node_database_Transaction_Rollback | Postgresql Database Transactions RolledBack | 1.0.0 | Number of transactions in this database that have been rolled back | ||
| postgresql_node_database_IsInstanceStandby | Postgres Database Is Instance Standby | Availability | 1.0.0 | Check if Postgres database instance is standby or not 0 - Not Standby , 1 - Standby | |
| postgresql_node_hot_Standby_Feature_Status | PostgreSQL Hot Standby Feature Status | Availability | 1.0.0 | Show the Hot Standby mode is either on or off. 1 means "on" & 0 means "off" | |
| postgresql_node_activity_Long_Transactions | PostgreSQL Activity Long Transactions | Performance | Hours | 1.0.0 | Monitors PostgreSQL activity long transactions in hours |
| postgresql_node_database_Walsegment_Count | Postgres Database Walsegment Count | count | 1.0.0 | Postgres WAL segment count - compared to defined thresholds | |
| postgresql_node_database_Backend_Connections_Percentage | Postgres Database Backend Connections Percentage | Usage | % | 1.0.0 | Postgres backend connections - percent relative to max_connections database setting |
| postgresql_node_database_Transaction_Wraparound | Postgres Database Transaction Wraparound | Performance | 1.0.0 | Postgres value of txn_wraparound - compared to defined thresholds | |
| postgresql_node_database_Total_Backend_Connections_Percentage | Postgres Total Backend Connections Percentage | Usage | % | 1.0.0 | Postgres total backend connections - percent relative to max_connections database setting |
| postgresql_node_database_Wal_Sender_State | Postgres Database Wal Sender State | Availability | 1.0.0 | Postgres database current Wal Sender state – Possible States : startup - 1 catchup - 2 streaming - 3 backup - 4 stopping - 5 | |
| postgresql_node_database_Replication_Sendlag_Bytes | Postgres Database Replication Sending Lag In Bytes | Performance | Bytes | 1.0.0 | Postgres database replication – replication sending lag - bytes |
| postgresql_node_database_Replication_Lag_Sec | Postgres Database Replication Lag In Seconds | Performance | Sec | 1.0.0 | Postgres database replication – replication lag - seconds |
| postgresql_node_database_Replication_Replaylag_Bytes | Postgres Database Replication Replay Lag In Bytes | Performance | Bytes | 1.0.0 | Postgres database replication – replication replay lag - bytes |
| postgresql_node_database_Replication_Totallag_Bytes | Postgres Database Replication Total Lag In Bytes | Performance | Bytes | 1.0.0 | Postgres database replication – replication total lag - bytes |
| postgresql_node_database_Replication_Receivelag_Bytes | Postgres Database Replication Receiving Lag In Bytes | Performance | Bytes | 1.0.0 | Postgres database replication – replication receiving lag - bytes |
Default Monitoring Configurations
Postgresql application has default Global Device Management Policies, Global Templates, Global Monitors and Global Metrics in OpsRamp. You can customize these default monitoring configurations as per your business requirement by cloning respective Global Templates and Global Device Management Policies. It is recommended to clone them before installing the application to avoid noise alerts and data.
Default Global Device Management Policies
You can find the Device Management Policy for each Native Type at Setup > Resources > Device Management Policies. Search with suggested names in global scope:
{appName nativeType - version}Ex: postgresql-cluster PostgreSql Node - 1 (i.e, appName = postgresql-cluster, nativeType = PostgreSql Node, version = 1)
Default Global Templates
You can find the Global Templates for each Native Type at Setup > Monitoring > Templates. Search with suggested names in global scope. Each template adheres to the following naming convention:
{appName nativeType 'Template' - version}Ex: postgresql-cluster PostgreSql Node Template - 1 (i.e, appName = postgresql-cluster, nativeType = PostgreSql Node, version = 1)
Default Global Monitors
You can find the Global Monitors for each Native Type at Setup > Monitoring > Monitors. Search with suggested names in global scope. Each Monitors adheres to the following naming convention:
{monitorKey appName nativeType - version}Ex: PostgreSql Node Monitor postgresql-cluster PostgreSql Node 1 (i.e, monitorKey = PostgreSql Node Monitor, appName = postgresql-cluster, nativeType = PostgreSql Node, version = 1)
Configure and Install the PostgreSQL Cluster Integration
- To select your client, navigate to All Clients, and click the Client/Partner dropdown menu.
Note: You may either type your client’s name in the search bar or select your client from the list. - Navigate to Setup > Account. The Account Details screen is displayed.
- Click Integrations. The Installed Integrations screen is displayed with all the installed applications.
Note: If you do not have any installed applications, you will be navigated to the Available Integrations and Apps page with all the available applications along with the newly created application with the version. - Click + ADD on the Installed Integrations page.
Note: Search for the integration either by entering the name of the integration in the search bar or by selecting the category of the integration from the All Categories dropdown list. - Click ADD in the PostgreSQL Cluster application.
- In the Configuration screen, click + ADD. The Add Configuration screen appears.
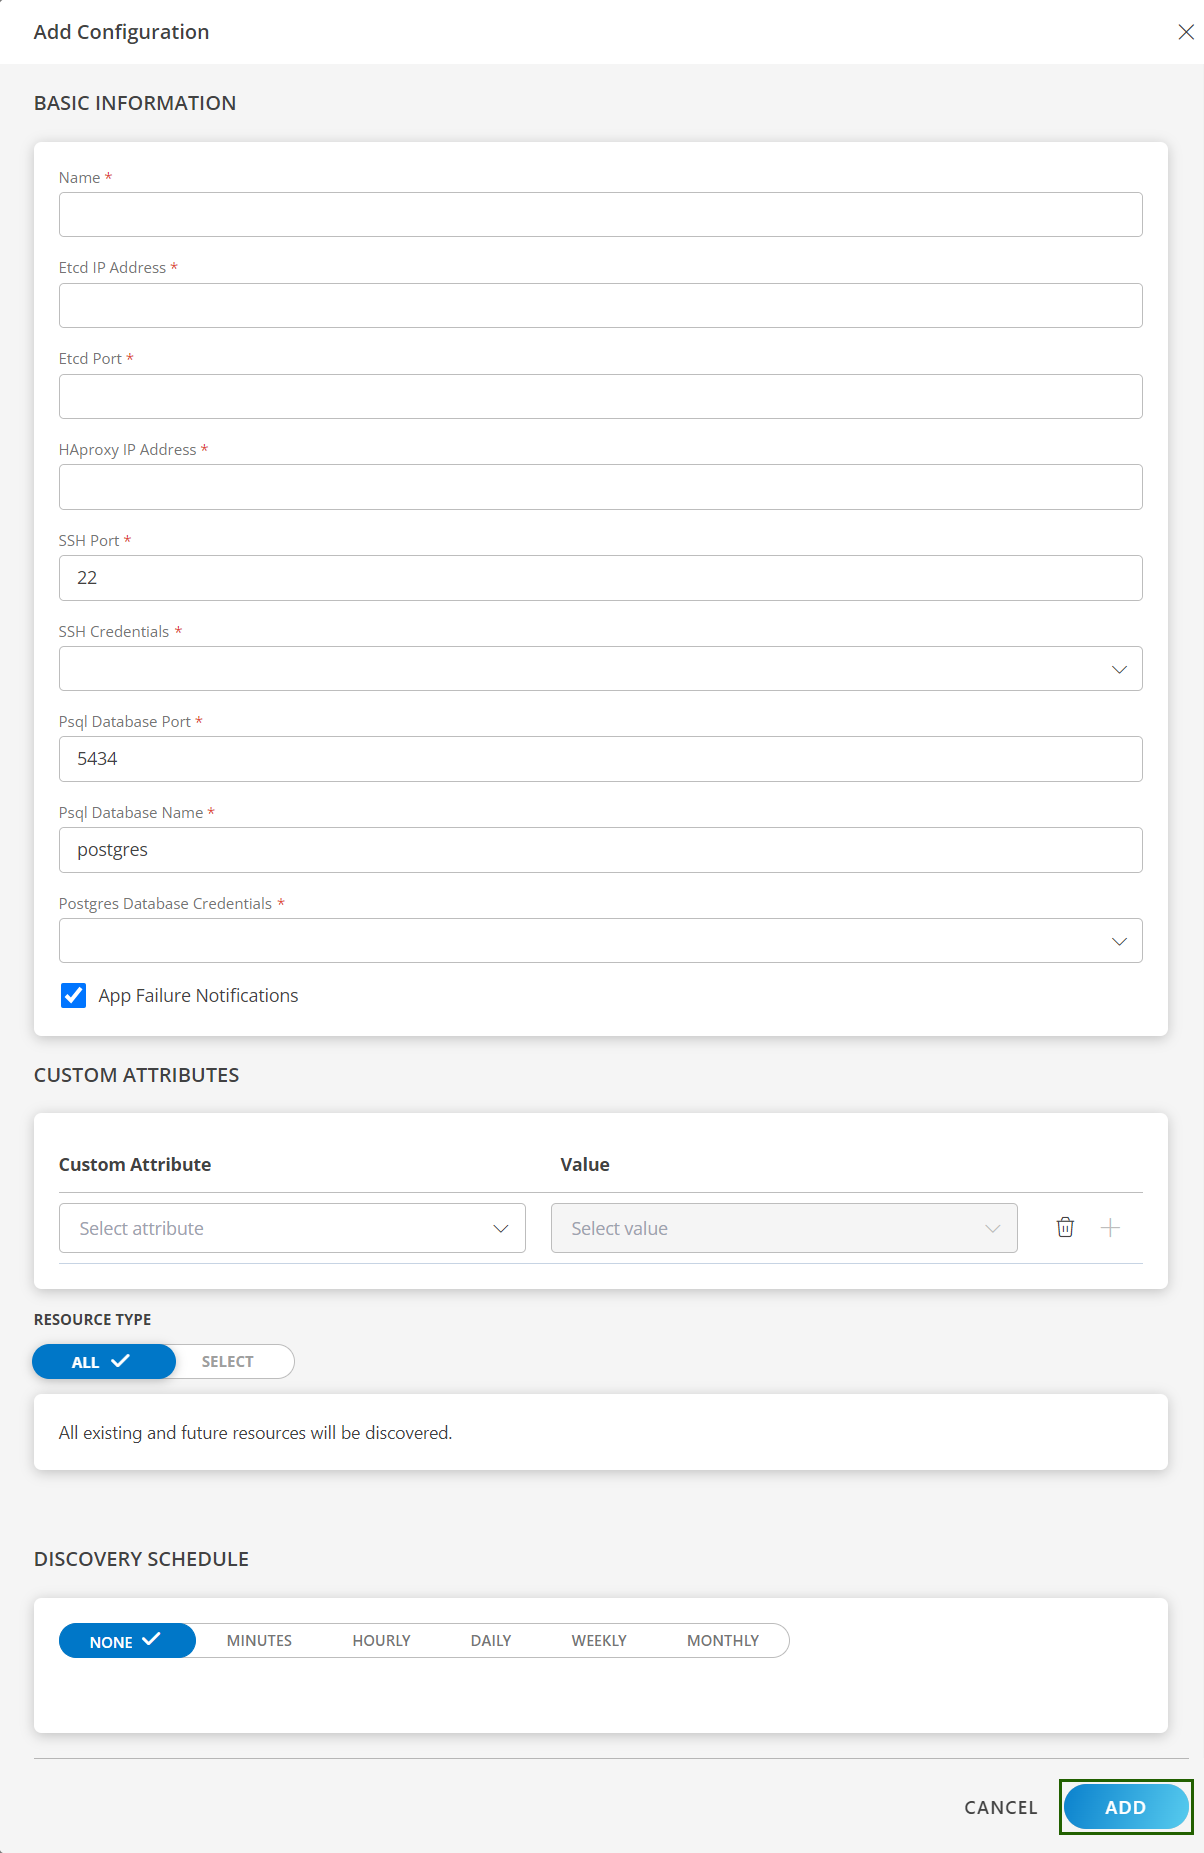
- Enter the following BASIC INFORMATION:
| Field Name | Description | Field Type |
|---|---|---|
| Name | Enter the name for the configuration. | String |
| Etcd IP Address | Enter the Etcd IP address of the PostgreSQL Cluster. It should be accessible from Gateway. | String |
| Etcd Port | Enter the port number to communicate with OpsRamp's endpoints. It should be accessible from Gateway. | Integer |
| HAproxy IP Address | Enter the HAproxy IP address of the PostgreSQL Cluster. It should be accessible from Gateway. | String |
| SSH Port | SSH Port Note: By default 22 as a SSH port value. | Integer |
| SSH Credential | Select the credential associated with your PostgreSQL Cluster account. If you want to use the existing credentials, select them from the Select Credentials dropdown. Else, click + Add to create credentials. The ADD CREDENTIAL window is displayed. Enter the following information.
| Dropdown |
| Psql Database Port | Psql Database Port Example: By default 5434 is the default psql database port value. | Integer |
| Psql Database Name | Psql Database Name Example: By default postgres is the name. | Integer |
| Postgres Database Credential | Select the credential associated with your PostgreSQL Cluster account. If you want to use the existing credentials, select them from the Select Credentials dropdown. Else, click + Add to create credentials. The ADD CREDENTIAL window is displayed. Enter the following information.
| Dropdown |
| App Failure Notifications | When selected, you will be notified in case of an application failure such as Connectivity Exception, Authentication Exception. | Checkbox |
- CUSTOM ATTRIBUTES: Custom attributes are the user-defined data fields or properties that can be added to the preexisting attributes to configure the integration.
| Field Name | Description | Field Type |
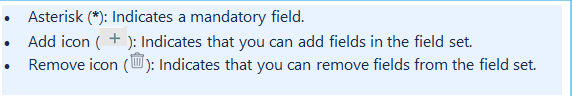
|---|---|---|
| Custom Attribute | Select the custom attribute from the dropdown. You can add attributes by clicking the Add icon (+). | Dropdown |
| Value | Select the value from the dropdown. | Dropdown |
Note: The custom attribute that you add here will be assigned to all the resources that are created by the integration. You can add a maximum of five custom attributes (key and value pair).
- In the RESOURCE TYPE section, select:
- ALL: All the existing and future resources will be discovered.
- SELECT: You can select one or multiple resources to be discovered.
- In the DISCOVERY SCHEDULE section, select recurrence pattern to add one of the following patterns:
- Minutes
- Hourly
- Daily
- Weekly
- Monthly
- Click ADD.
Now the configuration is saved and displayed on the configurations page after you save it.Note: From the same page, you may Edit and Remove the created configuration.
12. Under the ADVANCED SETTINGS, Select the Bypass Resource Reconciliation option, if you wish to bypass resource reconciliation when encountering the same resources discovered by multiple applications.
Note: If two different applications provide identical discovery attributes, two separate resources will be generated with those respective attributes from the individual discoveries.
13. Click NEXT.
14. (Optional) Click +ADD to create a new collector. You can either use the pre-populated name or give the name to your collector.
15. Select an existing registered profile.
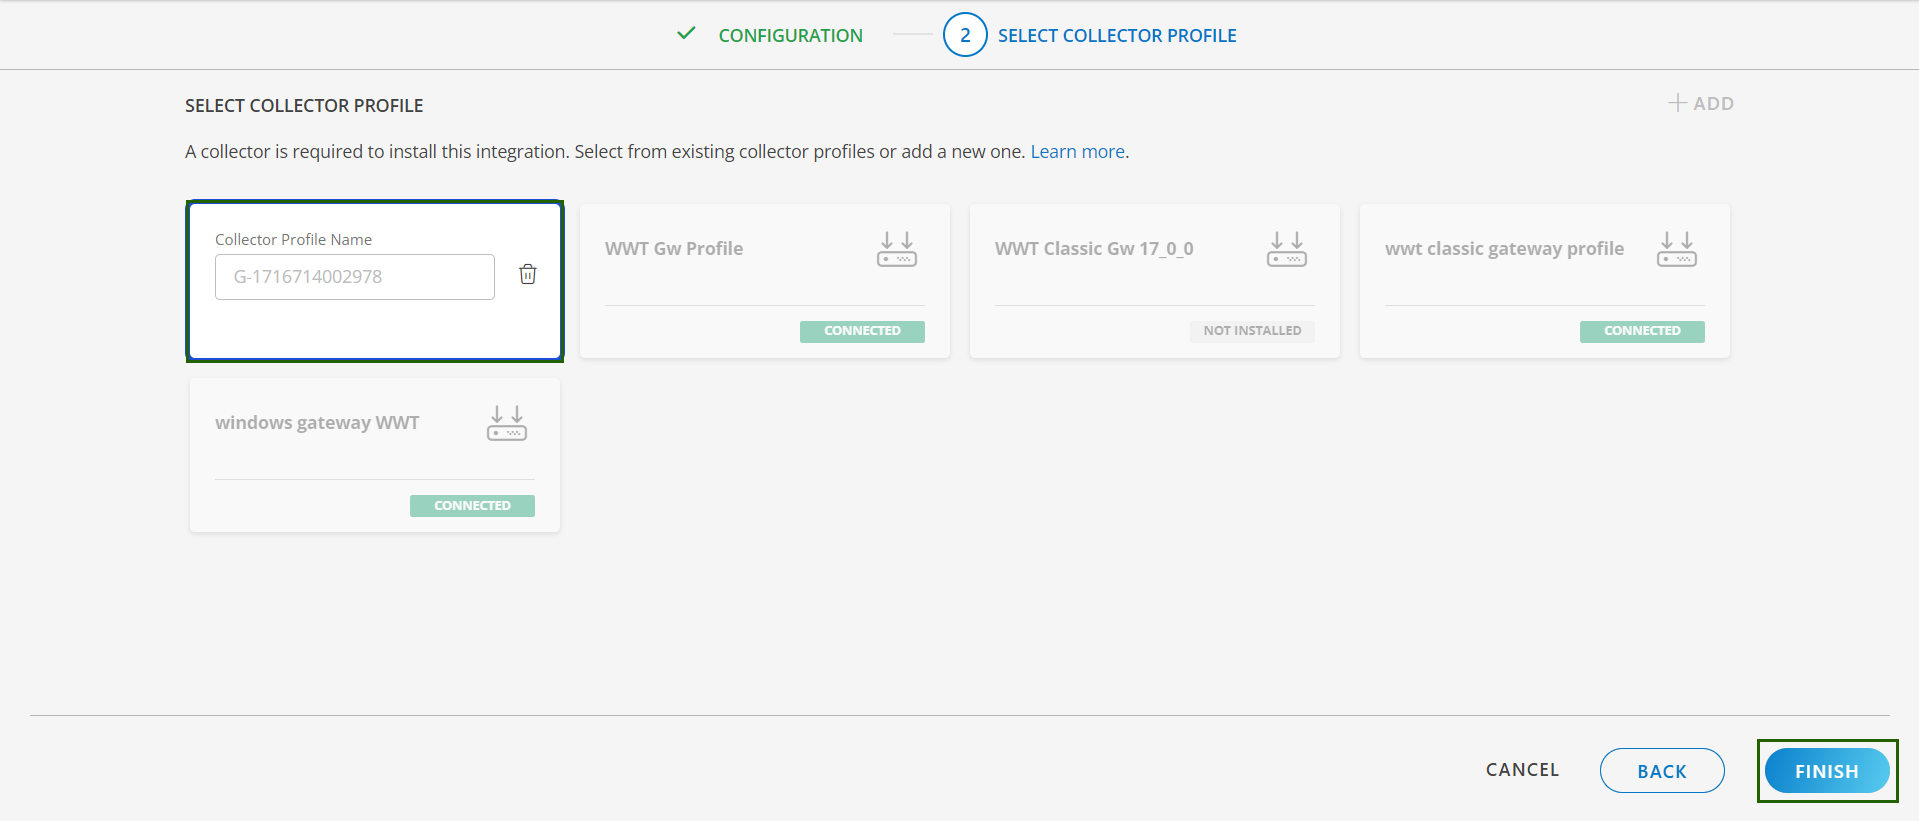
- Click FINISH.
The integration is installed and displayed on the INSTALLED INTEGRATION page. Use the search field to find the installed integration.
Modify PostgreSQL Cluster Integration
See Modify an Installed Integration or Application article.
Note: Select PostgreSQL Cluster.
Discover Resources in PostgreSQL Cluster Integration
- Navigate to Infrastructure > Search > DATABASES > PostgreSQL Cluster. The PostgreSQL Cluster page is displayed.
- Select the application on the PostgreSQL Cluster page
- The RESOURCE page appears from the right.
- Click the ellipsis (…) on the top right and select View Details.
- Navigate to the Attributes tab to view the discovery details.
View resource metrics
To confirm PostgreSQL Cluster monitoring, review the following:
- Metric graphs: A graph is plotted for each metric that is enabled in the configuration.
- Alerts: Alerts are generated for metrics that are configured as defined for integration.
- Click the Metrics tab to view the metric details for PostgreSQL Cluster.
Supported Alert Custom Macros
Customize the alert subject and description with the following macros so that it can generate alerts accordingly.
Supported macros keys:
| ${resource.name} | ${resource.ip} | ${resource.mac} |
| ${resource.aliasname} | ${resource.os} | ${resource.type} |
| ${resource.dnsname} | ${resource.alternateip} | ${resource.make} |
| ${resource.model} | ${resource.serialnumber} | ${resource.systemId} |
| ${parent.resource.name} |
Resource Filter Input keys
PostgreSQL Cluster application Resources are filtered and discovered based on below keys.
Note: You can filter the resources with the discoverable keys only.
The following tabs represent the Resource Type of PostgreSQL Cluster
| Supported Input Keys |
|---|
| resourceName |
| hostName |
| aliasName |
| dnsName |
| ipAddress |
| macAddress |
| os |
| make |
| model |
| serialNumber |
Risks, Limitations & Assumptions
- The integration can manage critical/recovery failure alerts for the following two scenarios when the user activates App Failure Notifications in the settings:
- Connectivity Exception
- Authentication Exception
- PostgreSQL Cluster will send any duplicate/repeat failure alert notification for every 6 hours.
- PostgreSQL Cluster cannot control monitoring pause/resume actions based on above alerts. Metrics can be used to monitor PostgreSql Cluster resources and can generate alerts based on the threshold values.
- We have provided 5432 as default Port value for connecting postgresql DB. Also, the default postgresDatabaseName is populated as “postgres”. Users can modify this value from application configuration page at any point of time if requires. Component level thresholds can be configured on each resource level.
- No support of showing activity logs.
- The Template Applied Time will only be displayed if the collector profile (Classic and NextGen Gateway) is version 18.1.0 or higher.
- Latest snapshot metric support from gateway version 14.0.0.
- This application supports both Classic Gateway and NextGen Gateway.
Troubleshooting
Before troubleshooting, ensure all prerequisites prerequisites are met.
If PostgreSQL Cluster integrations fail to discover or monitor, troubleshoot using the following steps:
- Check if any alerts have been generation on PostgreSQL Cluster, the gateway, or in vprobe.
- If there is an error or alert related to the end device connectivity or authentication, try checking the reachability of the end device from the gateway with the following commands:
- to ping the IP address provided in the configuration:
{ping <IP Address>} - to try telnet:
{telnet <IP Adress> <Port>} - to try ssh to the end device from the gateway
{ssh <username>@<node IP Address>} - To run an ssh command and DB command:
Prepare the request payload by using below sample request:
{ “apiVersion”: “debug/v1”, “module”: “Debug”, “app”: “postgresql-cluster”, “action”: “Reachability”, “payload”: { “ipAddressOrHostName”: “
”, “protocol”: “https”, “port”: 443, “requestPath”: “ ”, “version”:“v1”,
“requestMethod”:"<get/post>", “userName”: “
”, “password”: “ ” } } Encode the request payload to base64
Log in to the gateway concole and connect to the GCLI terminal using the below command:
{## gcli}Run the command using the previously generated base64 encoded string
{## sdkappdebug <base64 encoded string>}
- to ping the IP address provided in the configuration: