Introduction
MongoDB is a NoSQL database management application. NoSQL database systems offer an alternative to traditional relational databases using SQL (Structured Query Language). Data is stored in tables, rows, and columns in a relational database, with relationships between entities. MongoDB is a widely used, open-source, NoSQL (Not Only SQL) database. Here are some key points about MongoDB:
- Document-Oriented Database
- Flexible Schema
- Scalability
- High Performance
- Aggregation Framework
- Replication and High Availability
Key Use cases
Discovery Use cases
- It discovers the MongoDB cluster and its component nodes.
- Publishes relationships between resources to have a topological view and ease of maintenance.
Monitoring Use cases
- Provides metrics related to job scheduling time and status etc..
- Concern alerts will be generated for each metric to notify the administrator regarding the issue with the resource.
Supported Target Versions
- Validated on MongoDB version 6.0.10
Prerequisites
OpsRamp Classic Gateway 14.0.0 and above.
OpsRamp Nextgen Gateway 14.0.0 and above.
Note: OpsRamp recommends using the latest Gateway version for full coverage of recent bug fixes, enhancements, etc..Provided IPAddress/hostname, Credentials (SSH and MongoDB database) should work for accessing MongoDB clusters.
The SSH credentials should be same for all the MongoDB replica set cluster nodes.
The MongoDB credentials should be the same for all the MongoDB replica set node instances.
We are using macAddress as a uniqueId for resource creation. To fetch the MAC Address we are using the ip addr show command. So we need ip command path in PATH environment variable, please add below mentioned lines in
.profileor.bashrcfile in all the MongoDB servers ( User should have a home directory then only .bash_profile or .bashrc file will be present).PATH={ipPath}:$PATHexport PATHNotes:
- Where ipPath is path where ip command binary is present. for example: if ip command is present in “/usr/sbin”, then provide PATH=/usr/sbin:$PATH
- As we are utilizing a remote SSH connection, if the environment PATH does not include the binary path for the command, you may encounter a ‘command not found’ exception.
As part of discovery we are fetching the serial number and system UUID of the individual nodes. These details are fetched through command-line(SSH).
- If the SSH credentials being provided are “root” users, no changes need to be made.
- If the SSH credentials being provided are of a “non-sudo” user, then we need to make an entry in the /etc/sudoers file as below:
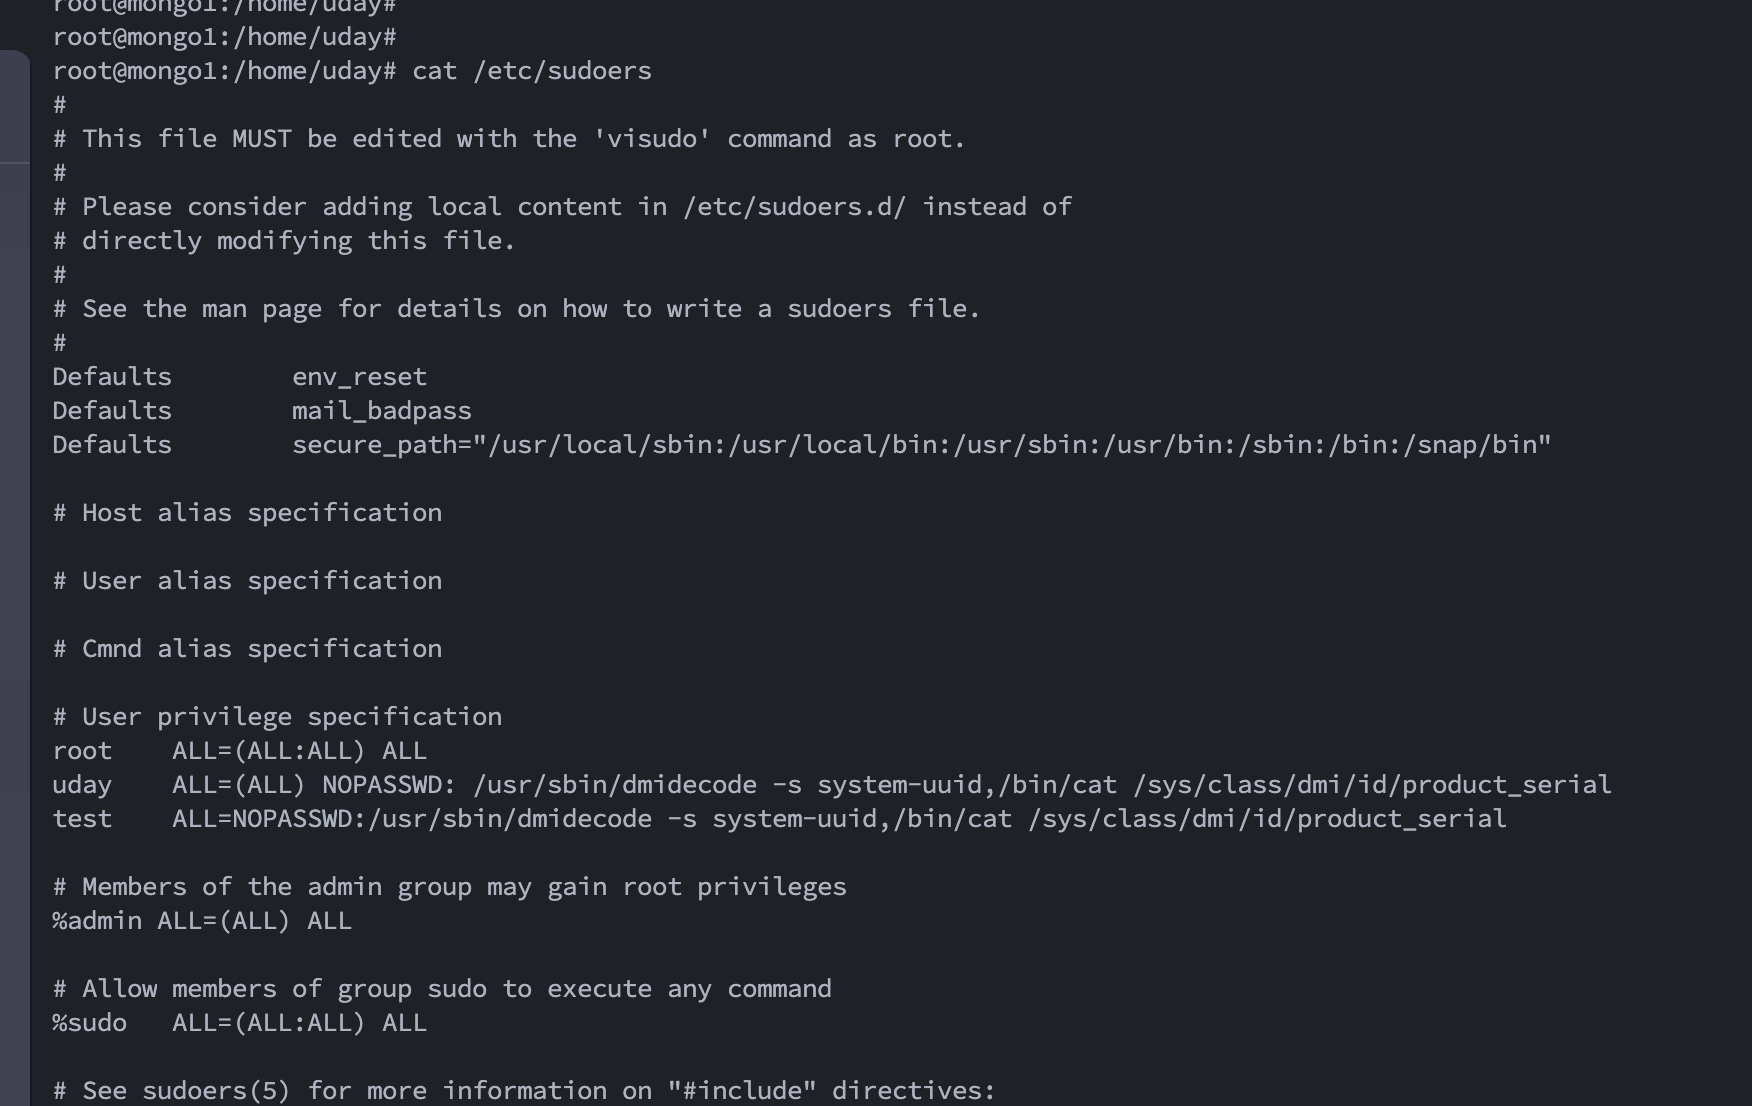
With the above entry, we will be able to execute that sudo command.
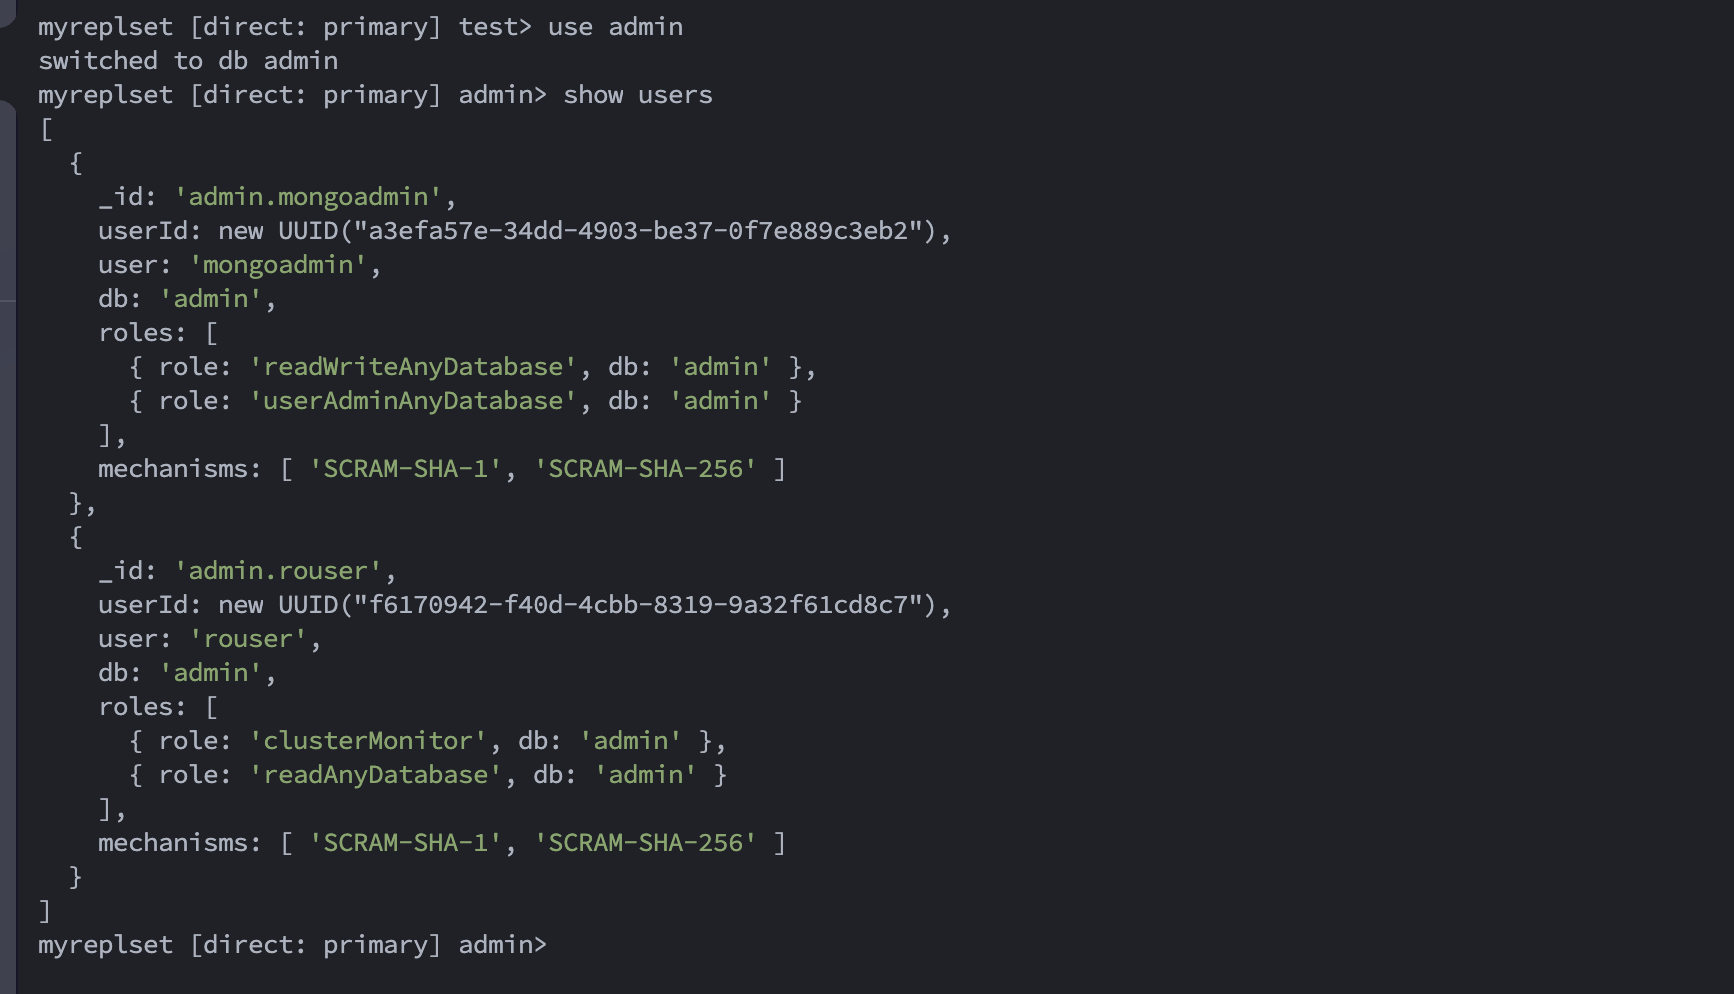
For connecting to the mongoDB instance, a user with “readAnyDatabase” and “clusterMonitor” role on the “admin” database will suffice. In case of replica set clusters the same user credential is expected to be available on all the nodes.
For example we have created the user as below:
We are using both SSH credentials (for ssh/cli access) and mongoDB instance credentials(for mongoDB instance connection). You may connect to the mongoDB instance using a connection string.
MongoDB hosts should be resolvable from the gateway.
If you are using the NextGen gateway and the hosts are not resolving from the gateway and vprobe container.
See How to manually add DNS Name Servers to k3s? to manually add DNS name servers to k3s
If you are using the classic gateway, please add a DNS server entry in the resolv.conf file or mention hosts in the /etc/hosts file.
Hierarchy of MongoDB resources
For a replica set cluster:
• MongoDB Replica Set
• MongoDB Server
For a standalone MongoDB instance:
• MongoDB Server
You may take the node ip, either standalone or one replica set node (in case of replica set cluster) and the concerned port as input as part of configuration. You would require ssh credentials for the mongoDB server and mongoDB instance credentials as well for executing the remote SSH/ CLI commands.
Supported Metrics
Click here to view the supported metrics
| Native Type | Metric Name | Display Name | Metric Label | Units | Application Version | Description |
|---|---|---|---|---|---|---|
| MongoDB Replica Set | mongodb_cluster_FailoverStatus | MongoDB Cluster Failover Status | Availability | None | 1.0.0 | Metric represents if failover happened in the replica set cluster. Possible values are : NoFailover - 0, FailoverHappened - 1 |
| mongodb_cluster_TotalNodes | MongoDB Cluster Total Nodes | Availability | count | 1.0.0 | Total number of MongoDB instances in the replica set cluster | |
| mongodb_cluster_ActiveClients | MongoDB Cluster Active Clients | Usage | count | 1.0.0 | Total number of active client connections to the database. | |
| mongodb_cluster_ActiveReadClients | MongoDB Cluster Active Read Clients | Usage | count | 1.0.0 | Count of the active client connections performing read operations. | |
| mongodb_cluster_ActiveWriteClients | MongoDB Cluster Active Write Clients | Usage | count | 1.0.0 | Count of active client connections performing write operations. | |
| mongodb_cluster_CurrentQueue | MongoDB Cluster Current Queue | Performance | count | 1.0.0 | Current Queue. | |
| mongodb_cluster_CurrentQueueReaders | MongoDB Cluster Current Queue Readers | Performance | count | 1.0.0 | Current readers in Queue. | |
| mongodb_cluster_CurrentQueueWriters | MongoDB Cluster Current Queue Writers | Performance | count | 1.0.0 | Current writers in Queue. | |
| MongoDB Server | mongodb_server_ReplicationState | MongoDB Server Replication State | Availability | None | 1.0.0 | MongoDB server replication state. Possible values are :PRIMARY :0 ,SECONDARY :1,DOWN :2,RECOVERING :3,STARTUP :4,STARTUP2 :5,FATAL :6,UNKNOWN :7 Note: This metric is not supported in MongoDB standalone server. |
| mongodb_server_Uptime | MongoDB Server Uptime | Availability | m | 1.0.0 | MongoDB server Uptime in minutes. | |
| mongodb_server_MessageAsserts | MongoDB Server Message Asserts | Usage | count | 1.0.0 | The number of messages asserts. These are typically used for logging and informational purposes. | |
| mongodb_server_RegularAsserts | MongoDB Server Regular Asserts | Usage | count | 1.0.0 | The number of regular asserts, which typically involve checks on data integrity and validation. | |
| mongodb_server_RolloverAsserts | MongoDB Server Rollover Asserts | Usage | count | 1.0.0 | The number of times the assert counters have rolled over. When the maximum value for an assert counter is reached, it rolls over to zero. | |
| mongodb_server_TotalAsserts | MongoDB Server Total Asserts | Usage | count | 1.0.0 | An aggregate count of all assertion checks, and it can provide insights into the overall health and reliability of your MongoDB server. | |
| mongodb_server_UserAsserts | MongoDB Server User Asserts | Usage | count | 1.0.0 | The number of users asserts, which can be raised by user-defined functions in MongoDB, such as those in JavaScript stored procedures. | |
| mongodb_server_WarningAsserts | MongoDB Server Warning Asserts | Usage | count | 1.0.0 | The number of warning asserts. These are non-fatal issues that MongoDB has detected but does not necessarily indicate data corruption. | |
| mongodb_server_AvailableConnections | MongoDB Server Available Connections | Usage | count | 1.0.0 | The number of unused, available connections that can be used by clients to connect to the server. It represents the pool of connections available for new client connections. | |
| mongodb_server_CurrentConnections | MongoDB Server Current Connections | Usage | count | 1.0.0 | The number of active connections to the MongoDB server. This represents the total number of currently open connections. | |
| mongodb_server_cachedCursors | MongoDB Server Cached Cursors | Performance | count | 1.0.0 | The number of cursors currently cached in memory. Cursor caching is used to optimize query performance. | |
| mongodb_server_OpenCursors | MongoDB Server Open Cursors | Performance | count | 1.0.0 | The current count of open cursors. | |
| mongodb_server_CursorsTimeout | MongoDB Server Cursors Timeout | Performance | count | 1.0.0 | The number of cursors that have timed out and been closed due to inactivity. This metric provides insights into cursor efficiency and system resource management. | |
| mongodb_server_HeapUsage | MongoDB Server Heap Usage | Usage | Bytes | 1.0.0 | MongoDB server heap usage. | |
| mongodb_server_Memory | MongoDB Server Memory | Usage | Bytes | 1.0.0 | The amount of memory used by the mongoDB server. | |
| mongodb_server_ResidentMemory | MongoDB Server Resident Memory | Usage | Bytes | 1.0.0 | The amount of memory (in bytes) currently used by the MongoDB server process for data, indexes, and other memory-mapped files that are in physical RAM. | |
| mongodb_server_VirtualMemory | MongoDB Server Virtual Memory | Usage | Bytes | 1.0.0 | The virtual memory size (in bytes) of the MongoDB server process. | |
| mongodb_server_NetworkRequests | MongoDB Server Network Requests | Usage | count | 1.0.0 | The cumulative count of client requests that have been processed by the MongoDB server since it was last started. | |
| mongodb_server_OpCounters | MongoDB Server Op Counters | Usage | count | 1.0.0 | OpCounters for a mongodb server. | |
| mongodb_server_OpCountersCommand | MongoDB Server Opcounters command | Usage | count | 1.0.0 | The total number of commands executed. | |
| mongodb_server_OpCountersDelete | MongoDB Server Opcounters Delete | Usage | count | 1.0.0 | The total number of delete operations executed. | |
| mongodb_server_OpCountersGet | MongoDB Server Opcounters Get | Usage | count | 1.0.0 | The total number of "get more" operations. | |
| mongodb_server_OpCountersInsert | MongoDB Server Opcounters Insert | Usage | count | 1.0.0 | The total number of insert operations performed. | |
| mongodb_server_OpCountersQuery | MongoDB Server Opcounters Query | Usage | count | 1.0.0 | The total number of query operations executed | |
| mongodb_server_OpCountersUpdate | MongoDB Server Opcounters Update | Usage | count | 1.0.0 | The total number of update operations performed. | |
| mongodb_server_PageFaults | MongoDB Server Page Faults | Performance | count | 1.0.0 | The number of page faults that have occurred on the MongoDB server. | |
| mongodb_server_network_BytesIn | MongoDB Server Netwotk Bytes In | Performance | Bytes | 1.0.0 | The total number of bytes received by the MongoDB server over the network since the server was last started. | |
| mongodb_server_network_BytesOut | MongoDB Server Network Bytes Out | Performance | Bytes | 1.0.0 | The total number of bytes sent by the MongoDB server over the network since the server was last started. | |
| mongodb_server_network_PhysicalBytesIn | MongoDB Server Network Physical Bytes In | Performance | Bytes | 1.0.0 | The physical network traffic that is received at network interface level. | |
| mongodb_server_network_PhysicalBytesOut | MongoDB Server Network Physical Bytes Out | Performance | Bytes | 1.0.0 | The physical network traffic that is sent at network interface level | |
| mongodb_server_NumRequests | MongoDB Server Number of Requests | Performance | count | 1.0.0 | The total number of client requests received by the MongoDB server since it started. | |
| mongodb_server_IndexSize | MongoDB Server Index Size | Usage | Bytes | 1.0.0 | The total size of all indexes on collections in the database, in bytes. | |
| mongodb_server_Size | MongoDB Server Database Size | Usage | Bytes | 1.0.0 | The total size that has been allocated for the database. |
Default Monitoring Configurations
MongoDB has default Global Device Management Policies, Global Templates, Global Monitors and Global Metrics in OpsRamp. You can customize these default monitoring configurations as per your business use cases by cloning respective Global Templates and Global Device Management Policies. We recommend doing this activity before installing the application to avoid noise alerts and data.
Default Global Device Management Policies
You can find the Device Management Policy for each Native Type at Setup > Resources > Device Management Policies. Search with suggested name in global scope. Each Device Management Policy follows below naming convention:
{appName nativeType - version - Mode}Ex: mongodb MongoDB Replica Set - 1 - Cluster(i.e, appName = mongodb, nativeType = MongoDB Replica Set , version = 1, , Mode = Cluster)
Default Global Templates
You can find the Global Templates for each Native Type at Setup > Monitoring > Templates. Search with suggested names in global scope. Each template follows below naming convention:
{appName Mode nativeType 'Template' - version}Ex: mongodb Cluster MongoDB Replica Set Template- 1(i.e, appName = mongodb, Mode = Cluster, nativeType = MongoDB Replica Set, version = 1)
Default Global Monitors
You can find the Global Monitors for each Native Type at Setup > Monitoring > Monitors. Search with suggested name in global scope. Each Monitors follows below naming convention:
{monitorKey appName nativeType - version}Ex: MongoDB Replica Set Cluster Monitor mongodb MongoDB Replica Set 1 (i.e, monitorKey =MongoDB Replica Set Cluster Monitor, appName = mongodb, nativeType = MongoDB Replica Set , version = 2)
Configure and Install the MongoDB Integration
- From All Clients, select a client.
- Navigate to Setup > Account.
- Select the Integrations tab.
- The Installed Integrations page, where all the installed integrations are displayed. Click + ADD on the Installed Integrations page.
- If you do not have any installed applications, you will be navigated to the Available Integrations page. The Available Integrations page displays all the available applications along with the newly created application with the version.
Note: Search for the application using the search option available. Alternatively, use the All Categories option to search. - Click ADD in the MongoDB tile.
- In the Configurations page, click + ADD. The Add Configuration page appears.
- Enter the following BASIC INFORMATION:
| Functionality | Description |
|---|---|
| Name | Enter the name for the configuration. |
| Mode | Select Cluster or Standalone based on the mongodb configuration:
|
| IP Address/Host Name of MongoDB Server | IP Address/Hostname of the target. |
| SSH Port | SSH Port Note: By default 22 is the port value |
| SSH Credentials | Select the SSH credentials from the drop-down list. Note: Click + Add to create a credential. |
| MongoDB Port | MongoDB Port Note: By default 27017 is the prot value. |
| MongoDB Instance Credentials | Select the MongoDB Instance Credentials from the drop-down list. Note: Click + Add to create a credential. |
Notes:
- IP Address/Host Name should be accessible from Gateway.
- App Failure Notifications: if turned on, you will be notified in case of an application failure that is, Connectivity Exception, Authentication Exception.
- Select the following Custom Attribute:
| Field Name | Description |
|---|---|
| Custom Attribute | Select the custom attribute from the drop down list box. |
| Value | Select the value from the drop down list box. |
Note: The custom attribute that you add here will be assigned to all the resources that are created by the integration. You can add a maximum of five custom attributes (key and value pair).
- In the Native Types section, select the native types to be discovered.
- In the DISCOVERY SCHEDULE section, select recurrence pattern to add one of the following patterns:
- Minutes
- Hourly
- Daily
- Weekly
- Monthly
- Click ADD.
The configuration is saved and displayed on the configurations page after you save it.
Note: From the same page, you may Edit and Remove the created configuration.
Under the ADVANCED SETTINGS, Select the Bypass Resource Reconciliation option, if you wish to bypass resource reconciliation when encountering the same resources discovered by multiple applications.
Note: If two different applications provide identical discovery attributes, two separate resources will be generated with those respective attributes from the individual discoveries.
Click NEXT.
(Optional) Click +ADD to create a new collector. You can either use the pre-populated name or give the name to your collector.
Select an existing registered profile.
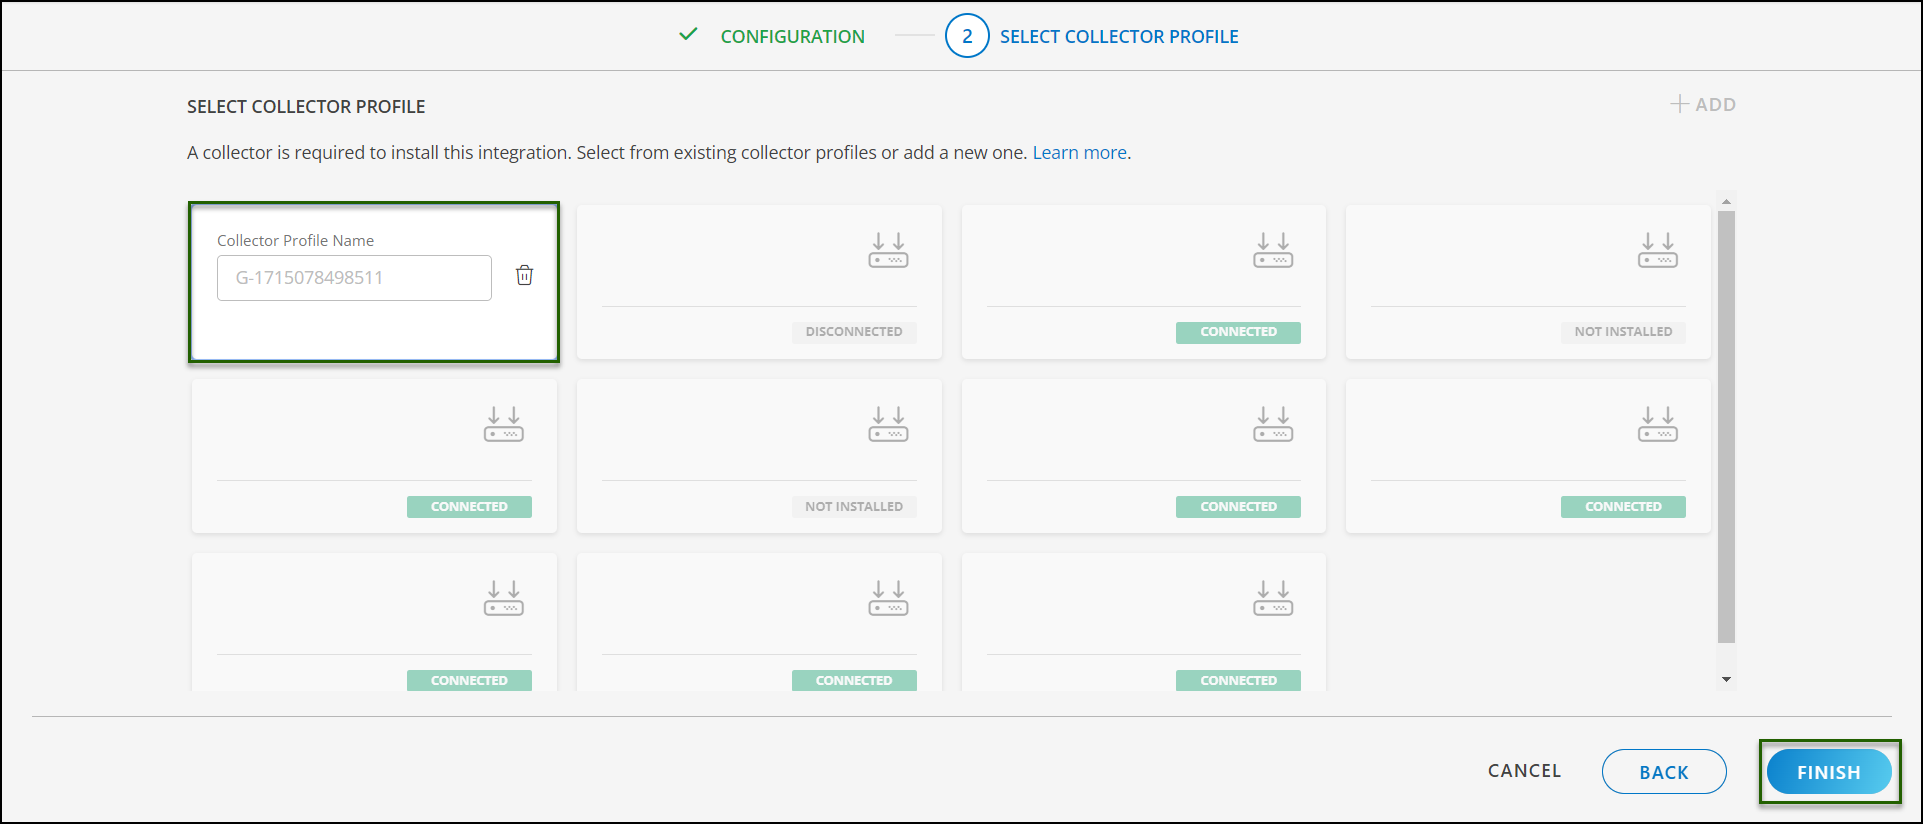
- Click FINISH.
The integration is installed and displayed on the INSTALLED INTEGRATION page. Use the search field to find the installed integration.
Modify the Configuration
See Modify an Installed Integration or Application article.
Note: Select MongoDB.
View the MongoDB Details
To discover resources for MongoDB, you have two options:
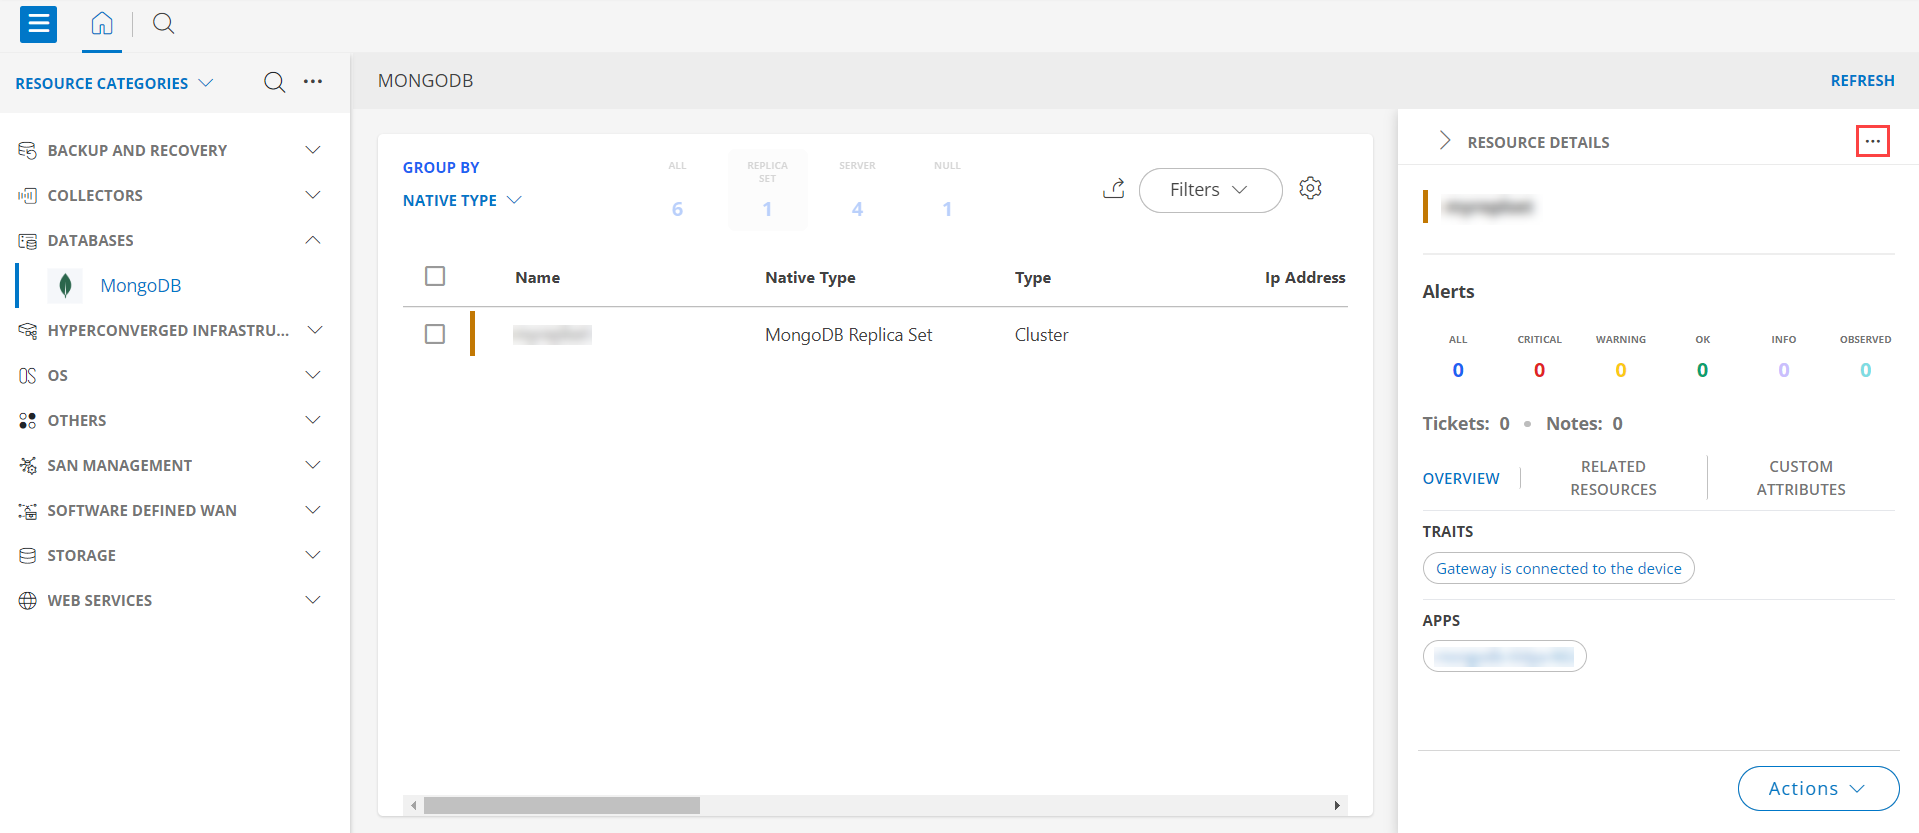
- Navigate to Infrastructure > Search > DATABASES > MongoDB.
- The MONGODB page is displayed, select the application name.
- The RESOURCE DETAILS page appears from the right.
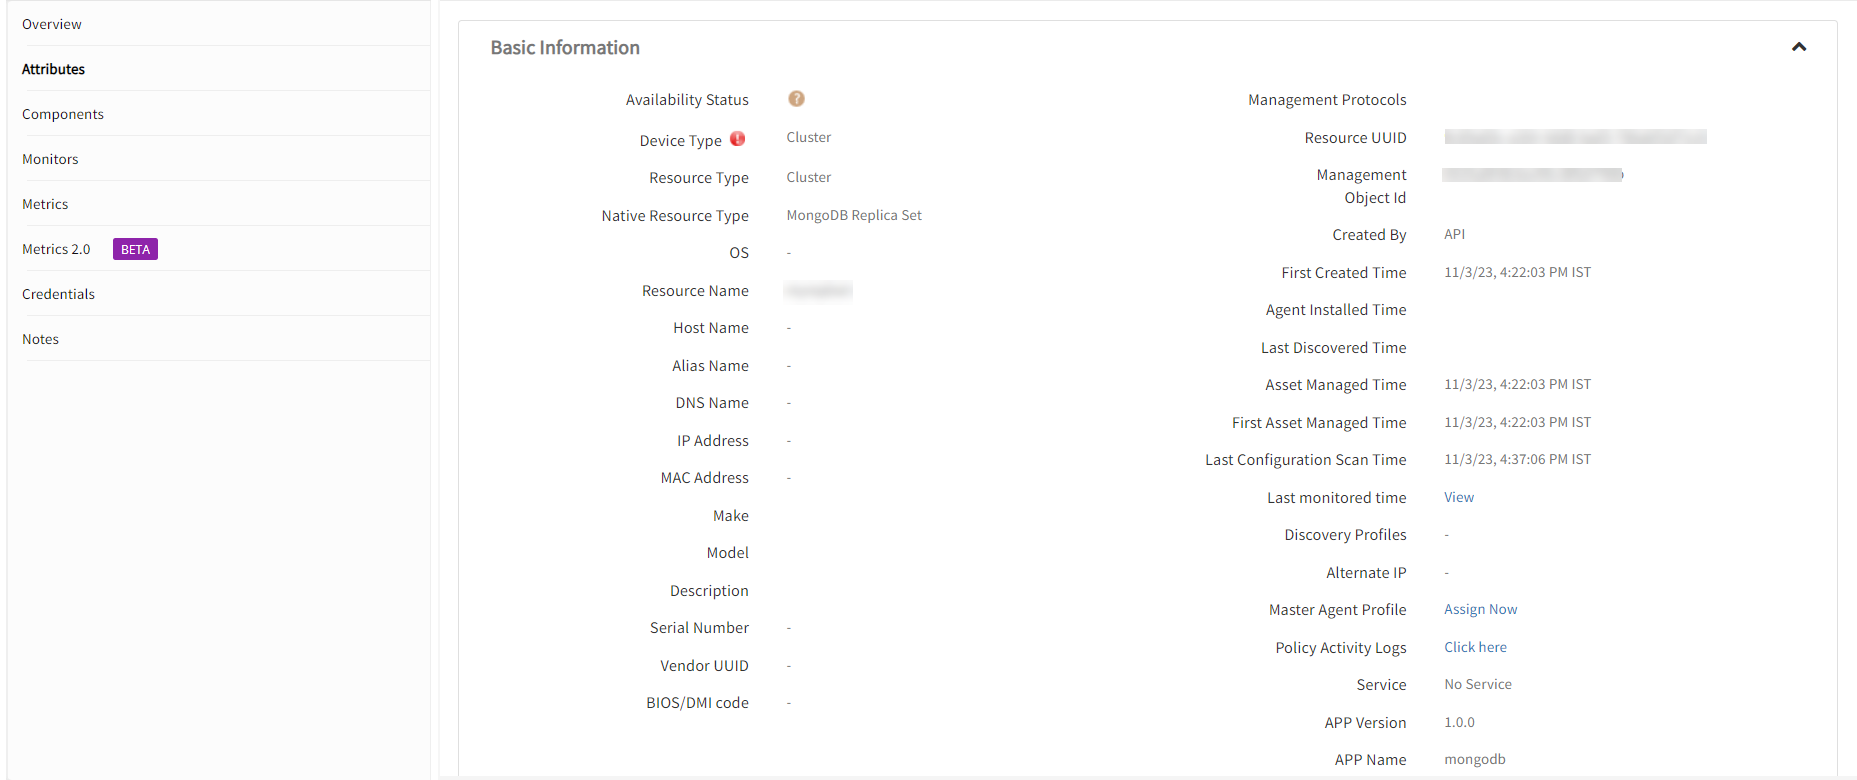
- Click the ellipsis (…) on the top right and select View details.
- Navigate to the Attributes tab to view the discovery details.
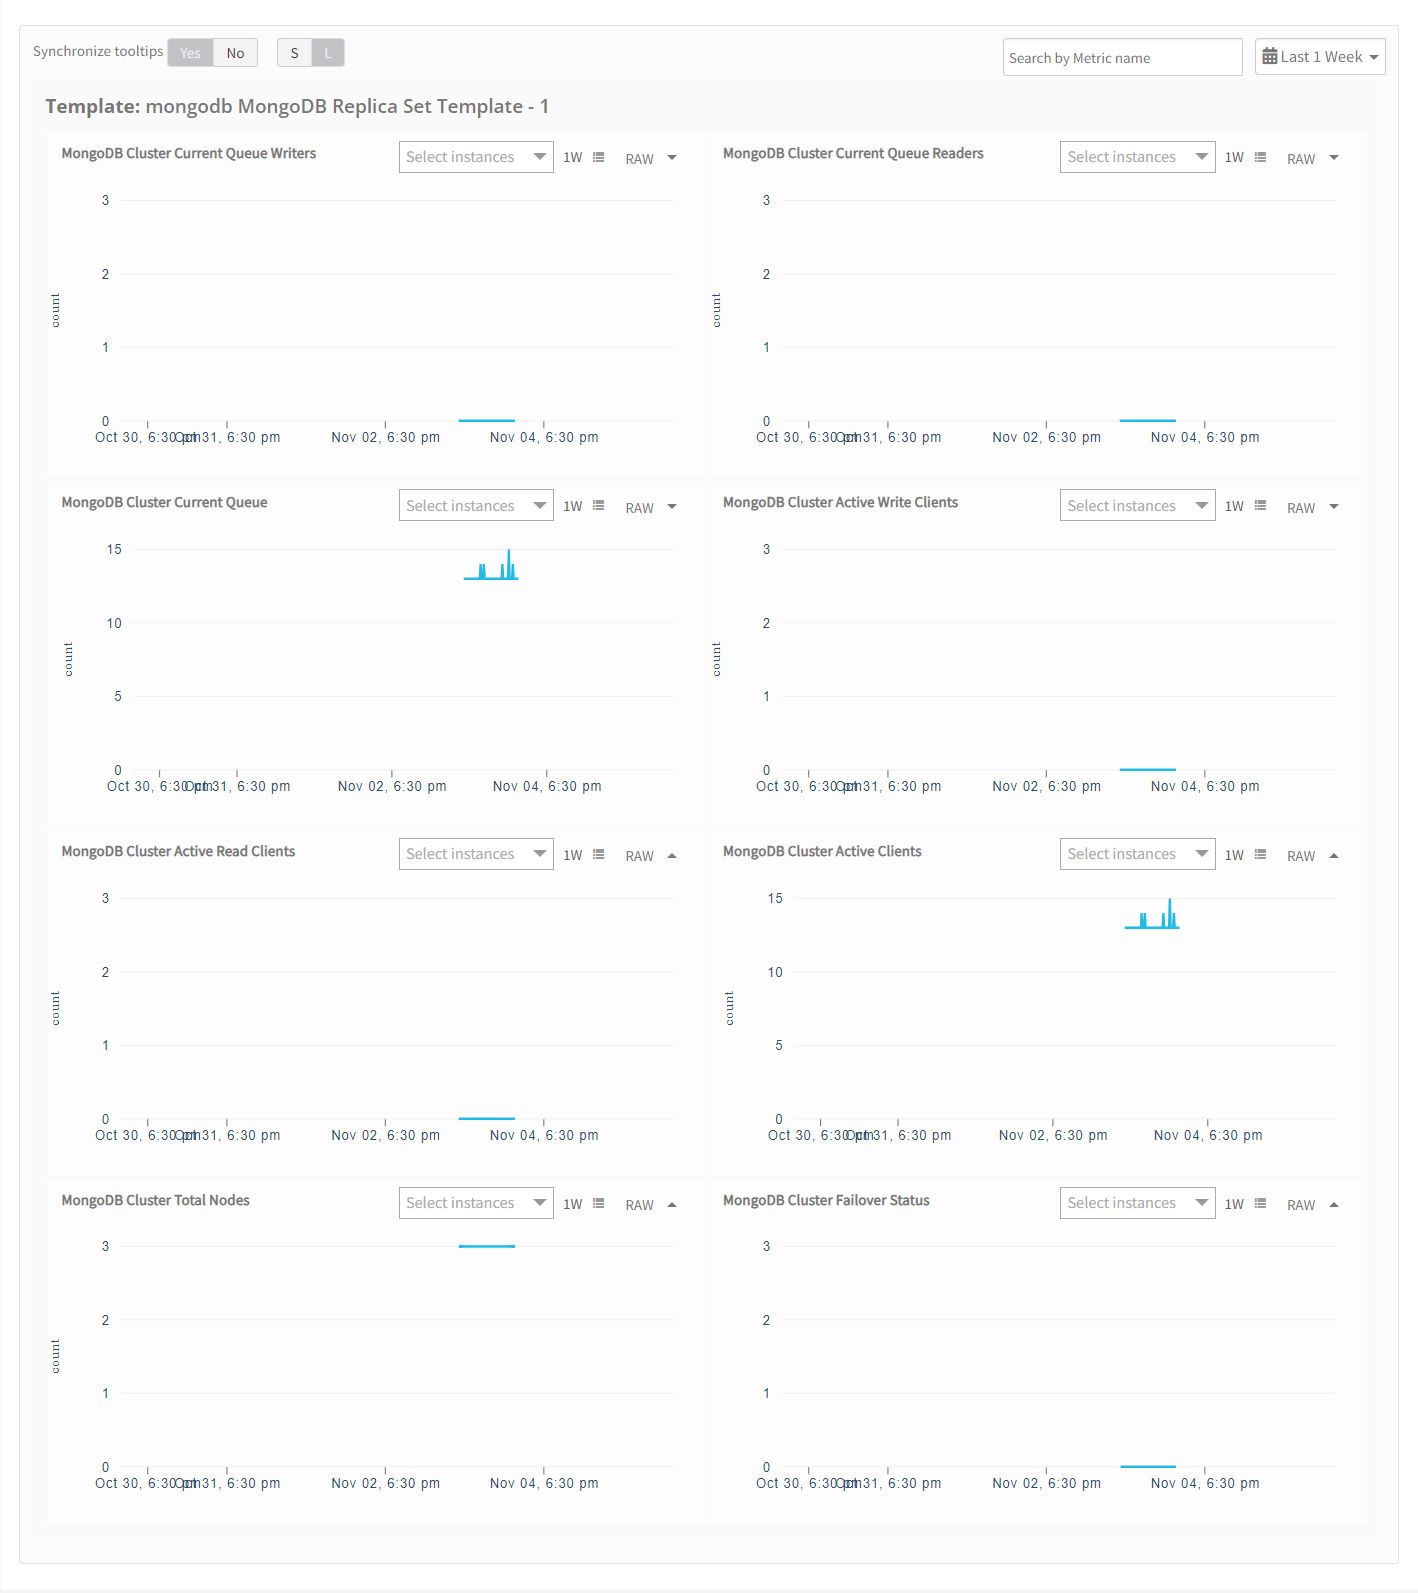
- Click the Metrics tab to view the metric details for MongoDB.
View resource metrics
To confirm MongoDB monitoring, review the following:
- Metric graphs: A graph is plotted for each metric that is enabled in the configuration.
- Alerts: Alerts are generated for metrics that are configured as defined for integration.
Resource Filter Input keys
MongoDB application Resources are filtered and discovered based on below keys:
Click here to view the Supported Input Keys
| Resource Type | Supported Input Keys |
|---|---|
| All Types | resourceName |
| hostName | |
| aliasName | |
| dnsName | |
| ipAddress | |
| macAddress | |
| os | |
| make | |
| model | |
| MongoDB Server | Arbiter Node |
| Member Id | |
| MongoDB Version |
Supported Alert Custom Macros
Customize the alert subject and description with below macros then it will generate alert based on customisation.
Supported macros keys:
Click here to view the alert subject and description with macros
${resource.name}
${resource.ip}
${resource.mac}
${resource.type}
${resource.make}
${resource.model}
${resource.serialnumber}
${resource.systemId}
${parent.resource.name}
${Custom attributes on the resource}
Risks, Limitations & Assumptions
- The application can manage critical/recovery failure alerts for the following two scenarios when the user activates App Failure Notifications in the settings:
- Connectivity Exception
- Authentication Exception
- MongoDB will send any duplicate/repeat failure alert notification for every 6 hours.
- MongoDB cannot control monitoring pause/resume actions based on above alerts. Metrics can be used to monitor PowerMax resources and can generate alerts based on the threshold values.
- We have provided 22 as default Port for SSH and 27017 as default Port for MongoDB. Users can modify this value from application configuration page at any point of time if requires.
- Component level thresholds can be configured on each resource level.
- The Template Applied Time will only be displayed if the collector profile (Classic and NextGen Gateway) is version 18.1.0 or higher.
- The minimum supported version for the option to get the latest snapshot metric is Nextgen-14.0.0.
- MongoDB supports both Classic Gateway and NextGen Gateway.
- MongoDB will work only if each Mongo DB instance is configured on different server.
- For a MongoDB cluster, If Standalone Mode is selected part of configuration, only MongoDB Server will get created/updated. MongoDB Replica Set wont be discovered and will get deleted if already exists.
Version History
| Application Version | Bug fixes / Enhancements |
|---|---|
| 2.1.0 | This implementation introduces third-party CI alert mapping and OpsQL-based enhancements.Configure alert mappings to target CI systems through the application configuration. After configuration, the system automatically forwards alerts to the corresponding third-party platforms and maps them to the specified CIs, ensuring consistent integration and efficient alert management.Previously, resource filters in the app configuration required manual entry of resource core and custom attributes. With this enhancement, the configuration is moved to OpsQL-based filtering, where users can see the keys auto-populated as needed. |
| 2.0.2 |
|
| 2.0.1 | Support for multiple MongodB instances running on same node. |
| 2.0.0 | Persona changes to support Cluster and Standalone MongoDB configurations. |
| 1.0.0 | Initial version with discovery, monitoring, alerts. |