Kubernetes is a container-orchestration system for automating deployment, scaling, and management of containerized applications. Kubernetes integration monitors the health and performance of your Kubernetes cluster.
You can monitor the following Kubernetes components:
- KubeDNS / CoreDNS
- Kube Scheduler
- Kube Controller
- Kube API Server
- Kubelet
- Kube State (Not installed by default in the K8s Cluster)
- Metrics Server (Not installed by default in the K8s Cluster)
With Kubernetes monitoring, you can also monitor Docker containers.
Prerequisites
Install Kube State and Metrics Server manually to fetch and monitor metrics.
To deploy Kube State, get the latest version of the deployment YAML file and compatibility matrix from GitHub.
To deploy Metrics Server, get the latest version of the deployment YAML file and compatibility matrix from GitHub.
Configure Kubernetes
Step 1: Prerequisites
Install
kube-statemetrics.- Use the right version of kube state YAML for the deployment according to the Kubernetes version of the cluster.
- When deployed, set the kube state service Cluster IP with an IP Address. The agent requires the address to fetch the metrics from kube state. If Cluster IP is not set (Shown as NONE) modify the service.yaml file and remove clusterIP: None.
Modified service.yaml file (version 1.9) example:
    apiVersion: v1
    kind: Service
    metadata:
      labels:
        app.kubernetes.io/name: kube-state-metrics
        app.kubernetes.io/version: 1.9.7
      name: kube-state-metrics
      namespace: kube-system
    spec:
      ports:
      - name: http-metrics
        port: 8080
        targetPort: http-metrics
      - name: telemetry
        port: 8081
        targetPort: telemetry
      selector:
        app.kubernetes.io/name: kube-state-metrics
(Optional) To monitor using the metric server, deploy Metrics Server.
kubectl apply -f https://github.com/kubernetes-sigs/metrics-server/releases/download/v0.3.7/components.yamlPerform more configurations depending on the environment:
- For AKS, installing
kube-dnspatch. - For GKE, enabling RBAC.
- For On-Prem, patch.
- For AKS, installing
Step 2: Install kube-state metrics
To see if kube-state-metrics is installed in the cluster, run the following command on the controller nodes:
kubectl get svc --all-namespaces | grep kube-state-metrics | grep -v grepThe following sample output confirms that kube-state-metrics is already installed in the cluster:
kube-system kube-state-metrics ClusterIP 10.96.186.34 <none> 8080/TCP,8081/TCP 19dTo install kube-state metrics, do the following on the Kubernetes controller nodes:
- Clone the Kubernetes
kube-state-metricsGithub repo. - Run
kubectl apply -f kube-state-metrics/examples/standard/.
git clone https://github.com/kubernetes/kube-state-metrics.git
kubectl apply -f kube-state-metrics/examples/standard/
Step 3: Additional configurations
Additional configurations depend on the Kubernetes environment:
- Azure AKS
- Google GKE
Azure AKS: Install kube-dns patch
For an Azure AKS environment, you must apply a patch. This patch is a DNS Service patch for the Azure (AKS) environment.
- By default, the sidecar container is disabled.
- The patch is required to export kube-dns metrics.
To install the kube-dns patch for the Azure (AKS) environment:
- Copy the provided
Kube dnspatch script tokube-dns-metrics-patch.yaml. - Execute the command on the controller nodes to apply the patch:
kubectl patch deployment -n kube-system kube-dns-v20 --patch "$(cat kube-dns-metrics-patch.yaml)"The following is the Kube dns patch script that you save as kube-dns-metrics-patch.yaml.
spec:
  template:
    spec:
      containers:
      - name: kubedns
        env:
        - name: PROMETHEUS_PORT
          value: "10055"
      - name: sidecar
        image: k8s.gcr.io/k8s-dns-sidecar-amd64:1.14.10
        livenessProbe:
          httpGet:
            path: /metrics
            port: 10054
            scheme: HTTP
          initialDelaySeconds: 60
          time-outSeconds: 5
          successThreshold: 1
          failureThreshold: 5
        args:
        - --v=2
        - --logtostderr
        - --probe=kubedns,127.0.0.1:10053,kubernetes.default.svc.cluster.local
        - --probe=dnsmasq,127.0.0.1:53,kubernetes.default.svc.cluster.local
        ports:
        - containerPort: 10054
          name: metrics
          protocol: TCP
        resources:
          requests:
            memory: 20Mi
            cpu: 10m
Execute the following command in the controller nodes to apply a patch:
kubectl patch deployment -n kube-system kube-dns-v20 --patch "$(cat kube-dns-metrics-patch.yaml)"AWS, Google, and on-premise environments do not require any patches to collect the DNS metrics.
Google GKE: Enable RBAC
For a Google GKE environment, you must grant permissions to create roles in Kubernetes. To grant permission to create roles, execute the following command:
kubectl create clusterrolebinding cluster-admin-binding
    --clusterrole cluster-admin
    --user $(gcloud config get-value account)
This command binds the clusterrole and cluster-admin to the current user.
Step 4: (Optional) Perform Optional Configuration
On-Premise: Apply patches
If patching is required on on-premise nodes, do the following:
- Create a user account in all nodes of the cluster to collect packages information and install patches.
- Execute the following scripts on the Kubernetes nodes. The script depends on the operating system used to create the cluster.
The following is an example Ubuntu script:
Configure()
{
            mkdir /opt/opsramp/k8s/patch/{tmp,log} -p  > /dev/null 2>&1
            useradd opskube -s /bin/bash -d /opt/opsramp/k8s/patch/  > /dev/null 2>&1
            usermod -p '$6$dBsN2u5SuC.Niy.C$HxPpbXRZcaQpHui8D3QZshhdJz57xhU1roE12U4KEmlyCNiBNzcGRbrNI7.DREwsf18JUAMT27/VaZmr34Bul.' opskube > /dev/null 2>&1
            if [ -d /etc/sudoers.d ]
            then
                echo "opskube ALL=(ALL) NOPASSWD: /opt/opsramp/k8s/patch/" > /etc/sudoers.d/opskube
                chmod 0440 /etc/sudoers.d/opskube
            else
                sed -i '$ a opskube ALL=(ALL) NOPASSWD: /opt/opsramp/k8s/patch/' /etc/sudoers > /dev/null 2>&1
            fi

            dpkg -s python-apt | grep Status | grep installed
            STATUS1=$?
            if [ $STATUS1 -eq 0 ]
            then
                echo "python-apt already installed! No changes required!"
            else
                apt-get update > /dev/null 2>&1
                apt-get -y install python-apt > /dev/null 2>&1
            fi

}
The following is an example CentOS script:
Configure()
{
            mkdir /opt/opsramp/k8s/patch/{tmp,log} -p  > /dev/null 2>&1
            useradd opskube -s /bin/bash -d /opt/opsramp/k8s/patch/  > /dev/null 2>&1
            usermod -p '$6$dBsN2u5SuC.Niy.C$HxPpbXRZcaQpHui8D3QZshhdJz57xhU1roE12U4KEmlyCNiBNzcGRbrNI7.DREwsf18JUAMT27/VaZmr34Bul.' opskube > /dev/null 2>&1
            if [ -d /etc/sudoers.d ]
            then
                echo "opskube ALL=(ALL) NOPASSWD: /opt/opsramp/k8s/patch/" > /etc/sudoers.d/opskube
                chmod 0440 /etc/sudoers.d/opskube
            else
                sed -i '$ a opskube ALL=(ALL) NOPASSWD: /opt/opsramp/k8s/patch/' /etc/sudoers > /dev/null 2>&1
            fi

            rpm -qa | grep rpm-python
            STATUS1=$?
            if [ $STATUS1 -eq 0 ]
            then
                echo "rpm-python already installed! No changes required!"
            else
                yum  -y install rpm-python > /dev/null 2>&1
            fi

}
Configure OpsRamp
Step 1: Configure and Install Kubernetes Integration
From All Clients, select a client.
Go to Setup > Integrations and Apps.
If there are apps/integrations already installed, it will redirect to the INSTALLED INTEGRATIONS page where all the installed integrations/apps are displayed. Click +ADD and search for Kubernetes on the AVAILABLE INTEGRATIONS AND APPS page. Also you can use the All Categories dropdown list to search. If there are no installed apps, it will navigate to the AVAILABLE INTEGRATIONS AND APPS page.
Click +ADD on the Kubernetes tile.
Enter the following details:
- Name: Name for the integration.
- Deployment type: On-prem or Cloud (AWS, GKE, and AKS)
- Container Engine: Docker or ContainerD. Primarily, Docker is used. ContainerD is used for K3s integration.
Click on NEXT.
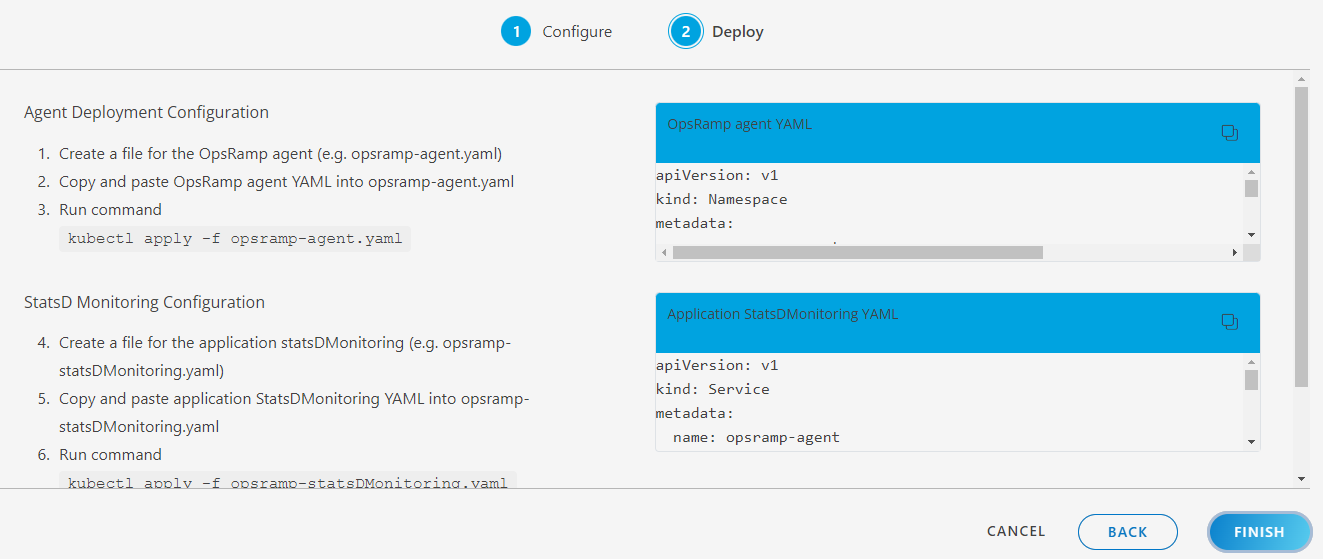
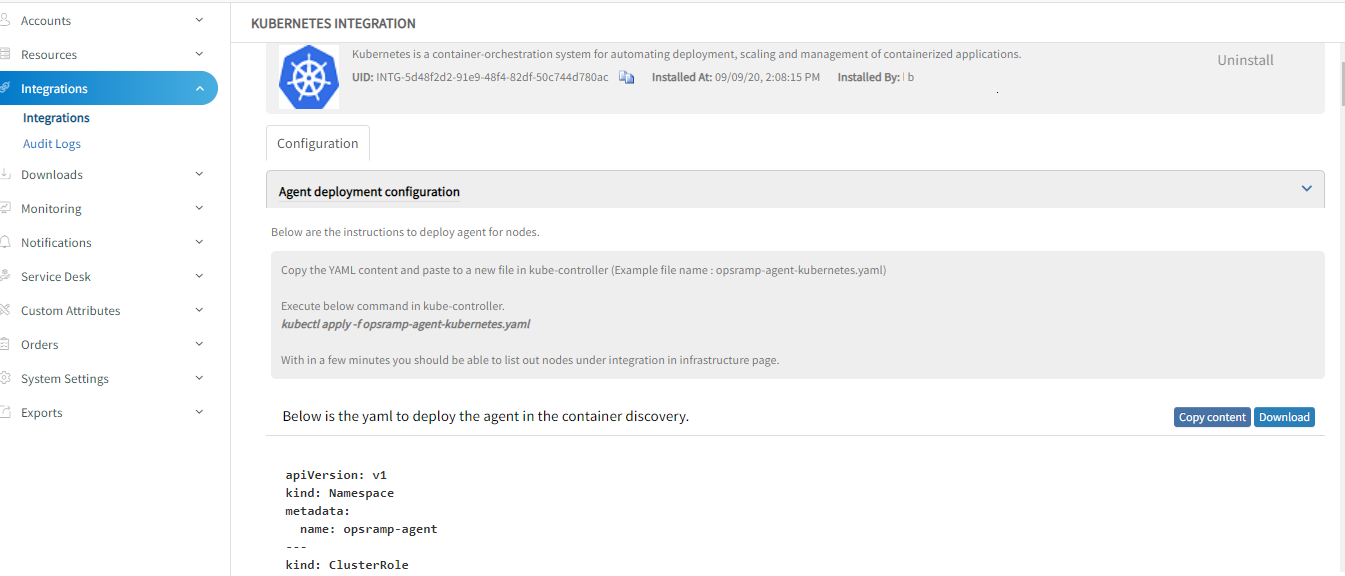
Step 2: Deploy the agent on a Kubernetes node
Copy the YAML content and paste to a new file in
kube-controller(Example file name:opsramp-agent-kubernetes.yaml)Execute the command
kubectl apply -f opsramp-agent-kubernetes.yamlinkube-controller.
Deploy only K8s agent in the node that belongs to the Kubernetes cluster, not the Agent installed using pkg (deb/rpm). If a regular agent (non-containerized agent) is already running in the worker nodes of the Kubernetes cluster, uninstall that agent using the pkg uninstall commands (dpkg -P opsramp-agent OR rpm -e opsramp-agent).
Environment Variables in an agent YAML file
You can adjust the following environment variable to change the Log Level of the agent:
  - name: LOG_LEVEL
    value: "warn"
Worker Agent: This Daemonset is responsible for collecting System Performance Metrics, Container Metrics (Docker Or ContainerD), Kubelet, and all the container app metrics.
Master Agent: This deployment is responsible for collecting
k8s-apiserver,k8s-controller,k8s-scheduler,k8s-kube-state,k8s-metrics-server,k8s-coreDNS/kubeDNSmetrics.
Note
In the agent deployment file, OpsRamp agent pod is deployed with the latest image tag and ImagePullPolicy is set to Always for it.
This allows the agent to be run with the latest release version. If you restart the agent pod or daemonset at any time, the kubernetes cluster deploys the new agent pod(s) with the latest version if the agent image’s latest tag is updated by OpsRamp
To avoid this automatic updates of an agent version, add the image tag in the deployment file with the recent agent version before deploying the agent yaml to the cluster.
Examples: -
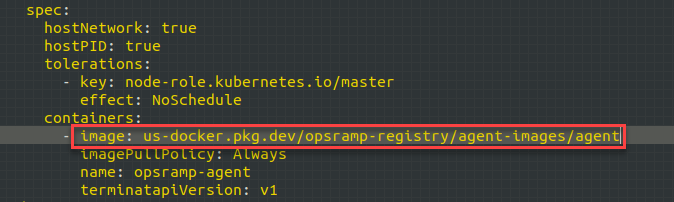
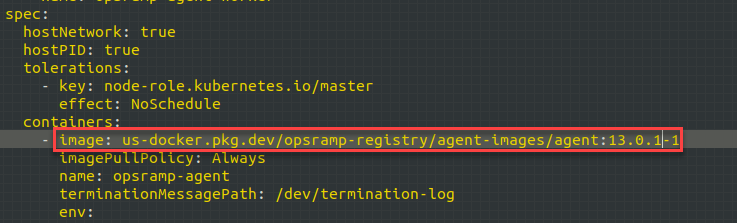
- Default image tag:
us-docker.pkg.dev/opsramp-registry/agent-images/agent - Change to:
us-docker.pkg.dev/opsramp-registry/agent-images/agent:13.0.1-1into both the places in the deployment file.
Connecting Agents using a proxy
Use the following environment variables:
CONN_MODE=proxy
PROXY_SERVER=<ProxyServerIP>
PROXY_PORT=<ProxyPort>
If the proxy server needs authentication, set the following credentials or else skip setting the below environment variables.
PROXY_USER=<User>
PROXY_PASSWORD=<Password>
Step 3: Applying Monitoring Templates and Creating Device Management Policy
- Apply the appropriate Kubernetes template on the Integration resource (cluster resource) that is created after the deployment of the agent YAML file. Apply the Kubernetes template only on the Integration resource, not on the worker nodes.
- Apply the Docker Host Monitoring template and Kubelet Template on each worker agents created under the Integration resource in the application. Alternatively, you can also create a Device Management Policy to do Step 1 and Step 2.
Step 4: (Optional) Configuring Docker and Kubernetes event
Configure Docker Events
Docker events are by default disabled in the agent deployment YAML file. The agent supports the following three docker events by default:
- Start
- Kill
- Oom (Out of Memory)
To enable the Docker events, change the DOCKER_EVENTS environment variable to TRUE.
Disabled by Default
- name: DOCKER_EVENTS
  value: "FALSE"
Enabled
- name: DOCKER_EVENTS
  value: "TRUE"
For agent versions 8.0.1-1 and above, the Docker events are sent as monitoring alerts. For the older versions of agent, the Docker events are sent as maintenance alerts to the OpsRamp alert browser.
Configure Kubernetes Events
OpsRamp Agent can forward the Kubernetes events that are generated in the cluster.
By default, this feature is disabled in the agent deployment YAML file. To enable, change the K8S_EVENTS environment variable to TRUE.
Disabled by Default
- name: K8S_EVENTS
  value: "FALSE"
Enabled
- name: K8S_EVENTS
  value: "TRUE"
By default, the agent forwards all the Kubernetes events without making any updates. To forward only selected events, you must edit the kube events config map in the YAML file.
The events are categorized into the following three types:
- Node
- Pod
- Other
To opt-out of any of these events, remove the event from the agent deployment YAML file.
To add an event that is not supported, add the event (Kube Event Reason) under the appropriate category. If the reason matches with the actual Kubernetes event reason, events are forwarded as alerts.
For agent versions 8.0.1-1 and above, the Kubernetes events are sent as monitoring alerts. For the older versions of agent, the Kubernetes events are sent as maintenance alerts to the OpsRamp alert browser.
By default, all events are converted as Warning alerts.
To forward any events with a different alert state, change the event name followed by alert state (Critical/Warning), as shown below.
pod:
  - Failed:Critical
  - InspectFailed:Warning
  - ErrImageNeverPull
  - Killing
Events supported by default
| node | pod | other |
|---|---|---|
|
|
|
List of Metrics
View the list of metrics with description applicable to the following monitors: k8s-apiserver, k8s-controller, k8s-scheduler, k8s-kube-state, k8s-metrics-server, k8s-coreDNS / kubeDNS.
For complete details, view List of Metrics.
Next steps
After a discovery profile is created:
- View the integration, go to Infrastructure > Resources.
- Assign monitoring templates to the resource.
- Validate that the resource was successfully added to OpsRamp.
FAQs
Will the agents deploy automatically when a new node is attached to the Kubernetes cluster?
Yes, worker agents are deployed using a daemonset. As a result, when a new node is joined/attached to the cluster the worker agent gets automatically deployed.
What happens when the pod having the agent is deleted?
A new pod with the agent is deployed automatically by the Kubernetes scheduler.
Does failure of an agent in one node affect the agents in other nodes?
No. All agents work independently. As a result, if one agent is not behaving properly then the impact is limited only to that agent.
What happens if the agent container in the pod crashes or gets deleted?
The agent restarts and the monitoring resumes. Only in a rare scenario, the metrics for an iteration or two is missed.
Are configuration update inside the container (by logging into the agent container) applied to the agent?
No. Any configuration update inside the agent container does not impact the running agent. All such configuration updates must be performed using config maps and applied again.
Will I get metrics while the agent is getting updated?
Agent update completes in seconds and when the agents are up with the new version, monitoring starts again and all monitoring frequencies are set accordingly. Only in a rare scenario, one iteration of monitoring is missed.
What is the default Log Level for agents that are being deployed?
The Default Log Level is Warning.
Can a node have more than one agent installed?
No, only one worker agent is installed per node, and one master agent installed per cluster on any one of the nodes in the cluster.
Does monitoring stop if the master agent crashes or is deleted?
No, only the kube-apps metrics are stopped. Container metrics sent from workers keep working.
Why is my Kubernetes topology not showing up?
This is because you have not enabled the topology mapping feature flag.
See Kubernetes Topology document for more information.