Introduction
Network Time Protocol is widely used to synchronize system clocks among a set of distributed time servers and clients.The goal of NTP algorithms is to minimize the time difference and frequency between UTC and the system clock (Offset). When these differences are reduced below nominal tolerances, the system clock is said to be synchronized to UTC.
Collector type
Gateway
Synopsis
Gateway based OpsRamp SNMP Extended Monitor to Alert On Network Time Protocol offset for a specified server. This value is displayed in seconds, showing how far your clock is from the NTP server’s reported time. It can be positive or negative.
Template Details
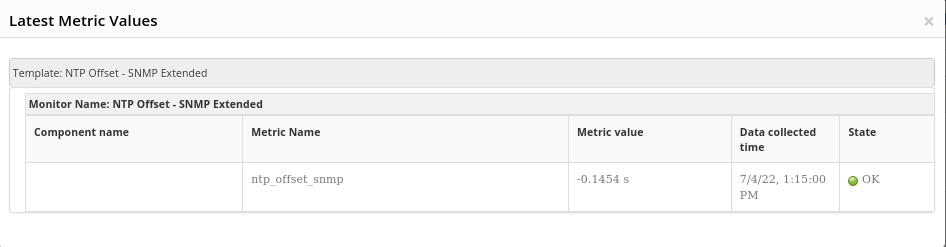
Metric Name: ntp_offset_snmp
Monitor Name: NTP Offset - SNMP Extended
Template Name: NTP Offset - SNMP Extended (Alerting is disabled by default)
Configuration Parameters
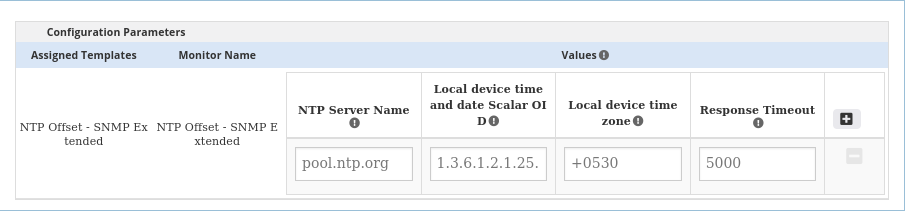
- The NTP Server name.
- Default value: pool.ntp.org.
- Date And Time scalar OID from the network device
- Default value: 1.3.6.1.2.1.25.1.2.0.
Note: If the system supports different scalar OID for date and time, then the user can replace the default value while assigning/reassigning the template.
- Default value: 1.3.6.1.2.1.25.1.2.0.
- Time zone of the local system.
- syntax: +/-HHmm
- example: +0530
- Default value: +0000
- Response timeout in milliseconds.
- By default 5000.
Output
The NTP Offset value in seconds.
Get Latest Metric Values
Graphical metrics representation
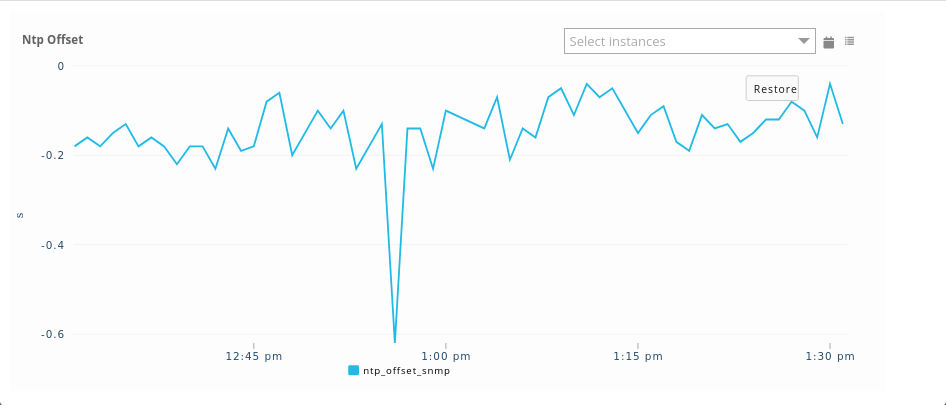
Limitations
- The gaps in graphs may occur due to any of the below exceptions.
- SocketException : Indicate that there is an error creating or accessing a Socket.
- SocketTimeoutException : Signals that a timeout has occurred on a socket read or accept. If it takes more time than the response time provided by the user, the exception is raised.
- In some cases, this SNMP based monitoring is not feasible, if there is no scalar OID which provides the current system date and time.
Troubleshooting
If you see gaps in graphs follow below steps for more info:
- Login into gateway shell.
- We can then verify statements with this command tail -100f /var/log/app/vprobe.out.
