Sysdig is a secure DevOps platform that helps enterprises operate reliable, secure, containerized cloud-native applications. OpsRamp integration with Sysdig ingests alerts. These alerts are used in the Sysdig Monitor when event thresholds have been crossed.
Sysdig Version Supported for Integration: 3.2.0
OpsRamp configuration
Inbound configurations capture all the details required to call OpsRamp APIs.
Step 1: Install the integration
- From All Clients, select a client.
- Go to Setup > Account.
- Select the Integrations and Apps tab.
- The Installed Integrations page, where all the installed applications are displayed. Note: If there are no installed applications, it will navigate to the Available Integrations and Apps page.
- Click + ADD on the Installed Integrations page. The Available Integrations and Apps page displays all the available applications along with the newly created application with the version.
- Search for the application using the search option available. Alternatively, use the All Categories option to search.
- Click ADD on the Sysdig tile.
Inbound (Optional):
To configure the inbound, follow these steps:
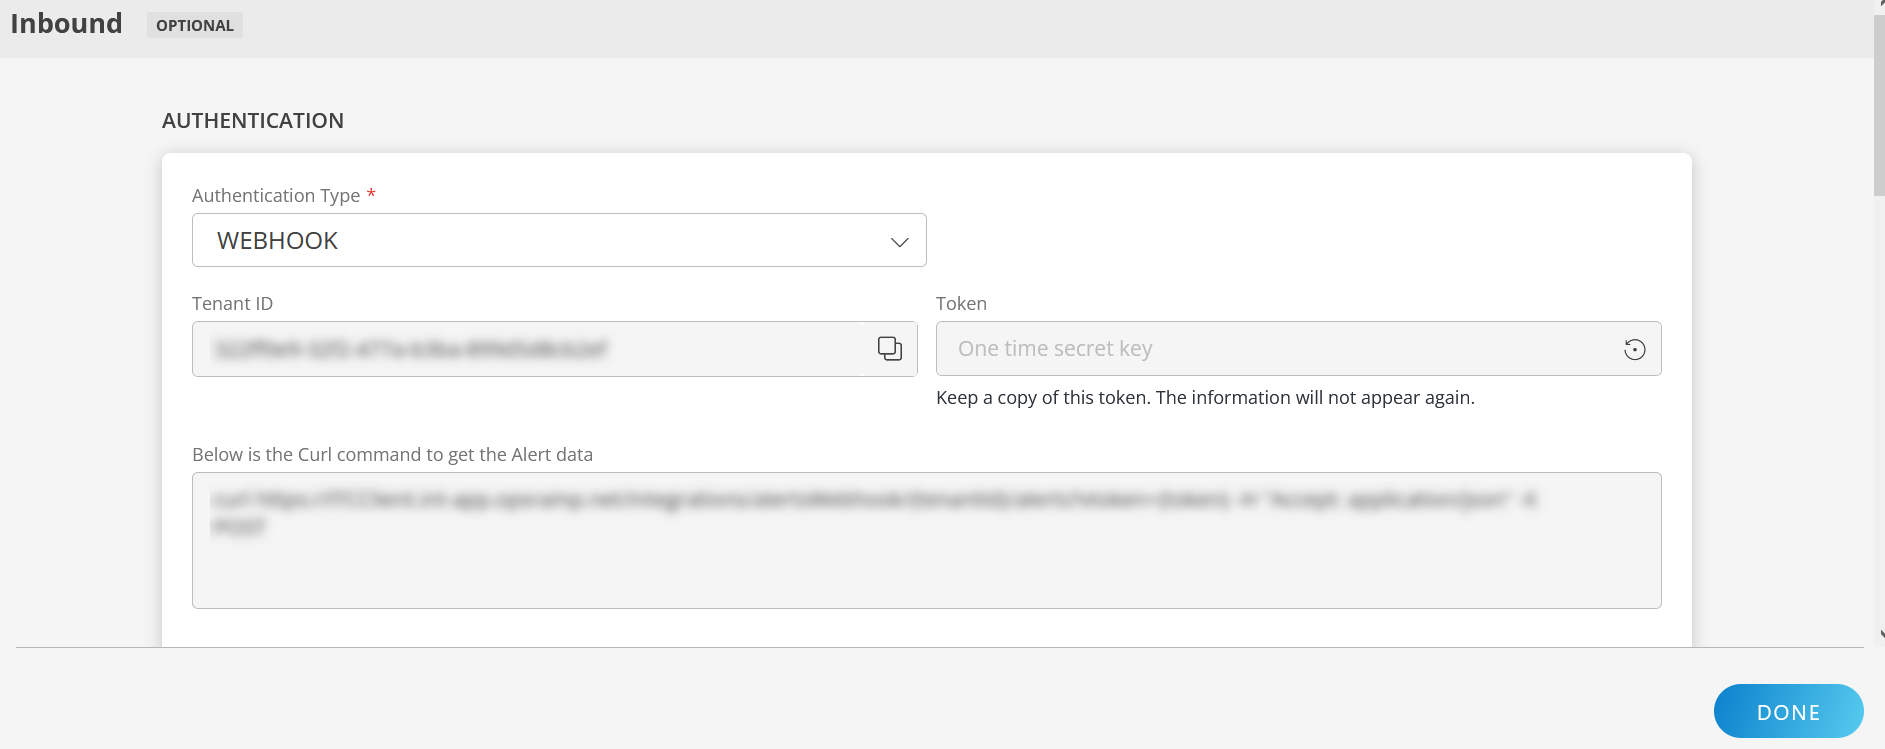
Authentication:
Select the Authentication Type as Webhook.
- Webhook: By default, Webhook is selected as the Authentication Type.
Make a note of Tenant ID, Token and Webhook URL.
These details are used while creating an HTTP Request template during Sysdig configuration.
- Webhook: By default, Webhook is selected as the Authentication Type.
Map Attributes: Map OpsRamp entity attributes with Sysdig attributes.
Click +Add from the Map Attributes section.
From the Add Map Attributes window, enter the below information:
- OpsRamp Entity: Select Alert from the dropdown.
- OpsRamp Property: Select the OpsRamp property from the dropdown.
- Sysdig Entity: Enter the Sysdig entity value in the box and click the +value from the dropdown to add it. You can add multiple values.
- Sysdig Property: Enter the Sysdig property.
Parsing Condition:
- Click +Add and provide the parsing condition:
- Select an operator from the dropdown and enter a value in the fields accordingly. Based on the operator selected, the fields vary.
- Click Save. Click +Add to add more conditions.
Property Values:
- Click +Property Value.
- Enter a value in the Sysdig Property Value box and select the appropriate value from the OpsRamp Property Value dropdown.
The options in the OpsRamp Property Value dropdown appear based on the OpsRamp Property selected. - Click Save.
- Click +Property Value to add more property values.
Default Value: Alternatively, you can enter/select a default value in the box.
Note: To map more attributes, click +Entity.
Click Add Map Attributes. The mapped attributes list is added.
- Click the three dots icon at the end of each row to edit or remove the map attributes.
- Use the Filter option to filter the map attributes.
Additional Settings: Select the Drop alerts from unmanaged resources checkbox if you do not want to trigger alerts from unmanaged resources.
Enrich and Create Alert: Select a process definition from the dropdown. You can customize the incoming alerts according to the properties defined in the process definition.
Click Finish.
The following table shows the property mappings:
| Third-Party Entity | OpsRamp Entity | Third-Party Property | OpsRamp Property (non-editable) | ||||||
|---|---|---|---|---|---|---|---|---|---|
| Problem | Alert | State
| alert.currentState | ||||||
| Problem | Alert | alert.body
| alert.currentState | ||||||
| Problem | Alert | alert.description | alert.description | ||||||
| Problem | Alert | source | alert.deviceName | ||||||
| Problem | Alert | alert.id | alert.extAlertId | ||||||
| Problem | Alert | alert.subject | alert.subject |
- You can modify the attributes when required.
- You need not follow the same mappings.
Sysdig configuration
Step 1: Add notification channel
- Log into the Sysdig Admin UI.
- Go to Notification Channels > Add Notification Channel.
- From the displayed list, click Webhook.
- From New WebHook Channel, enter:
- URL: WebHook URL copied from the OpsRamp configuration.
- Channel Name:
- Enable the following options as needed and click Save:
- Enabled
- Notify when Resolved
- Notify when Acknowledged
- Test notification
Step 2: Configure alerts
- Go to Alerts > Add Alert and select Alert Type.
- From the New Metric Alert wizard, enter the following on the Define tab:
- Alert description
- Alert severity
- Alert properties. If a single alert is selected from the drop-down list, then only a single alert is triggered. To trigger multiple alerts, select Multiple Alerts.
- On the Notify tab, enable the following and click Create.
- Notification Channel (this channel was created in the previous step).
- Additional options as required. If alerts are already created, enable the newly created notification channel by navigating to Notify and clicking on the alert.
Example payload
{
"timestamp": 1587031500000000,
"timespan": 300000000,
"alert": {
"severity": 4,
"severityLevel": 4,
"editUrl": "https://app.sysdigcloud.com/#/alerts/1763784",
"severityLabel": "Low",
"subject": "Filesystem device full warning is Triggered on host.mac = 56:34:fb:9c:dd:5d and fs.mountDir = /",
"scope": null,
"name": "Filesystem device full warning",
"description": "Filesystem device full warning",
"id": 1763784,
"body": "Event Generated:Severity: Low Metric: fs.used.percent = 14.2 %Segment: fs.mountDir = '/' and host.mac = '56:34:fb:9c:dd:5d'Scope: EverywhereTime: 04/16/2020 10:05 AM UTCState: TriggeredNotification URL: <https://app.sysdigcloud.com/#/events/notifications/l:2419200/44753390/details------Triggered> by Alert:Name: Filesystem device full warningDescription: Filesystem device full warningTeam: Monitor OperationsScope: EverywhereSegment by: host.mac, fs.mountDirWhen: avg(avg(fs.used.percent)) > 5For at least: 5 minAlert URL: <https://app.sysdigcloud.com/#/alerts/1763784>"
},
"event": {
"id": 44753390,
"url": "https://app.sysdigcloud.com/#/events/notifications/l:604800/44753390/details"
},
"state": "ACTIVE",
"resolved": false,
"entities": [{
"entity": "host.mac = '56:34:fb:9c:dd:5d'",
"metricValues": [{
"metric": "fs.used.percent",
"aggregation": "avg",
"groupAggregation": "avg",
"value": 14.186205200000002
}],
"moreInfo": [{
"metric": "host.hostName",
"value": "zabbix"
}]
}],
"condition": "avg(avg(fs.used.percent)) > 5",
"source": "Sysdig Cloud"
}
Viewing alerts
- Go to the Alerts page, search with the source name as
Sisdig.
Related alerts are displayed. - Click Alert ID to view.