Prerequisites
- A Device/VM configured with Prometheus server.
Recommended Prometheus Remote-Write Configuration tuning:
| Configuration Parameter | Description |
|---|---|
| capacity | How many samples are queued in memory per shard before blocking reading from the WAL. When the WAL is blocked, samples cannot be appended to any shards and all throughput ceases. |
| max_shards | The maximum number of shards, or parallelism, Prometheus uses for each remote write queue. |
| min_shards | The minimum number of shards used by Prometheus, which is the number of shards used when remote write starts. |
| max_samples_per_send | The maximum number of samples sent per batch, which can be adjusted depending on the back end in use. |
| batch_send_deadline | The maximum time interval between sends for a single shard, in seconds. |
| min_backoff | The minimum time to wait before retrying a failed request, in seconds. |
| max_backoff | The maximum time to wait before retrying a failed request, in seconds. |
See: https://prometheus.io/docs/practices/remote_write/
Prometheus handles most of the above configurations dynamically based on the responsiveness of OpsRamp Agent, so it is best to leave them at their default values. If that does not work, the values can be altered based on the above descriptions.
Constraints
The number of active series per metric per client is 50000. You can avoid the limit by configuring Prometheus to filter metrics. For example, use the following configuration to limit apiserver_request_duration_seconds_bucket, and etcd_request_duration_seconds_bucket metrics:
remoteWrite:
  - url: http://localhost:20460/push
    write_relabel_configs:
    - action: drop
      regex: apiserver_request_duration_seconds_bucket
      sourceLabels:
      - __name__
    - action: drop
      regex: etcd_request_duration_seconds_bucket
      sourceLabels:
      - __name__
Add a Prometheus integration and agent
Add an integration
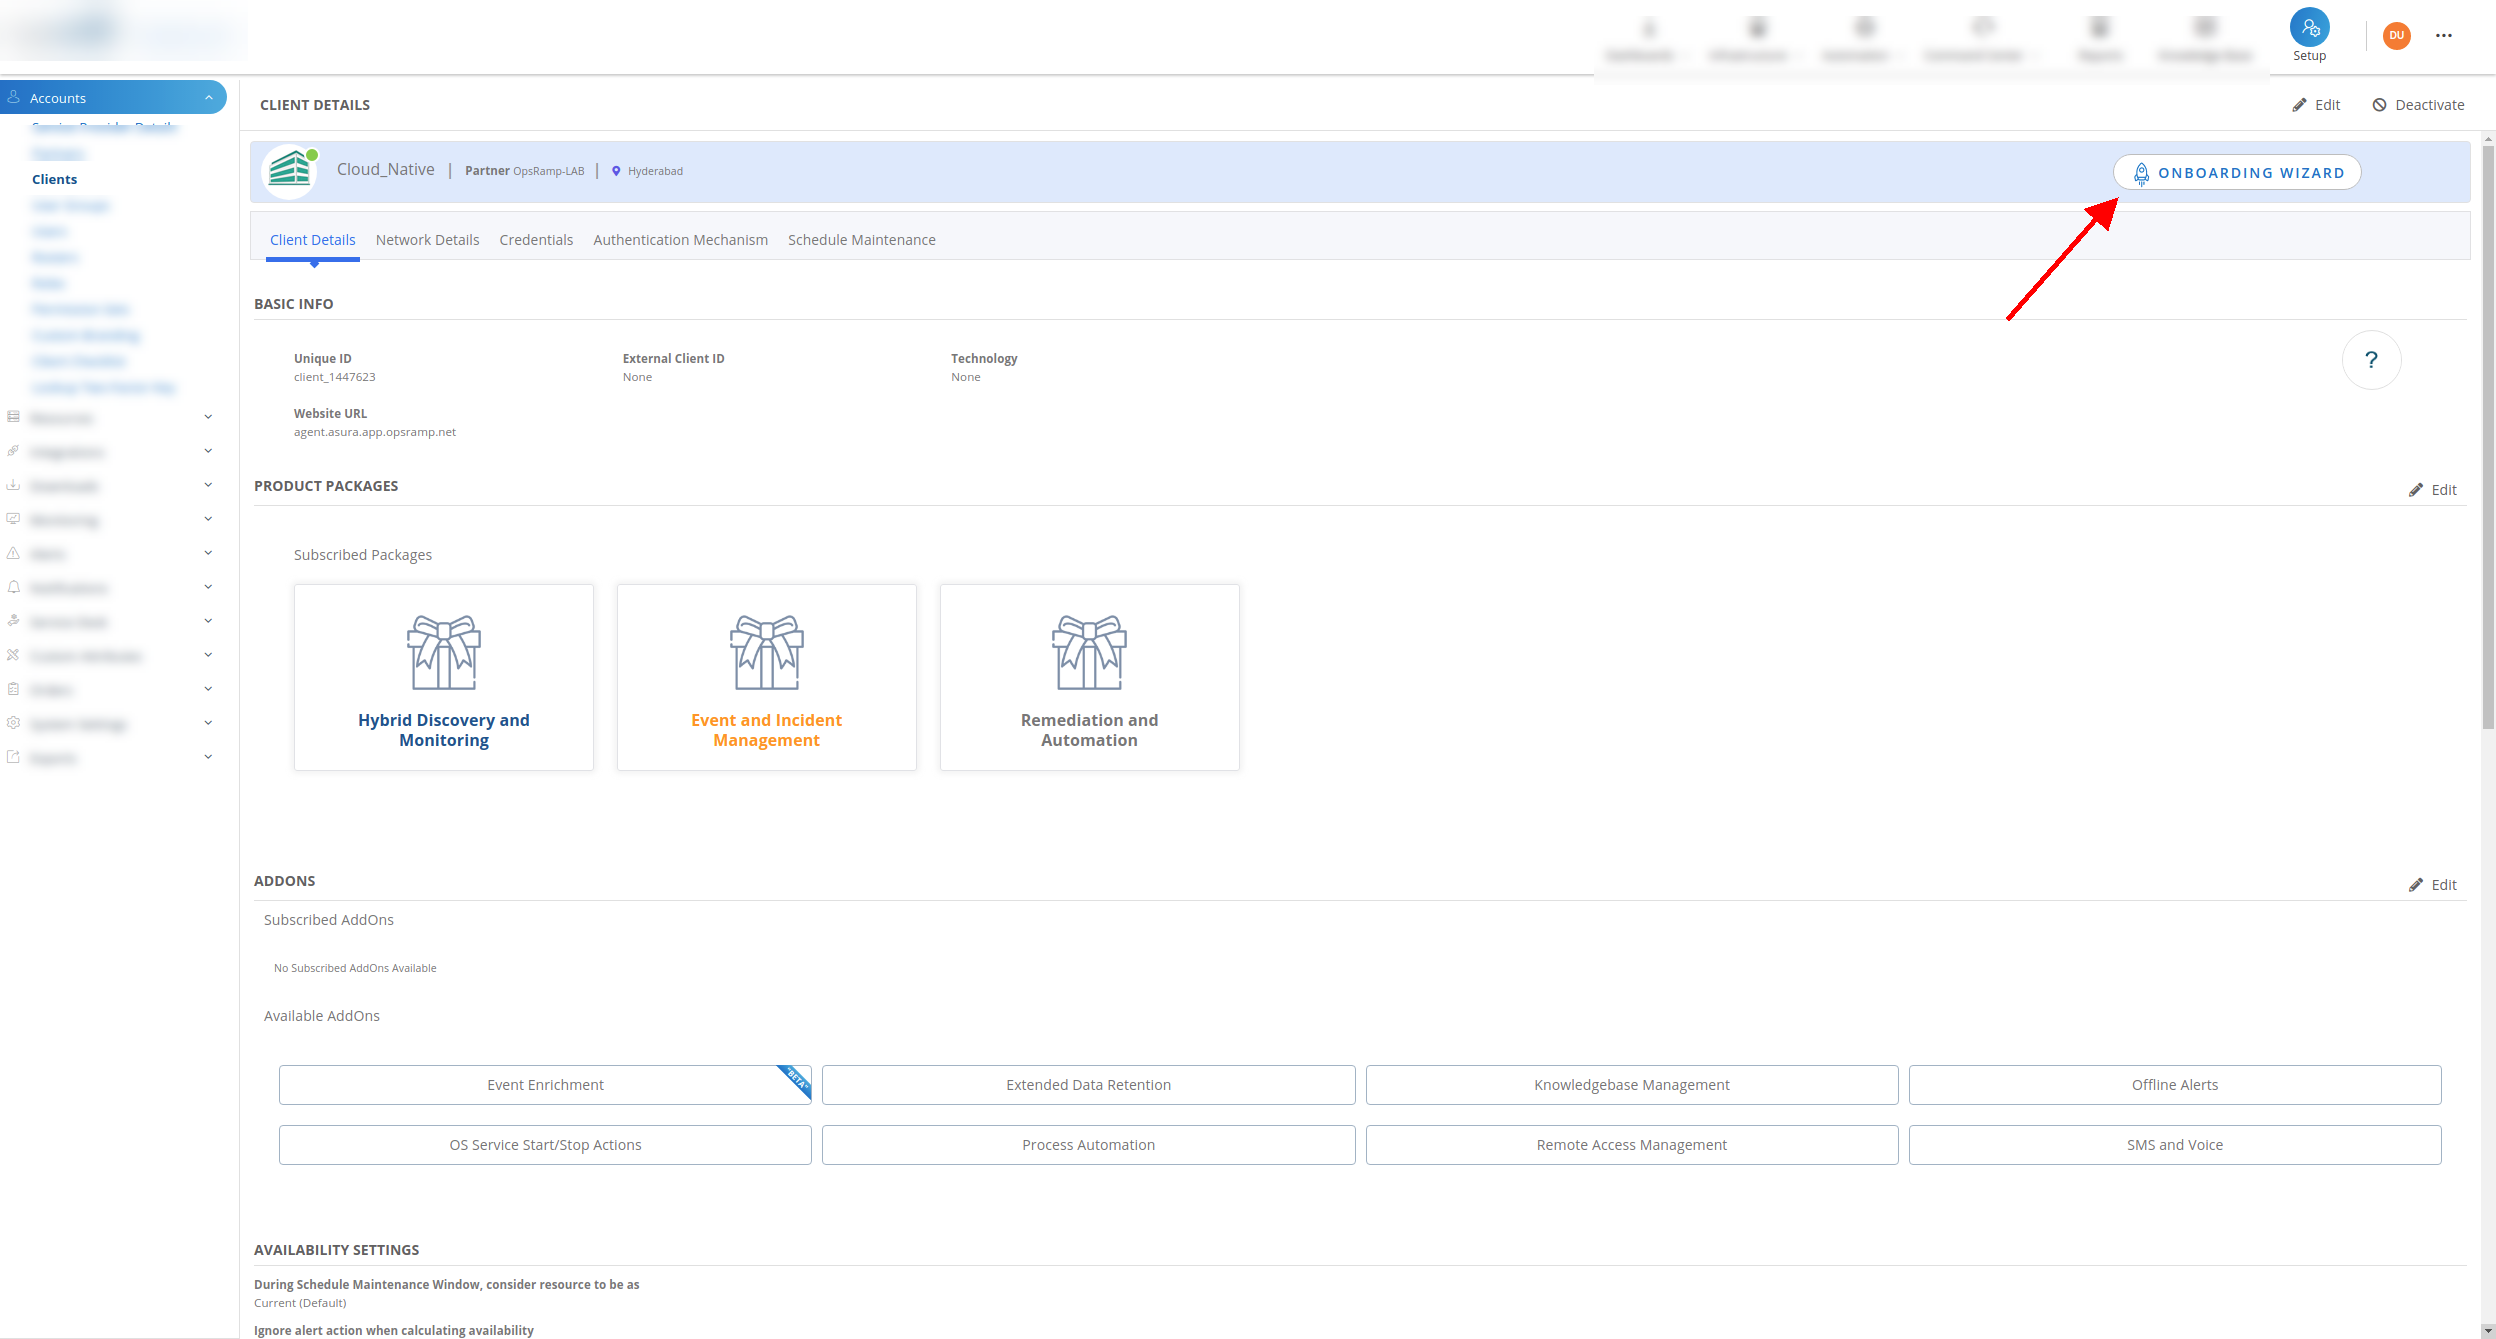
Click Setup > Accounts > Clients.
Choose the client in the Client Name column for which you want to onboard a Prometheus integration.
Click ONBOARDING WIZARD.
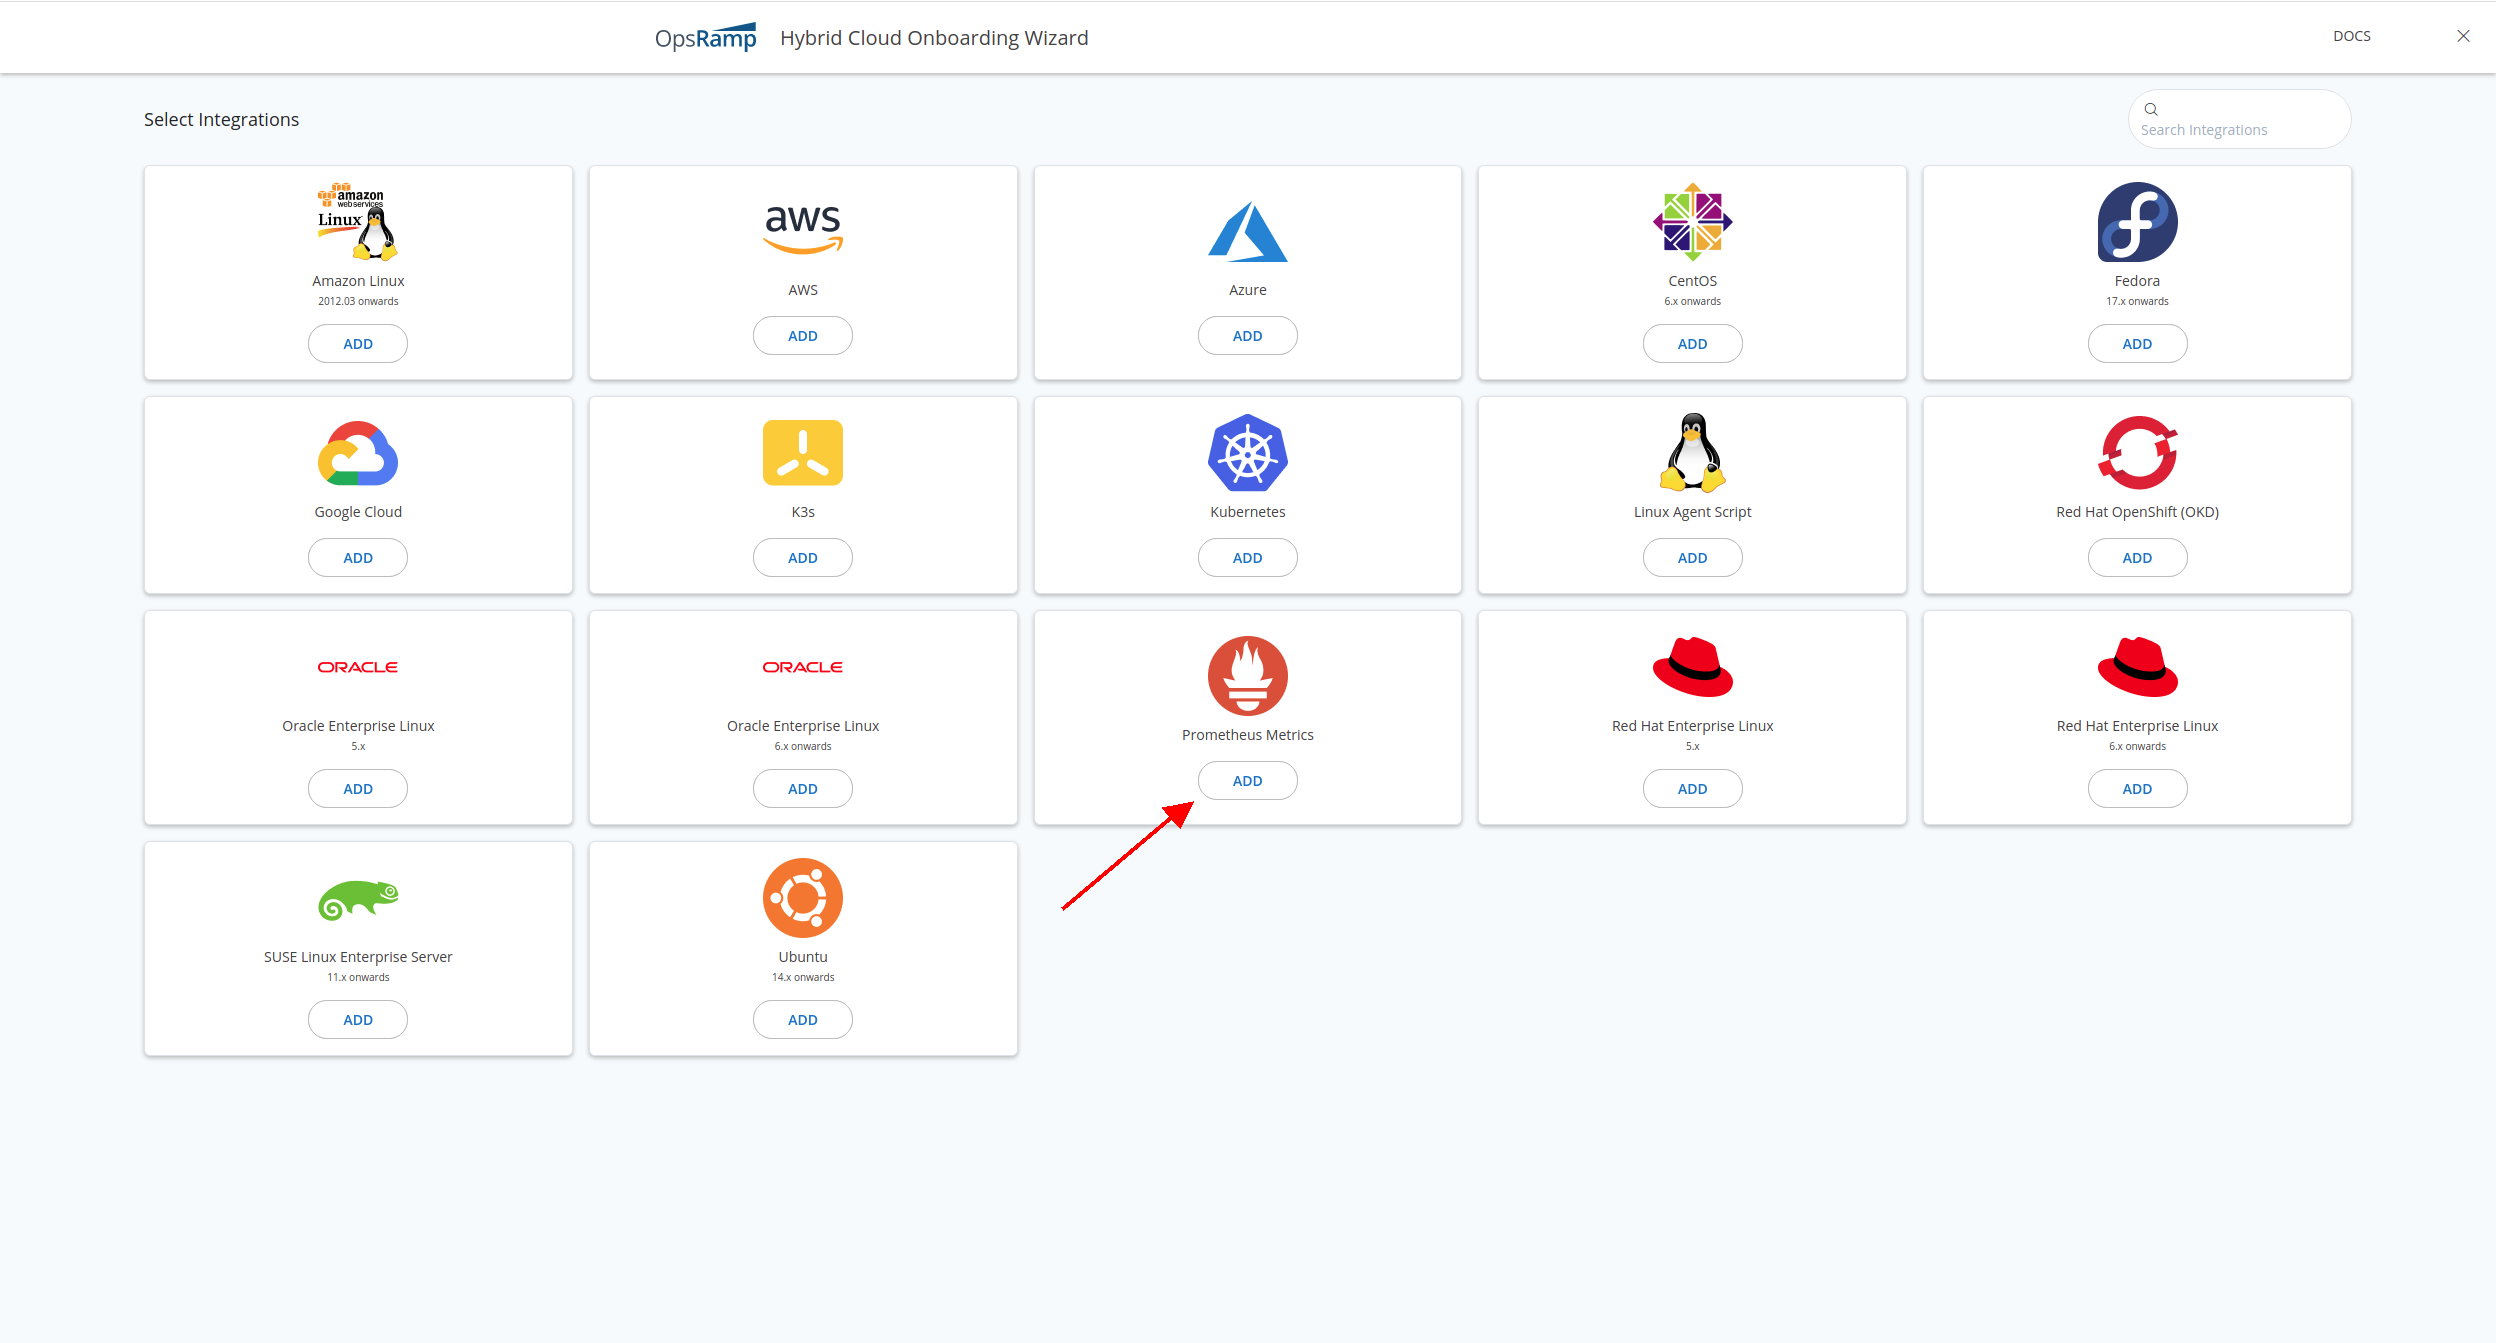
On the Prometheus metrics tile, click ADD.
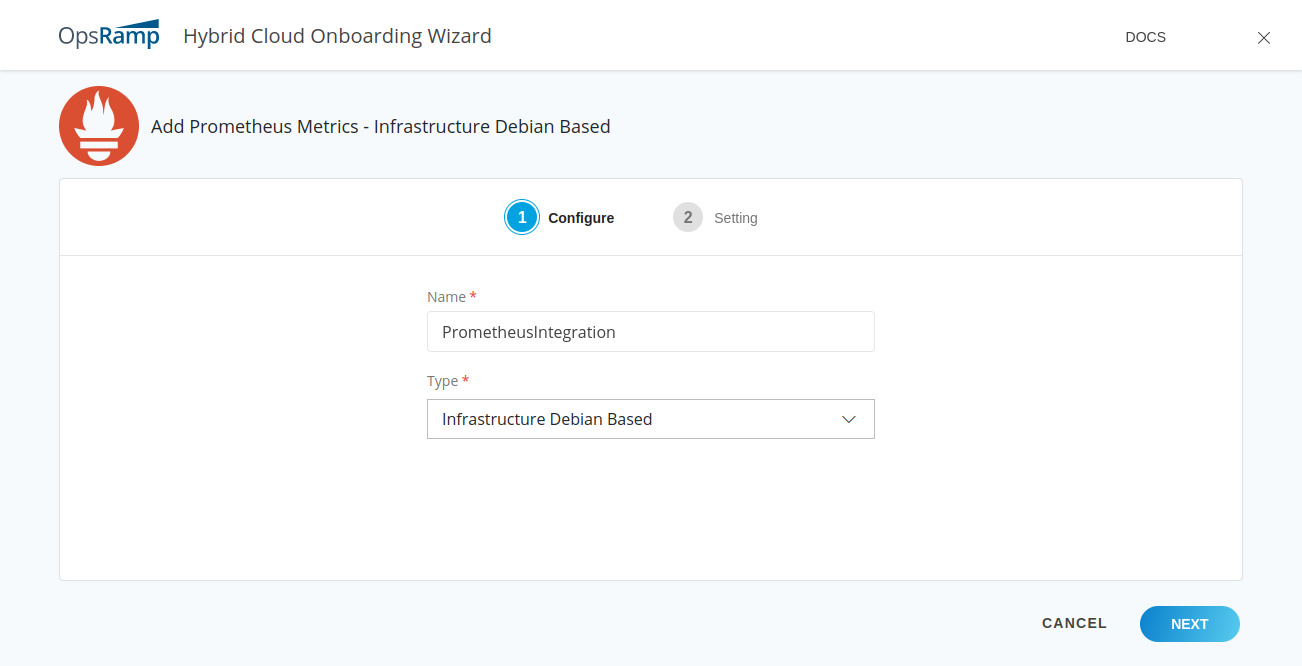
Enter a Name for your Prometheus integration.
Note
The name must contain only lower case alphanumeric characters or dash (-) and start and end with an alphanumeric character. For example,my-nameor123-abc.Choose Type as Infrastructure Debian Based or Infrastructure RPM Based and click Next.
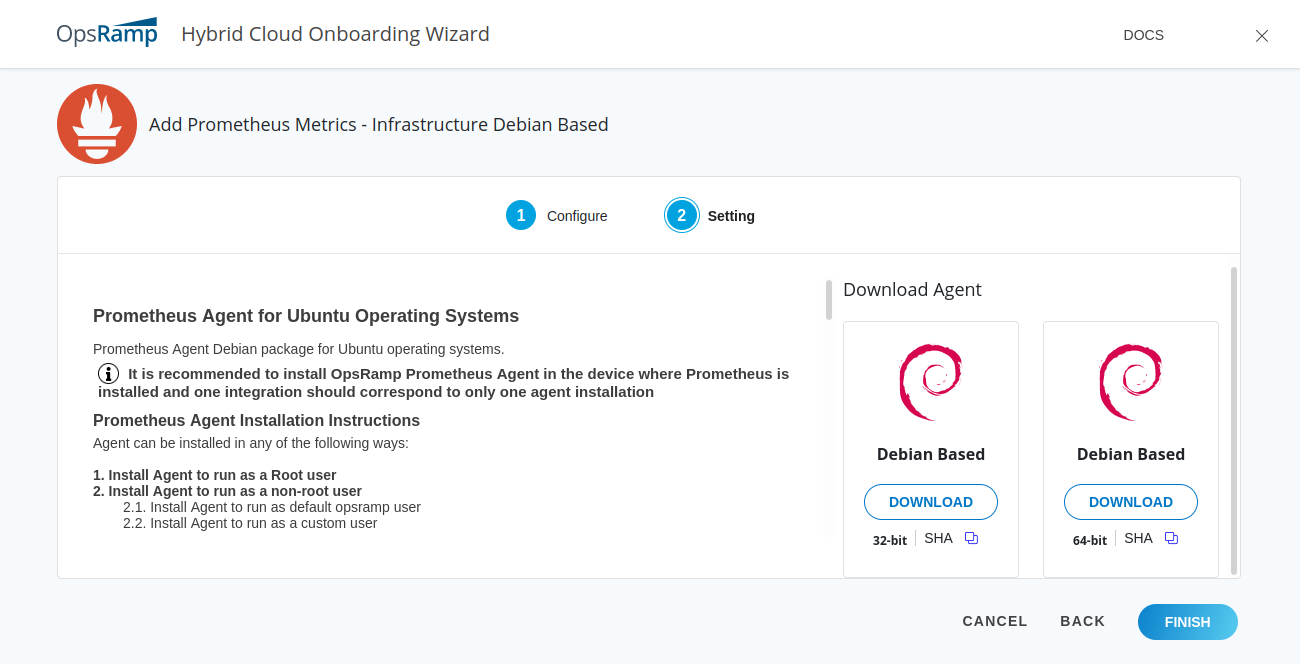
You will be given a set of instructions to download and install OpsRamp Prometheus Agent and also to configure Prometheus to communicate with the OpsRamp Prom-Agent. Follow the instructions to complete the deployment.
Connect Prometheus agents behind a proxy
To connect OpsRamp Prometheus agent using Proxy, set the following environment variables while deploying the agent:
sudo /opt/opsramp/prom-agent/bin/configure -K {client_key} -S {client_secret} -s {api endpoint} -c {client unique ID} -I {integration uuid} -m proxy -x {proxy_server} -p {proxy_port}If the proxy server needs authentication, set the following credentials:
sudo /opt/opsramp/prom-agent/bin/configure -K {client_key} -S {client_secret} -s {api endpoint} -c {client unique ID} -I {integration uuid} -m proxy -x {proxy_server} -p {proxy_port} -U {proxy_username} -P {proxy_password} -t {proxy_protocol}Set the Prometheus configuration parameters as shown in the following examples:
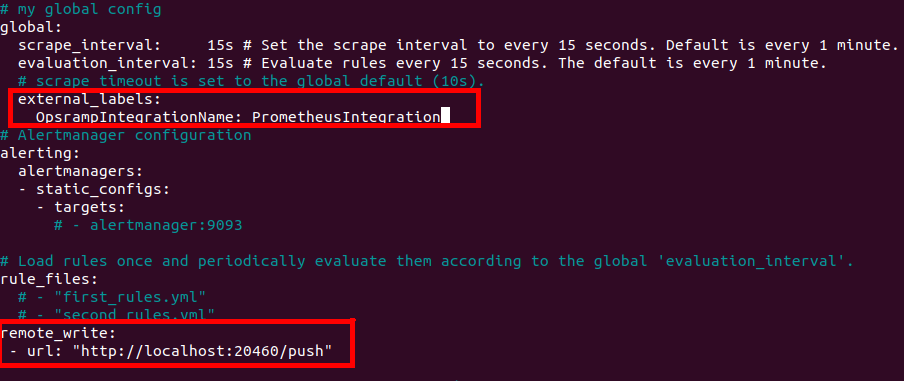
externalLabels:
  OpsRampIntegrationName: PrometheusIntegration1
remoteWrite:
- url: http://localhost:20460/pushConfiguration examples to filter metrics pushed to remote write
Prometheus can be configured to filter the metrics to be pushed to a remote endpoint like the agent. See the Prometheus configuration remote_write property documentation for more information.
Drop samples example
The following writeRelabelConfigs configuration drops samples with a metric name that starts with go:
remoteWrite:
- url: http://localhost:20460/push
write_relabel_configs:
- source_labels: [__name__]
regex: 'go_.*'
action: dropKeep samples example
The following writeRelabelConfigs configuration keeps samples with a metric name that starts with go:
remoteWrite:
- url: http://localhost:20460/push
  write_relabel_configs:
  - source_labels: [__name__]
    regex: 'go_.*'
    action: keep
Replace samples example
You can also change a label using the replace action before pushing it to a remote endpoint. The following example replaces samples with a metric name that starts with go with the name sample_go_label:
remoteWrite:
- url: http://localhost:20460/push
  write_relabel_configs:
  - source_labels: [__name__]
    regex: 'go_.*'
    action: replace
    target_labels: sample_go_label
Set up multiple Prometheus agents
The following are the valid use cases for multiple Prometheus setups:
Single integration deployed across multiple VM/Device(s)
Create a single Prometheus integration and deploy the same agent package provided in the Prometheus Integration across multiple VM/Device(s).
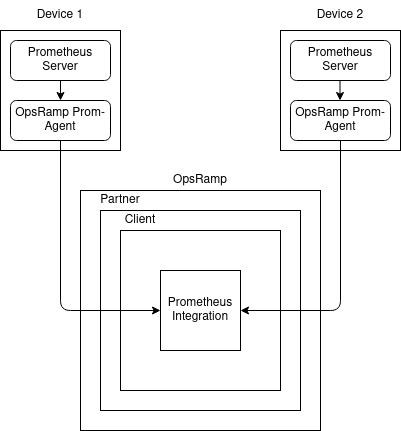
Prometheus integration use case 1
To differentiate between the clusters and identify the source of the metrics, add another external label.
Different integration for each cluster
Create a Prometheus Integration for each device which has a Prometheus Server.
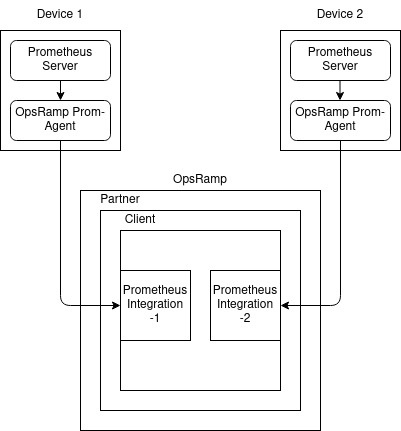
Prometheus integration use case 2
Use the OpsRampIntegrationName label to associate the metrics with the integration.
View and monitoring health status
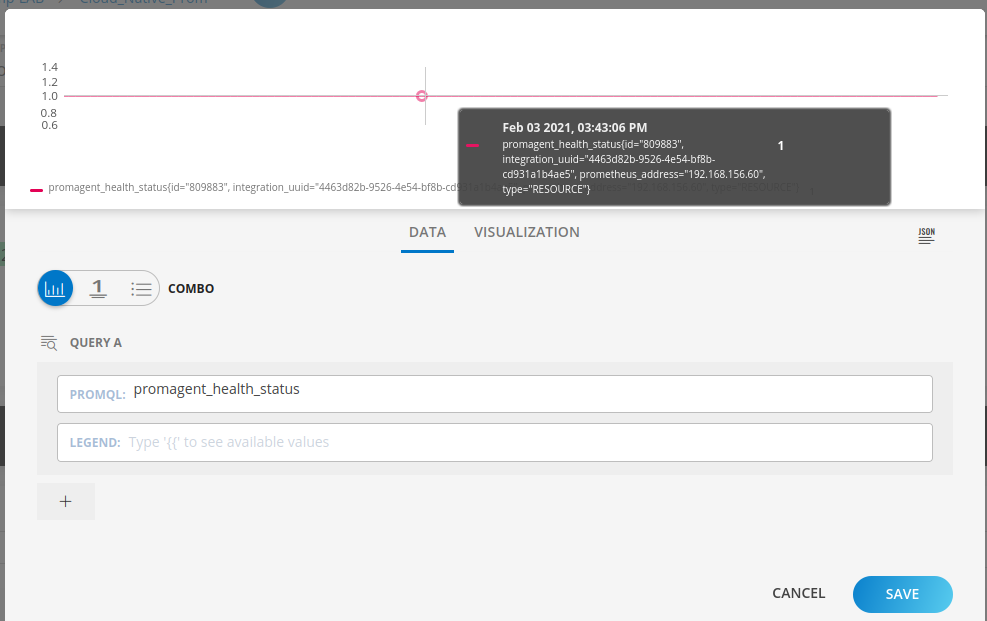
The agent is self-monitoring and pushes its health status to the cloud as the promagent_health_status metric. Health is reported periodically at default five-minute intervals. You can view health status metric data on the resource details page on the Infrastructure and My Dashboards pages. To view in the dashboard, mouse over Dashboards and choose Dashboard 2.0.
The promagent_health_status metric includes id, integration_uuid, and prometheus_address labels.
| Metric Label | Description |
|---|---|
id | OpsRamp Resource ID. |
integration_uuid | Integration Resource UUID is available against INTEGRATION_RES_UUID field in prom-agent yaml or Prometheus Metrics Integration page in Installed Integrations Page. |
prometheus_address | IP Address of prometheus. |
Checking Prom-Agent Health Status Metric Data in Dashboard:
You can define an alert on the agent health status metric by navigating to SetUp > Account > Alert Definitions. Create an Alert Definition Policy on the promagent_health_status metric and define the policy using agent health status metric labels.