Datadog is a monitoring service for cloud-scale applications, providing monitoring of servers, databases, tools, and services, through a SaaS-based data analytics platform.
When an event is triggered in Datadog, an alert is created. The information of the Datadog event is carried over.
OpsRamp configuration
Step 1: Install the integration
- From All Clients, select a client.
- Navigate to Setup > Account.
- Select the Integrations and Apps tile.
- The Installed Integrations page, where all the installed applications are displayed. Note: If there are no installed applications, it will navigate to the Available Integrations and Apps page.
- Click +ADD on the Installed Integrations page. The Available Integrations and Apps page displays all the available applications.
- Search for the application using the search option available. Alternatively, use the All Categories option to search.
- Click ADD on the Datadog tile.
Inbound (Optional):
To configure the inbound, follow these steps:
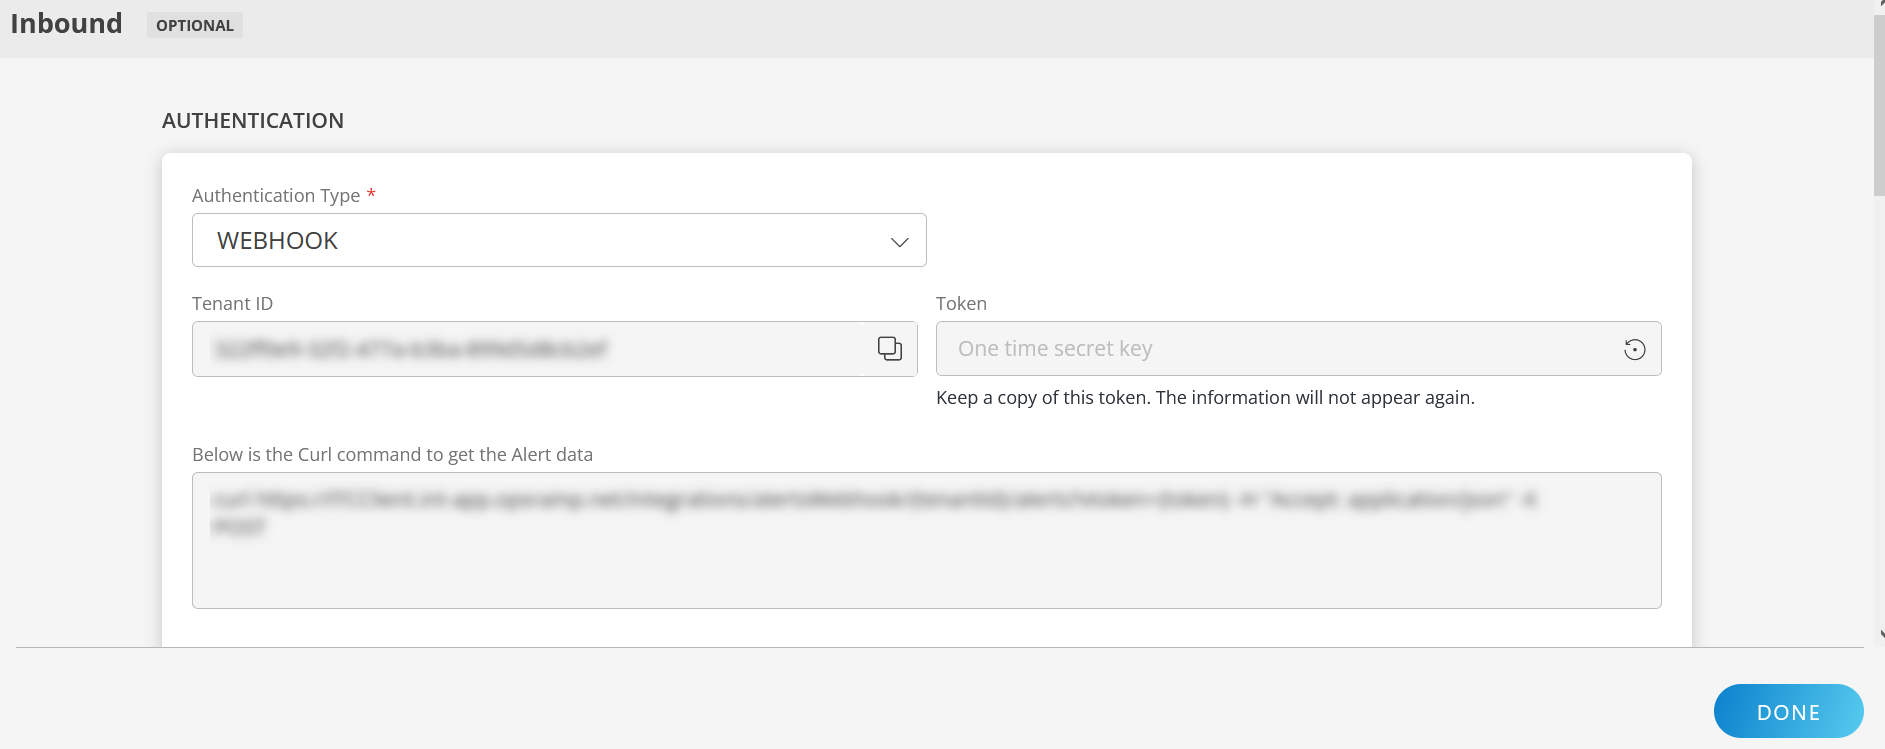
Authentication:
Select the Authentication Type as Webhook.
- Webhook: By default, Webhook is selected as the Authentication Type.
Make a note of Tenant ID, Token and Webhook URL.
These details are used while creating an HTTP Request template during Datadog configuration.
- Webhook: By default, Webhook is selected as the Authentication Type.
Map Attributes: Map OpsRamp entity attributes with Datadog attributes.
Click +Add from the Map Attributes section.
From the Add Map Attributes window, enter the below information:
- OpsRamp Entity: Select Alert from the dropdown.
- OpsRamp Property: Select the OpsRamp property from the dropdown.
- Datadog Entity: Enter the Datadog entity value in the box and click the +value from the dropdown to add it. You can add multiple values.
- Datadog Property: Enter the Datadog property.
Parsing Condition:
- Click +Add and provide the parsing condition:
- Select an operator from the dropdown and enter a value in the fields accordingly. Based on the operator selected, the fields vary.
- Click Save. Click +Add to add more conditions.
Property Values:
- Click +Property Value.
- Enter a value in the Datadog Property Value box and select the appropriate value from the OpsRamp Property Value dropdown.
The options in the OpsRamp Property Value dropdown appear based on the OpsRamp Property selected. - Click Save.
- Click +Property Value to add more property values.
Default Value: Alternatively, you can enter/select a default value in the box.
Note: To map more attributes, click +Entity.
Click Add Map Attributes. The mapped attributes list is added.
- Click the three dots icon at the end of each row to edit or remove the map attributes.
- Use the Filter option to filter the map attributes.
Additional Settings: Select the Drop alerts from unmanaged resources checkbox if you do not want to trigger alerts from unmanaged resources.
Enrich and Create Alert: Select a process definition from the dropdown. You can customize the incoming alerts according to the properties defined in the process definition.
Click Finish.
Property mappings
| Datadog Property | OpsRamp Property | ||||||
|---|---|---|---|---|---|---|---|
| eventTitle | Alert subject | ||||||
| eventDetails | Alert description | ||||||
| date | Alert time | ||||||
| eventAlertType | Alert state
| ||||||
| eventAlertMetric | Alert metric | ||||||
| eventHostName | Alert resource name |
Example Datadog Webhook payload
{
"id":"7432940494797260344",
"eventTitle":"[P1] [Warn] [TEST] MacBook-Pro CPU load is high",
"eventType":"query_alert_monitor",
"evenAlertID":"385703",
"eventAlertType":"warning",
"eventHostName":"MacBook-Pro.local",
"eventAlertMetric":"system.load.1",
"eventAlertTitle":"[TEST] MacBook-Pro CPU load is high",
"date":"1707300643000",
"org":{
"id":"887913",
"name":"Intg Testing"
},
"eventDetails":{
"email":"",
"eventMsg":"\n@webhook-Alerts webhook-OpsRamp-Alerts\n\nTest notification triggered by james@gmail.com.\n\n[](https://us5.datadoghq.com/monitors/385703?from_ts=1707299743000&to_ts=1707300943000&source=monitor_notif)\n\n**system.load.1** over **host:MacBook-Pro.local** was **>= 2.0** on average during the **last 5m**.\n\nThe monitor was last triggered at Wed Feb 07 2024 10:10:43 UTC.\n\n- - -\n\n[[Monitor Status](https://us5.datadoghq.com/monitors/385703?from_ts=1707299743000&to_ts=1707300943000&source=monitor_notif)] \u00b7 [[Edit Monitor](https://us5.datadoghq.com/monitors/385703/edit?source=monitor_notif)] \u00b7 [[View MacBook-Pro.local](https://us5.datadoghq.com/infrastructure?filter=MacBook-Pro.local&source=monitor_notif)] \u00b7 [[Show Processes](https://us5.datadoghq.com/process?from_ts=1707300343000&to_ts=1707300763000&live=false&showSummaryGraphs=true&sort=cpu%2CDESC&query=host%3AMacBook-Pro.local&source=monitor_notif)]\n",
"eventTxtMsg":"\n@webhook-Alerts webhook-OpsRamp-Alerts\n\nTest notification triggered by james@gmail.com.\n\nsystem.load.1 over host:MacBook-Pro.local was >= 2.0 on average during the last 5m.\n\nMetric value: 0.0\n\nMetric Graph: https://us5.datadoghq.com/monitors/385703?from_ts=1707299743000&to_ts=1707300943000&source=monitor_notif \u00b7 Monitor Status: https://us5.datadoghq.com/monitors/385703?from_ts=1707299743000&to_ts=1707300943000&source=monitor_notif \u00b7 Edit Monitor: https://us5.datadoghq.com/monitors/385703/edit?source=monitor_notif \u00b7 View MacBook-Pro.local: https://us5.datadoghq.com/infrastructure?filter=MacBook-Pro.local&source=monitor_notif \u00b7 Show Processes: https://us5.datadoghq.com/process?from_ts=1707300343000&to_ts=1707300763000&live=false&showSummaryGraphs=true&sort=cpu%2CDESC&query=host%3AMacBook-Pro.local&source=monitor_notif \u00b7 Event URL: https://us5.datadoghq.com/event/event?id=7432940494797260344",
"eventAggregKey":"72d144246a83751965ad27c96c8a3362",
"eventAlertStatus":"system.load.1 over host:MacBook-Pro.local was >= 2.0 on average during the last 5m.",
"eventUserName":"",
"eventSnaoShot":"https://p.us5.datadoghq.com/snapshot/view/dd-snapshots-us5-prod/org_1300146780/2024-02-07/1c7553d2684e5e99a0e5d58ce5c160b2c0744ff3.png",
"eventLink":"https://us5.datadoghq.com/event/event?id=7432940494797260344",
"eventTags":"host:macbook-pro.local,monitor",
"eventAlertQuery":"avg(last_5m):avg:system.load.1{host:MacBook-Pro.local} >= 4",
"eventAlertScope":"",
"last_updated":"1707300643000"
}
} Datadog configuration
Step 1: Configure Webhook
Webhook allows you to connect with OpsRamp and alert OpsRamp when an event is triggered.
Log in to Datadog.
Click the Integrations icon and click Integrations.
Configure Webhook and click Update Configuration to save the details.
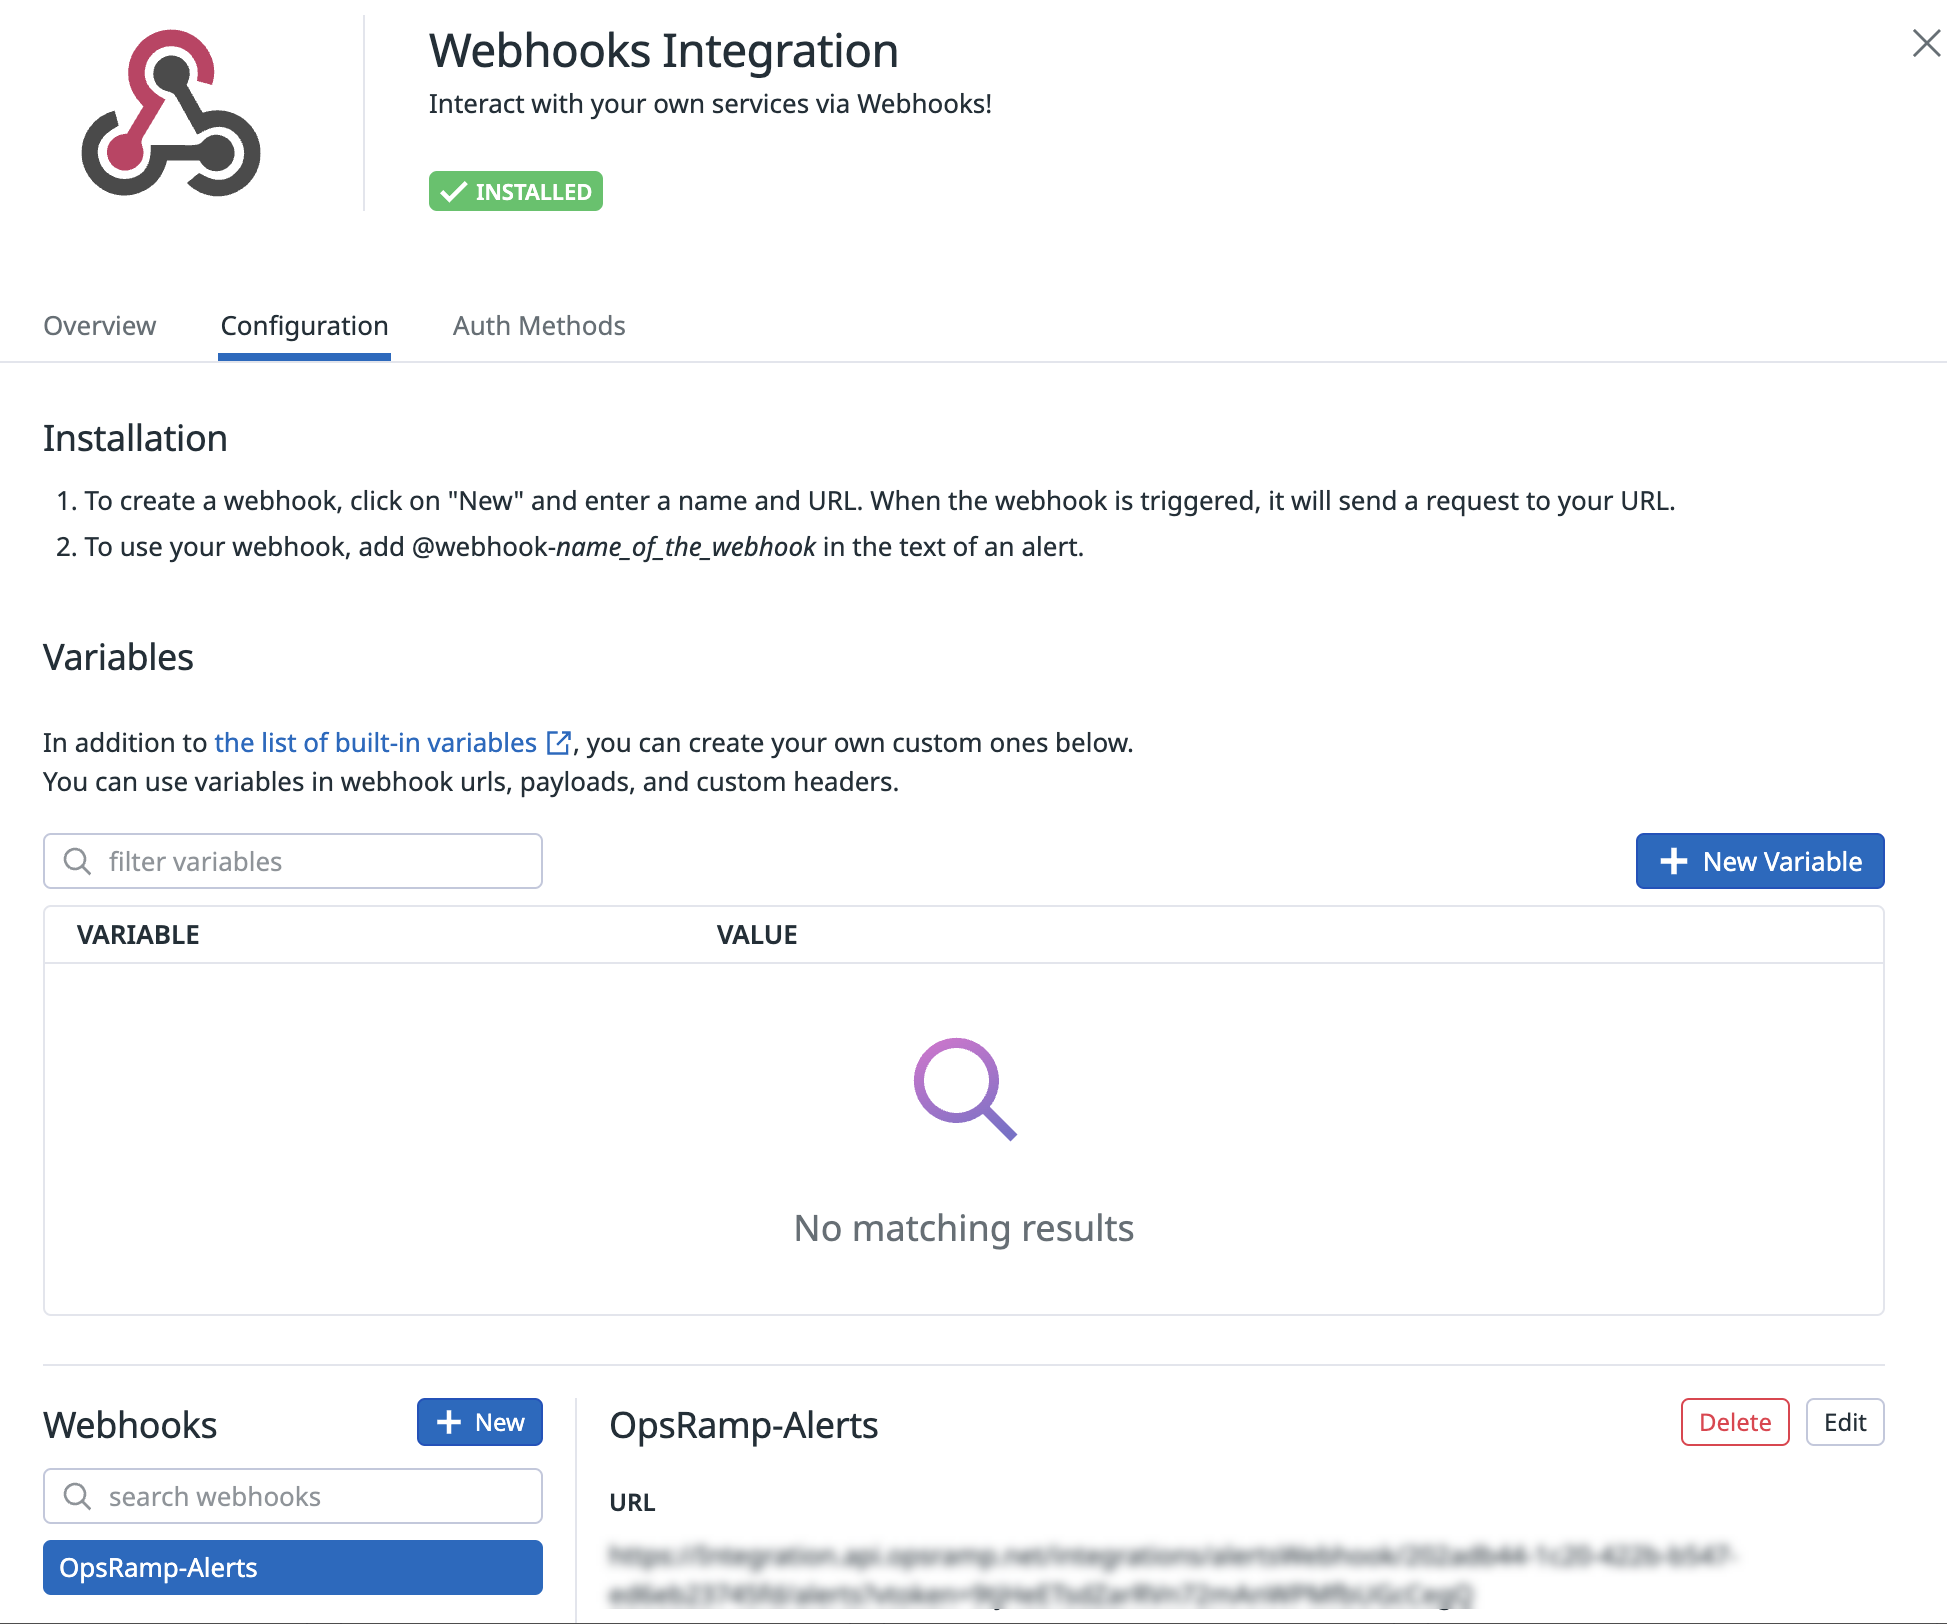
- Name: Enter a name for Webhook. For example, OpsRamp-Alerts.
- URL: Enter the Webhook URL copied from OpsRamp.
For example:https://<api-url>/integrations/alertsWebhook/client_1/alerts?vtoken=bOvr34Kh3Jm3eVJkmfBND7uJ9gyF72bL - Use custom payload: Select the custom payload option.
- Custom payload: Enter the below payload
- Encode as form: Not Applicable.
- Header: Not Applicable.
Note: You can configure the variables for the given payload.
Example:ORG_ID
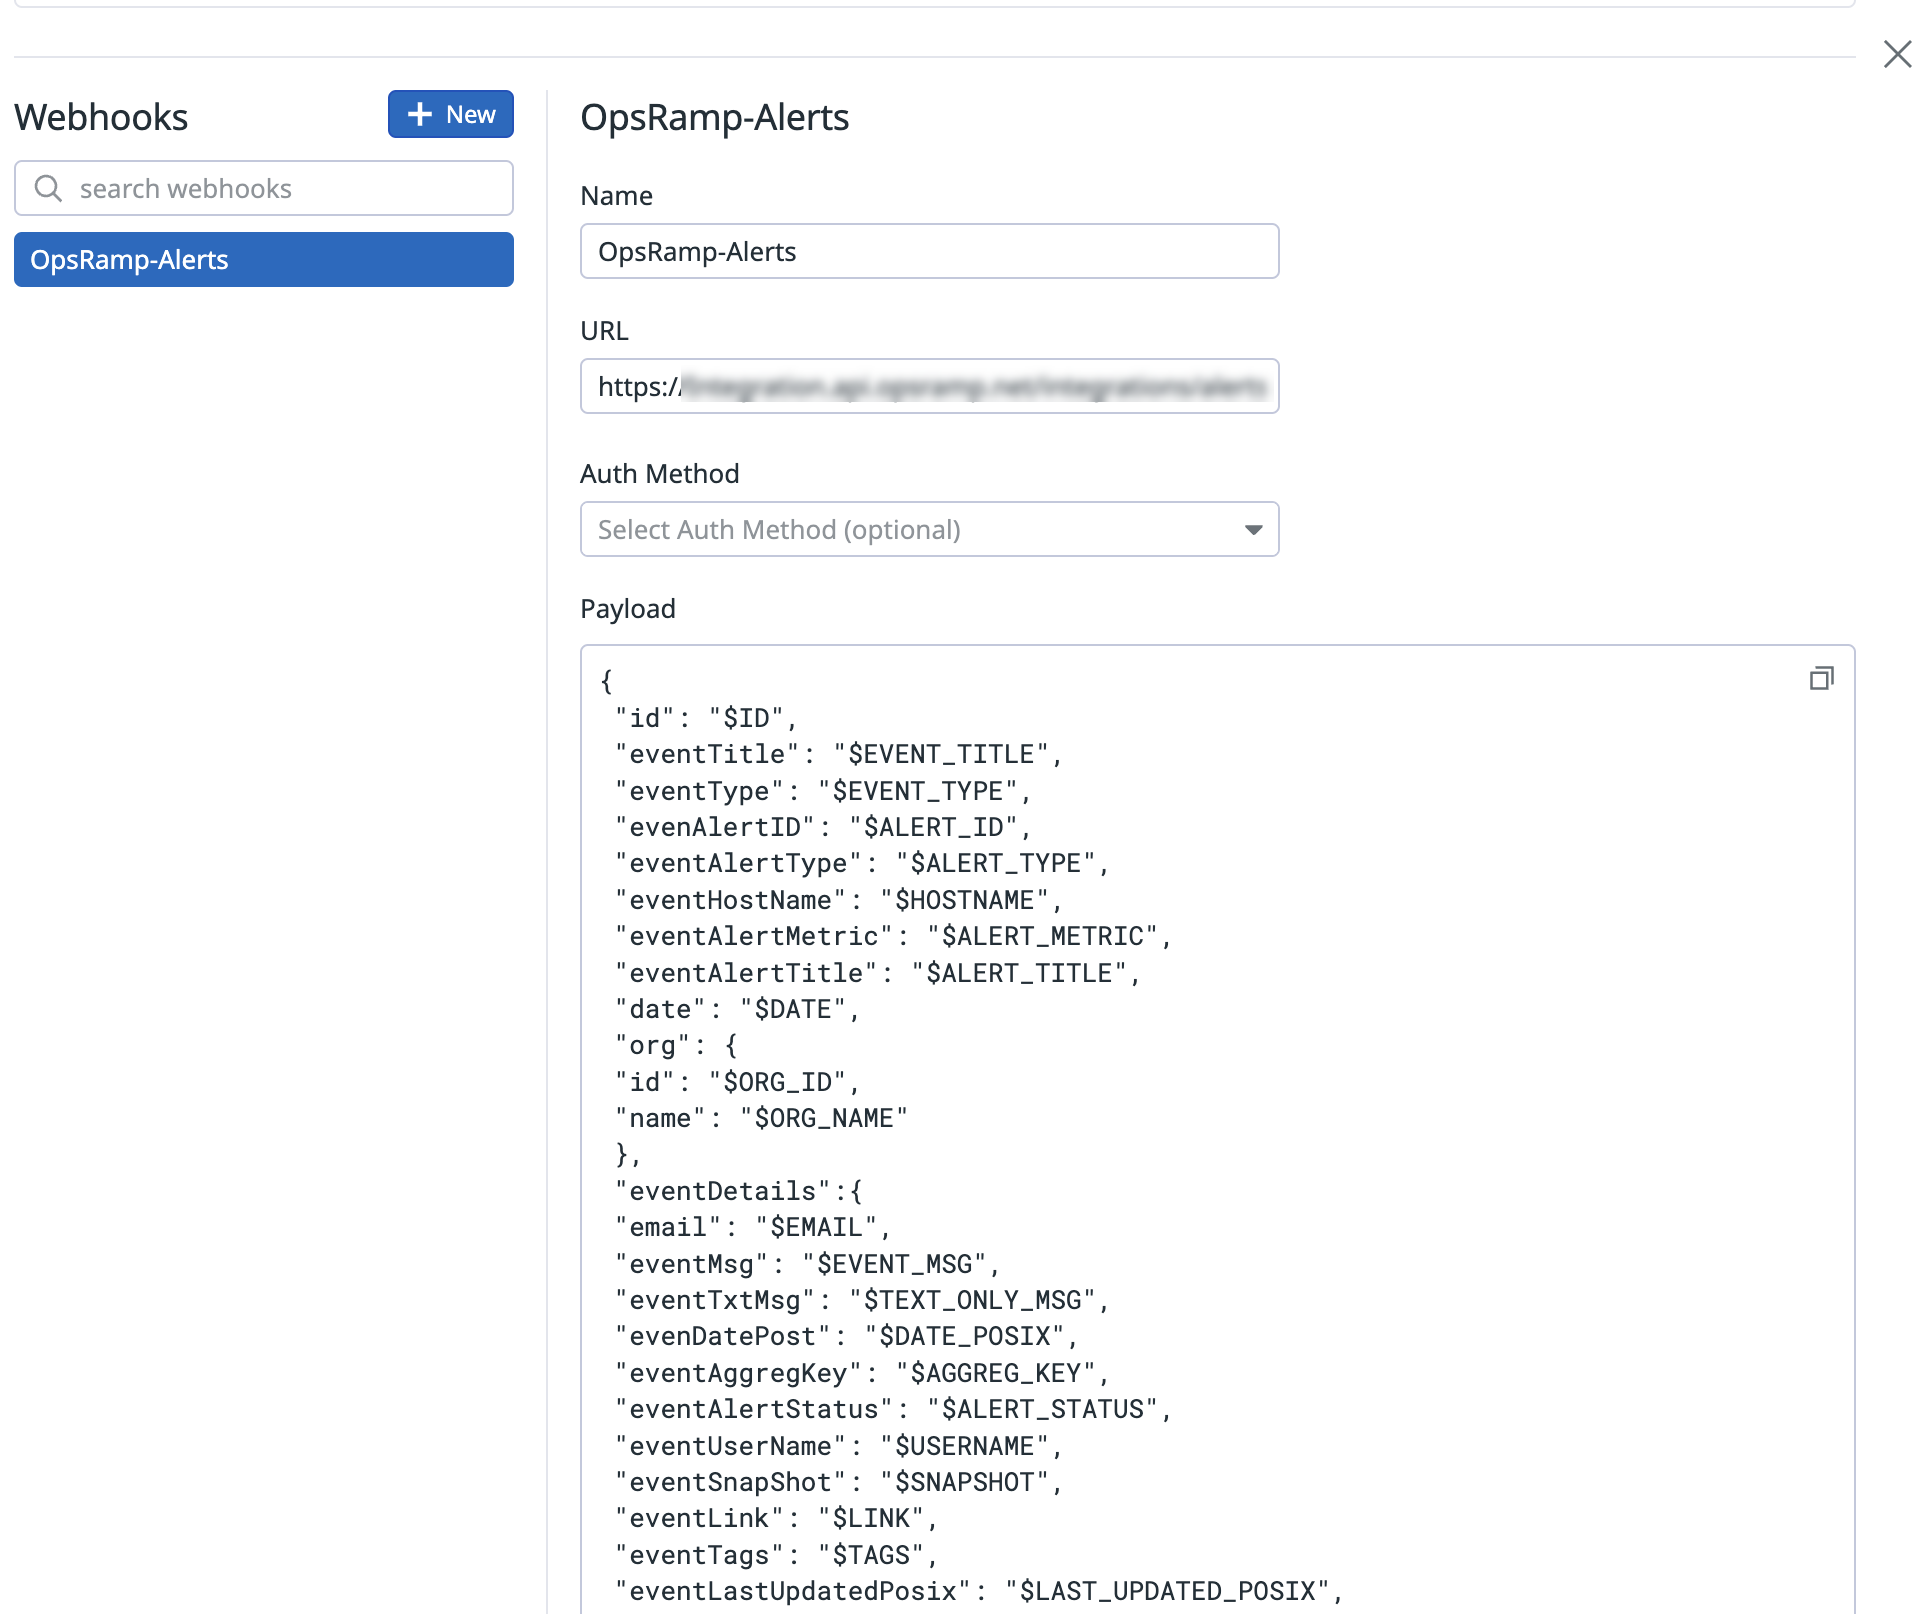
Custom payload syntax
{
    "id": "$ID",
    "eventTitle": "$EVENT_TITLE",
    "eventType": "$EVENT_TYPE",
    "evenAlertID": "$ALERT_ID",
    "eventAlertType": "$ALERT_TYPE",
    "eventHostName": "$HOSTNAME",
    "eventAlertMetric": "$ALERT_METRIC",
    "eventAlertTittle": "$ALERT_TITLE",
    "date": "$DATE",
    "org": {
        "id": "$ORG_ID",
        "name": "$ORG_NAME"
        },
    "eventDetails": {
        "email": "$EMAIL",
        "eventMsg": "$EVENT_MSG",
        "eventTxtMsg": "$TEXT_ONLY_MSG",
        "evenDatePost": "$DATE_POSIX",
        "eventAggregKey": "$AGGREG_KEY",
        "eventAlertStatys": "$ALERT_STATUS",
        "eventUserName": "$USERNAME",
        "eventSnaoShot": "$SNAPSHOT",
        "eventLink": "$LINK",
        "eventTags": "$TAGS",
        "eventLastUpdatedPosix": "$LAST_UPDATED_POSIX",
        "eventAlertQuery": "$ALERT_QUERY",
        "eventAlertScope": "$ALERT_SCOPE",
        "eventAlertCycleKey": "$ALERT_CYCLE_KEY",
        "last_updated": "$LAST_UPDATED"
        }
}
Step 2: Enable notifications
Notifications allow you to notify OpsRamp about an event.
- Click the Select Monitor icon and click Manage Monitors.
- Select the monitor that you want to enable the integration to OpsRamp and edit the settings. Configure the monitor details accordingly.
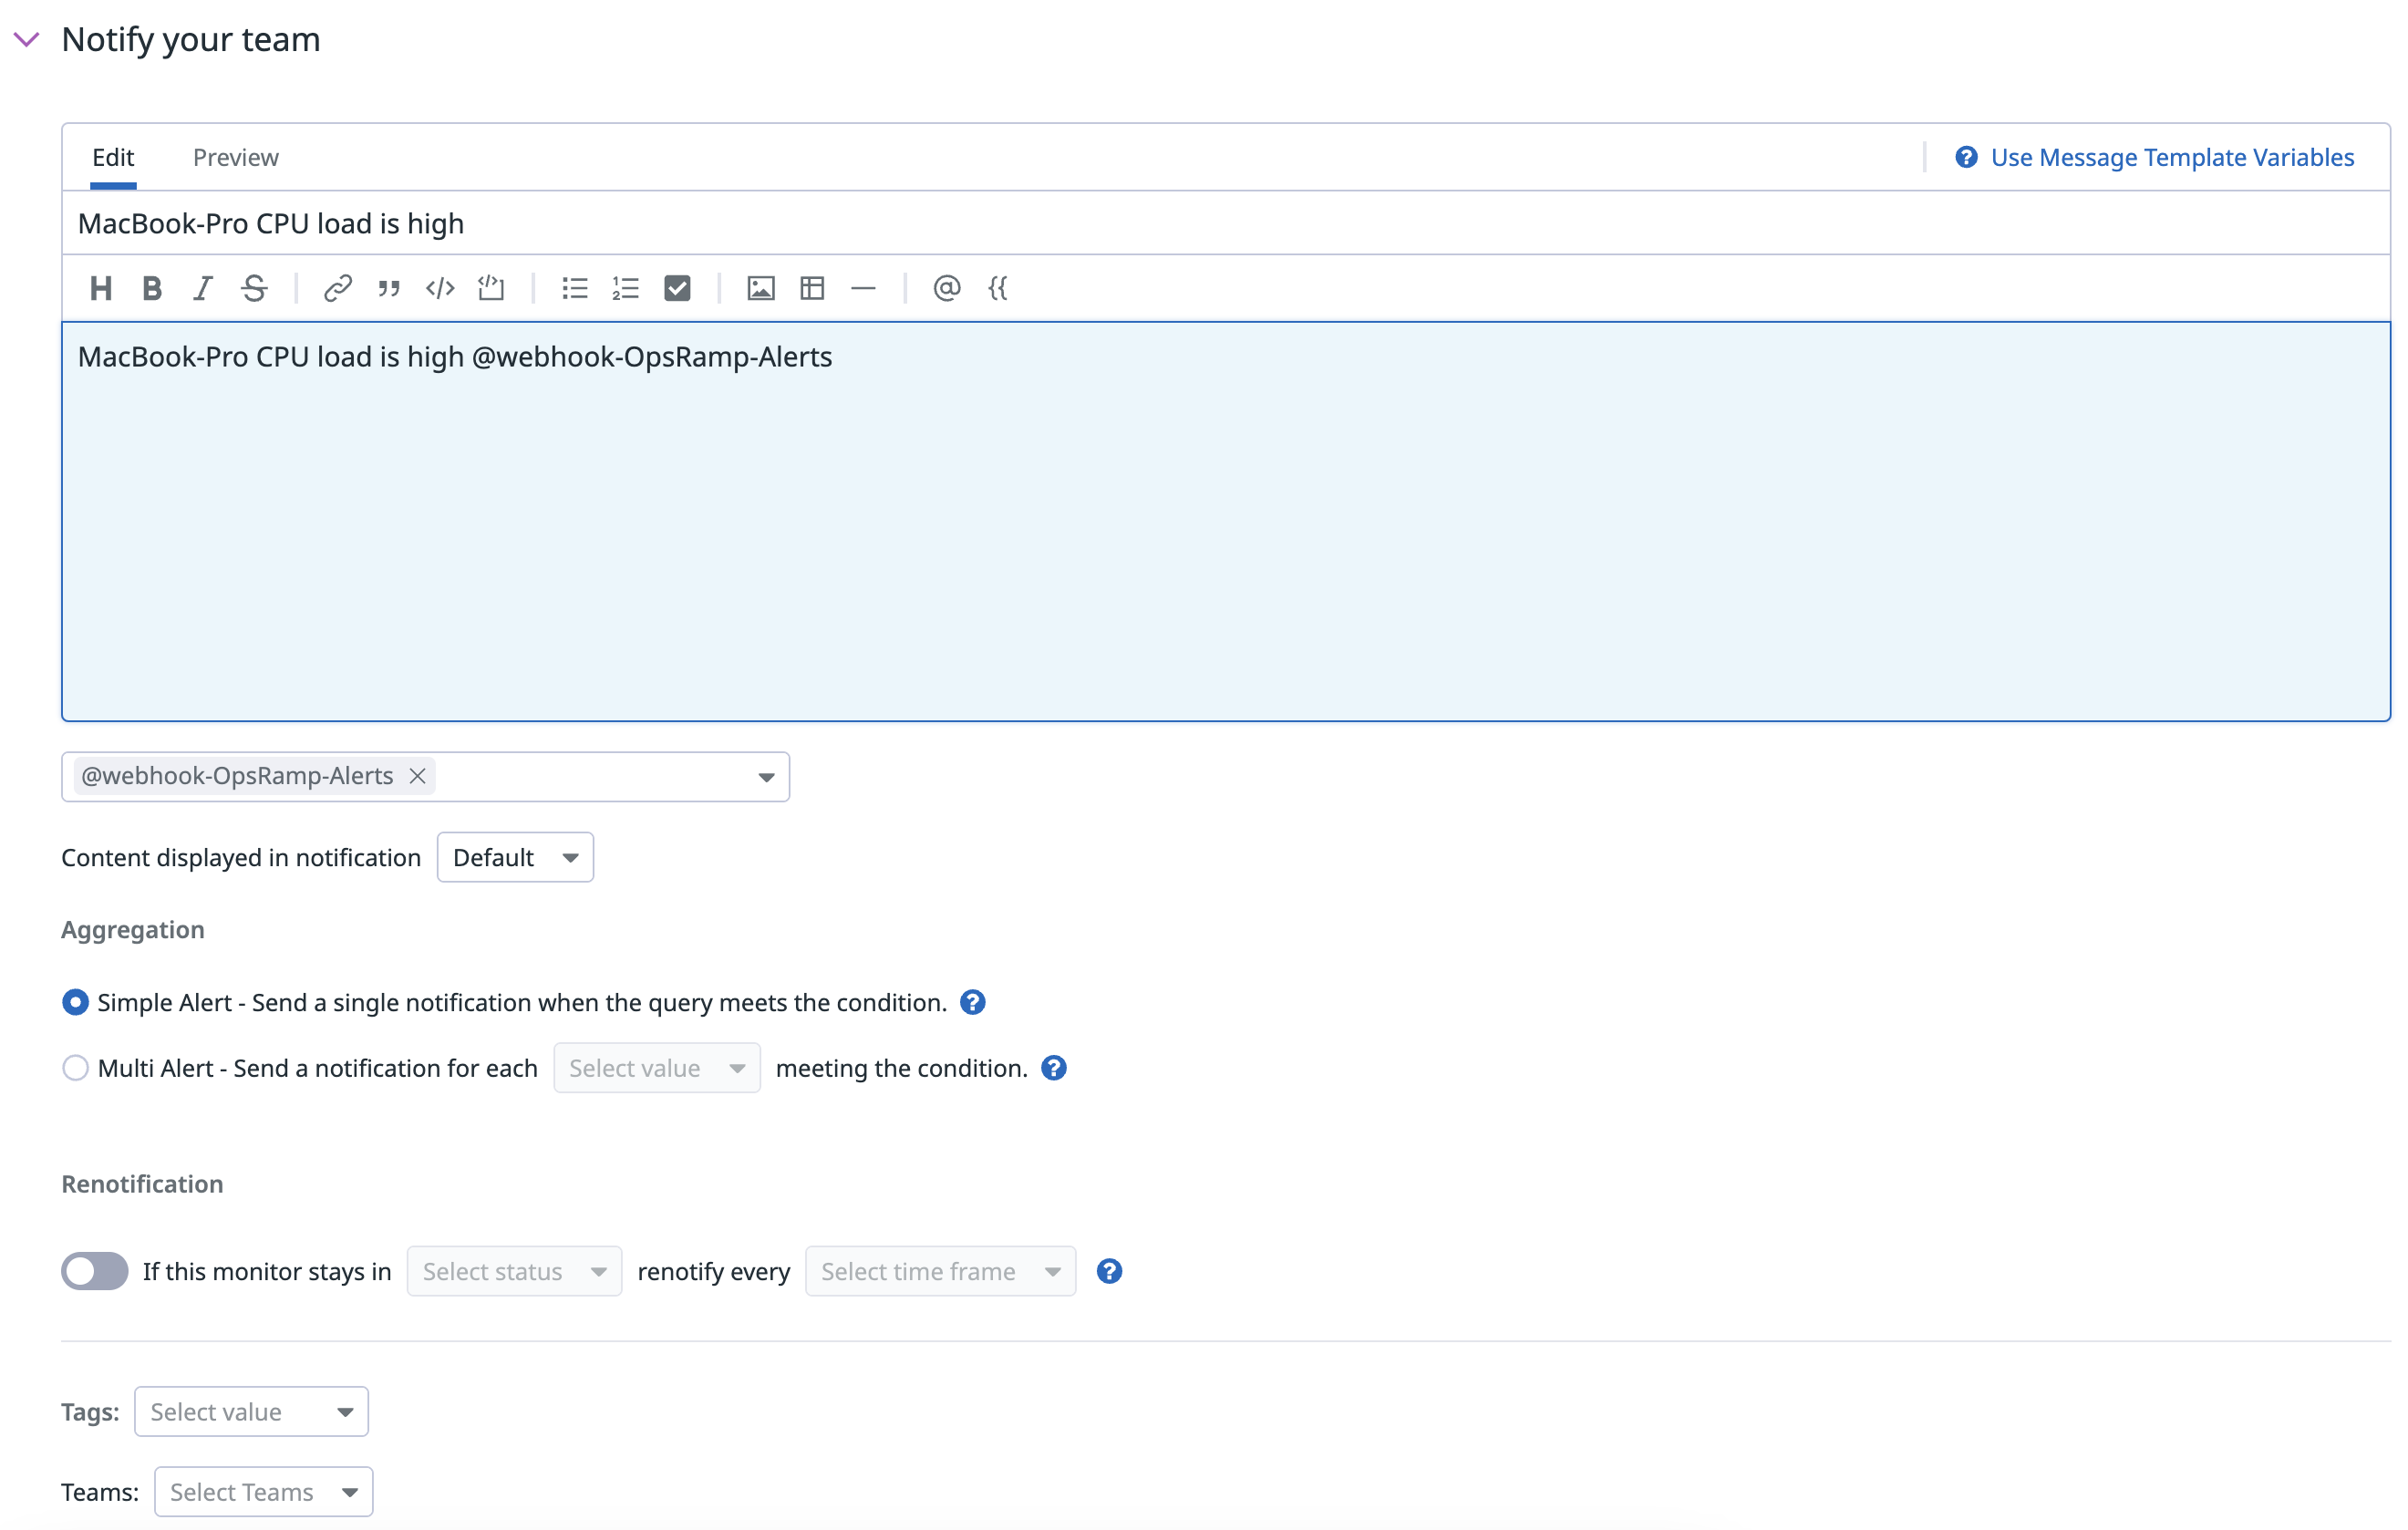
- In the Notify your team section, type
@to see the available list of Webhooks to trigger. - Select the configured Webhook and specify notifications and restrictions for notification.
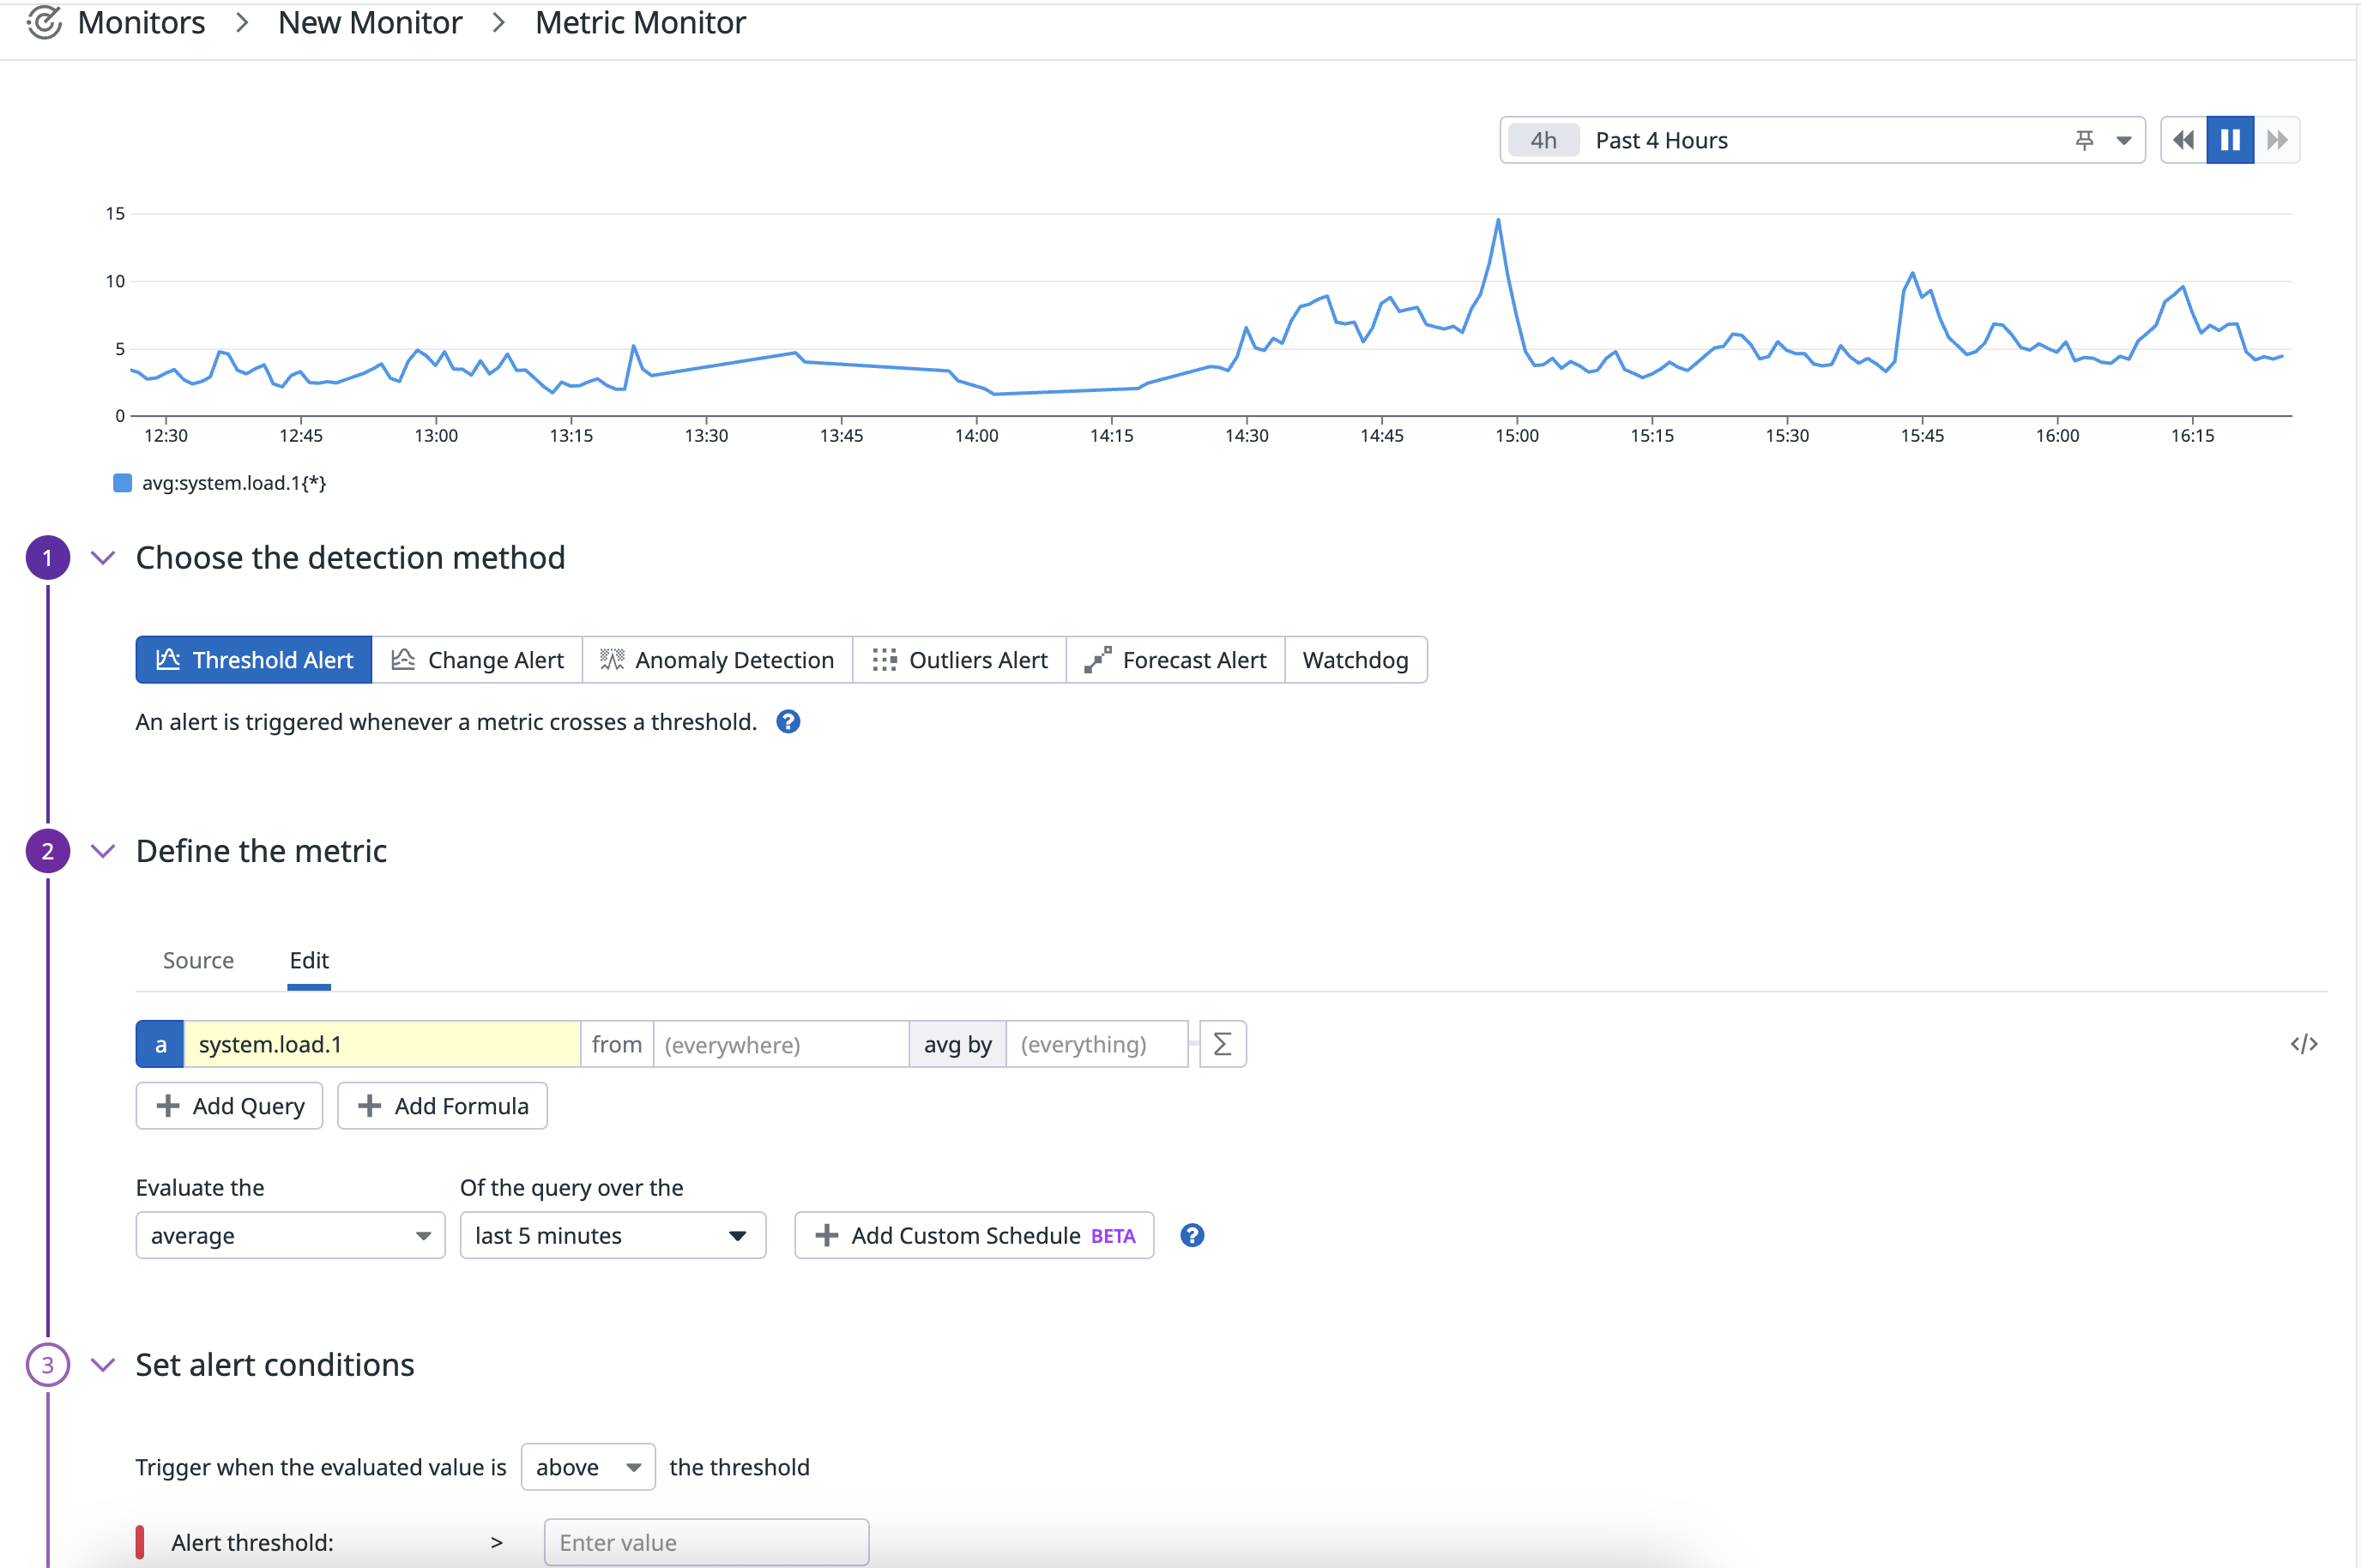
When a monitor alerts, a POST request is sent to the Webhook URL.
Error Codes - Inbound Webhook Event integration
See Integrations for information on the error codes.